
ABSTRACT
HOXA4 is a novel oncogene that has been observed in many kinds of tumors, but its role during glioma carcinogenesis and its clinical significance in diagnosing and prognosis human glioma remains unknown. In the present study, the Chinese Glioma Atlas (CGGA)-RNA sequencing database, CGGA microarray, and The Cancer Genome Atlas (TCGA)-RNA seq data from 1674 glioma patients were obtained from online databases and analyzed using quantitative reverse transcription-polymerase chain reaction (RT-qPCR) to detect changes in the expression level of HOXA4 and characterize the relationship between HOXA4 and the clinical characteristics and prognosis of patients with glioma. Gene set enrichment analysis (GSEA) was used to reveal how HOXA4 regulates tumor-related pathways. HOXA4 mRNA levels in glioma tissue were higher than those in adjacent brain tissue. HOXA4 expression was also closely related to the clinical and molecular characteristics of gliomas, such as tumor grade and isocitrate dehydrogenase (IDH) mutation. Functional enrichment analysis revealed that HOXA4 could regulate cancer-related signal pathways, such as Cell cycle, Cell adhesion molecules cams, and JAK/STAT signaling pathway. Results of in vitro experiments confirmed that knockdown of HOXA4 blocks the cell cycle pathway and inhibits the proliferation, invasion and chemotherapy resistance in gliomas. We concluded that HOXA4 was an independent risk factor for glioma and may have clinical diagnostic potential. Meanwhile, our findings revealed that HOXA4 could be used as a biomarker for glioma diagnosis and treatment.
Introduction
Glioma is the most common intracranial malignant tumor caused by neural stem cells or neural precursor cells and is associated with a high postoperative recurrence rate and resistance to chemotherapy. The annual incidence is about 4.5/100,000 [Citation1,Citation2]. According to the 2007 World Health Organization (WHO) histopathological standards, gliomas can be classified according to various types and malignancy grades (I–IV) [Citation3]. With increasing tumor grade, the invasion and malignancy of the tumor cells gradually increase [Citation4]. To improve the prognosis outcomes of patients with glioma, comprehensive treatments like neurosurgical resection, adjuvant radiotherapy, and alkylating agent temozolomide chemotherapy have been used [Citation5]. However, the clinical prognosis of patients with glioma is still unsatisfactory [Citation6]. The 5-year survival rate of patients with low-grade glioma is 30–70%, while the median survival time of patients with the most malignant glioblastoma is only 9–12 months, and the 5-year survival rate is less than 5% [Citation7]. This is mainly due to the complicated, poorly understood pathological mechanism of glioma and the lack of effective therapeutic targets. The search for a reliable biomarker for the diagnosis and prognosis of glioma is therefore of great urgency. Previous reports have confirmed that the HOX gene family plays a vital regulatory role in the evolution of cancers and is strongly associated with prognosis [Citation8,Citation9].
HOXA, HOXB, HOXC, and HOXD constitute the HOX gene family and are located in different chromosomal regions [Citation10]. The HOXA gene family encodes proteins that contain the DNA-binding homeobox motif and controls the early patterns of embryo segmentation in addition to later developmental events [Citation11]. Several studies have shown that the HOXA gene family is associated with various cancer types [Citation12,Citation13]. For instance, Li et al. reported that overexpression of HOXA10, HOXA11, and HOXA13 serves as a predictive biomarker of unfavorable survival in patients with laryngeal squamous cell cancer [Citation14]. As a key member of the a subfamily, HOXA4 is widely involved in various physiological and pathological processes in organisms through many well-known signaling pathways [Citation9,Citation15,Citation16]. HOXA4 plays an important role in cell reproduction, differentiation, apoptosis, and signal transduction [Citation17]. Current studies have shown that abnormal expression of HOXA4 plays an important role in the pathogenesis and affects the prognosis and recurrence of various cancers [Citation18–20]. For instance, HOXA4 can inhibit the proliferation and gefitinib resistance of non-small cell lung cancer by regulating miR-138 [Citation21]. Accumulated evidence has indicated the abnormal expression of HOXA4 in cancers could make contributions to carcinogenesis. Nevertheless, no study has previously reported a significant association between HOXA4 expression and prognosis of human glioma.
In the present study, we comprehensively analyzed the molecular pattern and clinical relevance of HOXA4 in glioma patients. We evaluated its expression, prognostic value, and biological functions in a large cohort of glioma samples. Abnormally high expression of HOXA4 was observed in glioma tissue using quantitative reverse transcription-polymerase chain reaction (RT-qPCR) and immunohistochemistry (IHC) at the mRNA and protein levels, respectively. Our results suggested that a significant association between HOXA4 expression and poor prognosis in glioma patients. Also, experimental results suggest that HOXA4 is involved in regulating the malignant characteristics of gliomas. Furthermore, HOXA4 expression may be used to inform the diagnosis and treatment of human glioma as an independent risk factor.
Materials and methods
Data collection
A total of 1674 patients with glioma were collected from the Chinese Glioma Atlas (CGGA, http://www.cgga.org.cn/help.jsp) [Citation22] and The Cancer Genome Atlas (TCGA, https://portal.gdc.cancer.gov/) [Citation23], including: CGGA-RNA sequencing database (n = 749), CGGA- microarray database (n = 268), and TCGA-RNA seq (n = 657). Table S1, Table S2, and Table S3 provide the patients’ clinical information in these three databases. The microarray dataset GSE4290 was downloaded from the Gene Expression Omnibus (GEO, https://www.ncbi.nlm.nih.gov/geo/) database [Citation24], and the Limma package in R software (v3.6.1) was used to evaluate the differential expression of HOXA4 in glioma tissues and non-tumor tissues. The Gene Expression Profiling Interactive Analysis (GEPIA, http://gepia.cancer-pku.cn) contains expression data from tumor and non-tumor samples [Citation25]. The HOXA4 glioma expression level data was obtained from GEPIA, while protein localization and expression data from human tissues and cells were obtained from the Human Protein Atlas (HPA, https://www.proteinatlas.org/) [Citation26]. The HPA contains validated antibodies for mapping the entire human proteome with immunohistochemistry (IHC) and immunocytochemistry (ICC) [Citation27]. Then, we verified the HOXA4 expression in glioma tissue by using reverse transcription-quantitative polymerase chain reaction (RT-qPCR). Tumor and adjacent brain tissue from five glioma patients were obtained from Henan Provincial People’s Hospital during surgery and stored in liquid nitrogen. The clinical characteristics were presented in Table S4. The use of patient samples complied with the Declaration of Helsinki. The study protocol was approved by the ethics committee of Henan Provincial People’s hospital (2020, ethical review No. 107).
Gene set enrichment analysis (GSEA) of HOXA4
GSEA analysis can be used to determine if there are statistically significant differences in a set of predefined genes between two biological states. We used GSEA to determine whether the differences in the expression levels of the predefined genes between the high-level and low-level HOXA4 expression groups were statistically significant. Each analysis involved 1000 genome permutations. We then subjected the dataset to enrichment analysis by using the KEGG database.
Cell lines and cell culture
The human glioma cell line (U251) and the normal control cell (Human astrocyte, HA) were purchased from Procell Life Science & Technology Co. Ltd (Wuhan, China). Both cell lines were maintained in DMEM medium supplemented with 10% FBS(Gibco) and 1% penicillin/streptomycin (Procell, Wuhan, China). All cells were cultivated in an incubator with constant temperature containing a 5% CO2 atmosphere at 37°C.
Cell transfection
The small interfering RNA (siRNA) was constructed by GenePharma (GenePharma, Shanghai, China). shows all the sequences of HOXA4 siRNA and negative control (NC) siRNA. According to the instructions, the U251 cells in the logarithmic growth phase were digested by 0.25% pancreatin and evenly placed on a 6-well plate. After 60–70% confluence, the cells were transfected with HOXA4-siRNA and NC-siRNA (100 pmol/l) using siRNA-Mate (GenePharma, Shanghai, China). The transfection efficiency was measured by RT-qPCR analysis 48 h after transfection. The siRNA with the best transfection efficiency was used for subsequent experiments.
Table 1. RNA oligo sequence of siRNA.
RNA isolation and RT-qPCR analysis
Use RT-qPCR to detect HOXA4 expression in glioma tissues and cells. First, total RNA was isolated using the TRI-Reagent (Sigma, USA), according to the manufacturer’s instructions. RNA quality was estimated using the NanoDrop One Spectrophotometer (Thermo Fisher Scientific, USA). Total RNA was reverse transcribed into cDNA using a Transcriptor First Strand cDNA Synthesis Kit (Roche, USA), as per the manufacturer’s instructions. RT-qPCR was performed using the FastStart Universal SYBR Green Master (ROX) kit (Roche, Germany), according to the manufacturer’s instructions. The RT-qPCR results were analyzed using QuantStudio software (Thermo Fisher Scientific, USA), with GADPH as an internal reference. The primer sequence used was manifested as follows: GAPDH forward 5'-CAAGGTCATCCATGACAACTTTG-3' and GAPDH reverse 5'-GTCCACCACCCTGTTGCTGTAG-3'; HOXA4 forward 5'-ATAACGGAGGGGAGCCTAAG-3' and HOXA4 reverse 5'-GCTCAGACAAACAGAGCGTG −3'.
CCK8 assay
CCK8 assay (Dojindo, Japan) was used to detect cell proliferation and chemotherapeutic resistance in U251. A total of 24 h post-transfection, the transfected U251 cells were seeded into 96-well plates and used CCK8 to detect cell proliferation conditions after culturing for 96 hours. The detection steps are as follows: removing the medium, then adding 10 μl of CCK-8 reagent and 90ul DMSO medium to each well, followed by incubation for an additional 4 h. Finally, a spectrophotometer was used to detect the absorbance value (450 nm) to compare the cell proliferation speed of each group.
Colony formation analysis
The transfected U251 cells were seeded into a 6-well plate (200 cells/well) and cultured in a complete culture medium for 2 weeks. When about 50 cell clusters were seen under the microscope, the 6-well plate was taken out from the incubator. The cell colonies were washed with PBS, then fixed with 4% paraformaldehyde at room temperature for 30 minutes and stained with crystal violet for 10 minutes. Subsequently, washing cell colonies with ultrapure water and drying upside down. After taking pictures, using ImageJ software (Version 1.52) for subsequent analysis.
Wound healing assay
U251 cells to make the single-cell suspension, then cells were seeded in a 6 well plate at 4 × 10⁵/well and incubated in an incubator at 37°C with 5% CO2. When cells grew to 90% confluence, a linear scratch in the cell monolayer was made with a 200 μl sterile pipette and then washed 3 times with 1× PBS to remove detached cells. After that, the scratch width was observed and photographed under the microscope for 0 h and 48 h, respectively, and measured by using ImageJ software (Version 1.52).
Flow cytometry analyses for cell cycle
U251 cells transfected with siRNA were harvested and fixed in 70% ethanol overnight at −20°C. Next, cells were resuspended using 50 μg/μL propidium iodide (PI) and incubated with 0.1 μg/μL RNase for 30 min, and then applied to flow cytometry.
Western blotting
U251 cells treated with HOXA4-siRNA and NC-siRNA were collected and lysed, and total proteins were extracted for electrophoretic analysis. The proteins were then transferred to PVDF membranes, and skim milk was used to seal the membrane. Specific antibodies (CDK2, Cat 10,122-1-AP, Proteintech, China; CDK4, Cat 11,026-1-AP, Proteintech, China; Cyclin E1, Cat 11,554-1-AP, Proteintech, China; β-actin, Cat 66,009-1-Ig, Proteintech, China) are used to incubate the membrane at 4°C overnight. After further incubation with HRP-conjugated antibodies, protein bands were shown and recorded.
Statistical analysis
R software (v.3.6.1 version) and GraphPad Prism (v8.0.2) was used to process data and perform statistical analysis. The association between clinical characteristics and gene expression was analyzed by the Wilcox test and the Kruskal-Wallace test. We used the Kaplan-Meier method and Cox regression analysis to analyze the relationship between HOXA4 expression level and survival rates. P < 0.05 was statistically significant.
Results
Abnormal expression of HOXA4 in tumor tissues
The Gene Expression Profiling Interactive Analysis (GEPIA) database contains gene expression data for different human tumors. We searched for HOXA4 data and found that the HOXA4 expression level increased significantly in tumors such as glioblastoma multiforme, pancreatic adenocarcinoma, thymoma, and kidney renal clear cell carcinoma. In contrast, its expression level decreased in tumors such as invasive breast carcinoma, esophageal carcinoma, colon adenocarcinoma, kidney chromophobe, lung adenocarcinoma, lung squamous cell carcinoma, rectum adenocarcinoma, thyroid carcinoma, and uterine corpus endometrial carcinoma. The expression level of HOXA4 in glioblastoma (GBM) was higher than that in non-tumor tissues ()).
Figure 1. (a) Expression levels of HOXA4 in various human tumor tissue samples. The color of the tumor type represents the level of HOXA4 expression in the tumor: red denotes high expression, while green denotes low expression. (b) Seventy-seven glioma tissue specimens were compared with twenty-three standard brain tissue specimens obtained from the GSE4290 dataset. The expression level of HOXA4 in glioma tissue was significantly higher than that in normal brain tissue. (c) Results of RT-qPCR comparison of HOXA4 levels in five glioma tissue samples and five adjacent brain tissue samples. The RT-qPCR results verified that HOXA4 was expressed at higher levels in glioma tissue than in normal tissue.
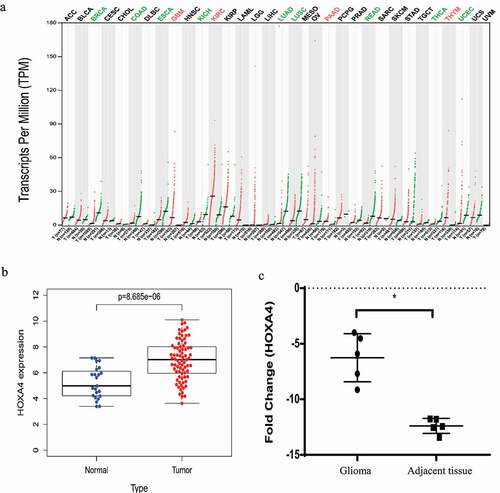
To further investigate the expression level and pathological role of HOXA4 in glioma tissue, we obtained a dataset from the Gene Expression Omnibus (GEO) database of GSE4290 glioma expression levels in 77 glioma tissue specimens and 23 standard brain tissue specimens. According to this dataset, the expression level of HOXA4 was significantly increased in glioma tissue relative to that in adjacent brain tissue ()). We verified this by measuring the expression level of HOXA4 in five gliomas and five non-tumor tissue samples by using RT-qPCR ()). Our RT-qPCR analysis results confirmed that the expression of HOXA4 was higher in glioma tissue than that in normal brain tissue, but the function of HOXA4 in gliomas remains unknown.
Increased expression of HOXA4 led to a reduction in the overall survival of glioma patients
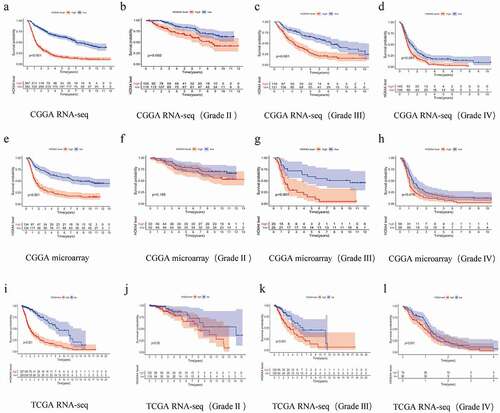
To determine the clinical significance of HOXA4 expression regarding the prognosis of glioma patients, we performed a Kaplan-Meier analysis of 1672 patients with glioma. By analyzing the data from three databases, we determined that the overall survival (OS) of patients with elevated HOXA4 expression was considerably lower than that of patients with low expression of HOXA4 ()) but that the relationship between the high expression level of HOXA4 and survival was different for patients with different grades of glioma. In the CGGA RNA-seq dataset, for patients with WHO II, III, and IV glioma, a high HOXA4 expression level was associated with a shorter survival time (). In the TCGA RNA-seq dataset, a high HOXA4 expression level was also associated with reduced survival time in patients with WHO III glioma. However, there was no association with the survival time of patients with WHO II and WHO IV glioma (). In the CGGA microarray dataset, although an elevated HOXA4 expression level was associated with a reduced survival time of WHO II and III glioma patients, its association with the survival time of WHO IV glioma patients were not statistically significant ()). This suggested that the overexpression of HOXA4 was closely linked to poor prognosis in glioma patients. However, the relationship between HOXA4 and clinicopathological features remains unclear.
Figure 2. Impact of HOXA4 expression on the overall survival of glioma patients. Data are from the CGGA RNA-seq dataset (a–d), CGGA microarray dataset (e–h), and TCGA RNA-seq dataset (i–l).
Univariate and multivariate analysis results
Univariate analysis with Cox regression revealed that the expression of HOXA4 as a categorical dependent variable was linked to unfavorable clinical outcomes. In the CGGA RNA-seq dataset, a high level of HOXA4 expression in glioma patients was significantly linked to poor prognosis (P < 0.001, [HR] = 1.537 (95% confidence interval (CI) [1.449–1.630])), older age (P < 0.001, [HR] = 1.624 (95% CI [1.345–1.960])), high histology (P < 0.001, [HR] = 4.487 (95% CI [3.695–5.449])), PRS type (P < 0.001, [HR] = 2.123 (95% CI [1.818–2.478])), high grade (P < 0.001, [HR] = 2.883 (95% CI [2.526–3.291])), 1p19q-codeletion (P < 0.001, [HR] = 0. 231 (95% CI [0.169–0.315])), and IDH mutation (P < 0.001, [HR] = 0.317 (95% CI [0.262–0.384])) ()). In the CGGA microarray dataset, a high HOXA4 expression level in glioma patients was closely associated with poor prognosis (P < 0.001, [HR] = 1.301 (95% CI [1.225–1.381])), older age (P < 0.001, [HR] = 1.736 (95% CI [1.283–2.349])), high histology (P < 0.001, [HR] = 4.437 (95% CI [3.235–6.086])), PRS type (P < 0.001, [HR] = 2.042 (95% CI [1.511–2.478])), high tumor grade (P < 0.001, [HR] = 2.567 (95% CI [2.125–3.100])), and IDH mutation (P < 0.001, [HR] = 0.423 (95% CI [0.309–0.579])) ()). In the TCGA RNA-seq dataset, a high level of HOXA4 expression in glioma patients was significantly associated with poor prognosis (P < 0.001, [HR] = 1.301 (95% CI [1.225–1.381])), older age (P < 0.001, [HR] = 1.736 (95% CI [1.283–2.349])), and high tumor grade (P < 0.001, [HR] = 2.567 (95% CI [2.125–3.100])) ()).
Figure 3. Results of univariate and multivariate analysis of clinical characteristics and HOXA4 expression data using a Cox regression model: results of (a) univariate analysis of the CGGA RNA-seq database, (b) multivariate analysis of the CGGA RNA-seq database, (c) univariate analysis of the CGGA microarray database, (d) multivariate analysis of the CGGA microarray database, (e) univariate analysis of the TCGA RNA-seq database, and (f) multivariate analysis of the TCGA RNA-seq database. Overall, higher HOXA4 expression levels were associated with poor clinical prognosis and survival in glioma patients.
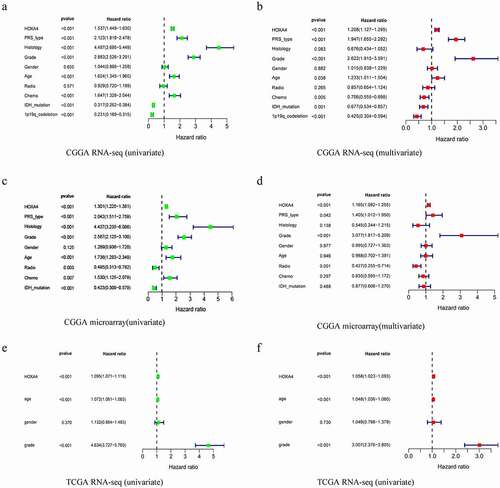
We next performed multivariate analysis with a Cox regression model. In the CGGA RNA-seq dataset, a high level of HOXA4 expression in glioma patients was closely linked with poor prognosis (P < 0.001, HR = 1.208 (95% CI [1.127–1.295])), PRS type (P < 0.001, HR = 1.947 (95% CI [1.655–2.292])), high grade (P < 0.001, HR = 2.622 (95% CI [1.915–3.591])), and 1p19q-codeletion (P < 0.001, HR = 0.425 (95% CI [0.304–0.594])) ()). In the CGGA microarray dataset, a high level of HOXA4 expression in glioma patients was significantly linked with poor prognosis (P < 0.001, HR = 1.165 (95% CI [1.082–1.225])) and patients with high tumor grade (P < 0.001, HR = 3.077 (95% CI [1.817–5.209])) ()). In the TCGA RNA-seq database, a high level of HOXA4 expression in glioma patients was linked to poor prognosis (P < 0.001, HR = 1.058 (95% CI [1.023–1.093])) and older age (P < 0.001, HR = 3.007 (95% CI [2.376–3.805])) ()). These results suggested that a high HOXA4 expression level might be a significant factor associated with poor prognosis in glioma patients.
Clinical diagnostic value of HOXA4
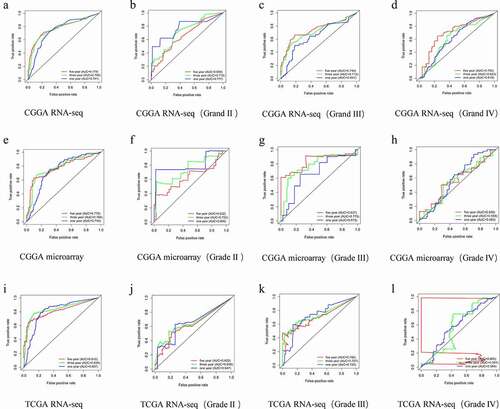
To validate the results of database-level analysis of HOXA4 expression in glioma tissue, ROC curves were generated for HOXA4 expression in gliomas of all grades. The three-year survival area under the curve (AUC) for patients with HOXA4 expression was 0.769 in the CGGA RNA-seq dataset ()), 0.784 in the CGGA microarray dataset ()), and 0.838 in the TCGA RNA-seq database ()). This indicated that the expression level of HOXA4 had diagnostic value that may be valuable in predicting the prognosis of patients with glioma. Interestingly, in the CGGA RNA-seq and CGGA microarray datasets, HOXA4 expression had diagnostic potential for WHO II gliomas ()) and statistically significant diagnostic potential for WHO III gliomas in all three datasets ()). As shown in ), the abnormally high expression level of HOXA4 observed in the CGGA RNA-seq, and TCGA RNA-seq databases had a credible predictive value for the prognosis of WHO III glioma patients at 5 years.
Figure 4. Diagnostic potential of HOXA4 expression in glioma. Results of analyzing the CGGA RNA-seq dataset (a-d), CGGA microarray dataset (e-h), and TCGA RNA-seq dataset (i-l).
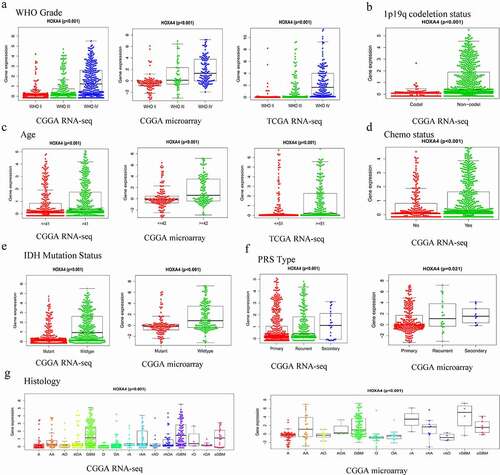
Correlation between HOXA4 expression and clinical characteristics in glioma patients
Glioma tissue with associated HOXA4 expression data from the CGGA RNA-seq, CGGA microarray, and TCGA RNA-seq datasets were analyzed ()). In the CGGA RNA-seq dataset, the expression level of HOXA4 was strongly associated with the tumor grade (P < 0.001), age (P < 0.001), histological type (P < 0.001), chemotherapy status (P < 0.001), 1p19q-codeletion status (P < 0.001), PRS type (P < 0.001), and IDH mutation status (P < 0.001) of the patients. In the CGGA microarray dataset, the expression level of HOXA4 was strongly associated with the tumor grade (P < 0.001), age (P < 0.001), histological type (P < 0.001), PRS type (P = 0.021), and IDH mutation status (P < 0.001) of the patients. In the TCGA RNA-seq dataset, the expression level of HOXA4 was strongly correlated with the tumor grade (P < 0.001) and age (P < 0.001) of the patients.
Figure 5. The relationship between the expression level of HOXA4 and various clinicopathological characteristics according to data obtained from the CGGA-RNA sequencing, CGGA microarray, and TCGA-RNA seq datasets. (a) Tumor grade, (b) 1p19q_codeletion status, (c) age, (d) chemotherapy status, (e) IDH mutation status, (f) PRS type, (g) Histology. A: Astrocytoma; AA: Anaplastic astrocytoma; AO: Anaplastic oligodendroglioma; AOA: Anaplastic oligoastrocytoma; GBM: Glioblastoma; O: Oligodendroglioma; OA: Oligoastrocytoma; rA: Relapse astrocytoma; rAA: Relapse anaplastic astrocytoma; rAO: Relapse anaplastic oligodendroglioma; rAOA: Relapse anaplastic oligoastrocytoma; rGBM: Relapse glioblastoma; rO: Relapse oligodendroglioma; rOA: Relapse oligoastrocytoma; sGBM: Secondary relapse glioblastoma.
HOXA4-related cellular signaling pathways
Gene set enrichment analysis (GSEA) was used to identify glioma-related signaling pathways in the high and low HOXA4 expression level CGGA-RNA seq data. This analysis revealed significant differences (NOM P-value <0.05 and FDR q-value <0.25) in the enrichment of the MSigDB collection (c2.cp.biocarta and h.all. v6.1. symbols). As shown in and , Cell cycle, Cell adhesion molecules cams, and Jak stat signaling pathway were all associated with the high HOXA4 expression level phenotype. The above pathways are closely related to cancer, indicating that HOXA4 may participate in the carcinogenesis and progression of glioma through these three tumor-related signaling pathways.
Figure 6. Gene set enrichment analysis (GSEA) of HOXA4 data obtained from the CGGA RNA-seq, CGGA microarray, and TCGA RNA-seq databases. The shared signaling pathways among the three datasets in glioma patients were the (a) Cell cycle, (b) Cell adhesion molecules cams, and (c) Jak stat signaling pathway.
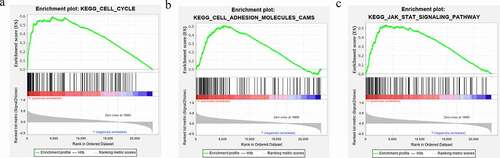
Table 2. The gene set enriches the high HOXA4 expression phenotype based on CGGA-RNA seq data.
Increased HOXA4 protein expression in glioma tissues
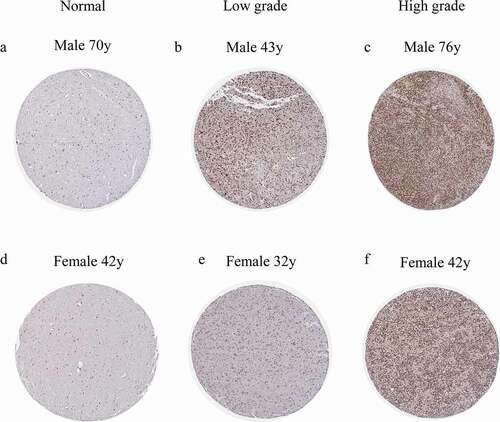
The Human Protein Atlas (HPA) provides a map of the distribution and relative abundance of proteins in normal brain tissue, low-grade glioma tissue, and high-grade glioma tissue. We divided this data into male v and female ()) groups. Compared with non-tumor tissues, HOXA4 protein expression in glioma tissues was upregulated, and its expression in high-grade glioma tissue was higher than that in lower-grade glioma tissue.
Figure 7. HOXA4 protein expression in tissues according to the immunohistochemistry analysis of data obtained from the Human Genome Atlas database. Protein expression (a, d) in normal tissue, (b, e) in low-grade glioma tissue, and (c, f) in high-grade glioma tissue.
Verification of the bioinformatics analysis results
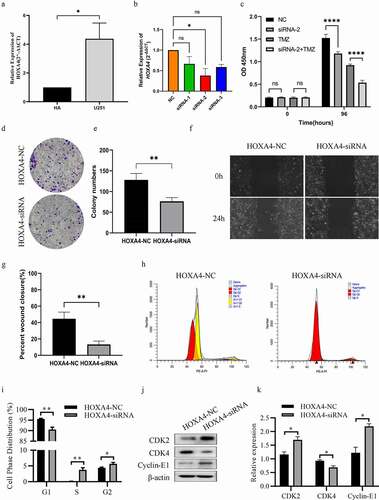
The above bioinformatics analysis results fully reveal that overexpression of HOXA4 could be used as an independent risk factor leading to poor prognosis in patients with glioma. To explore the vital role of HOXA4 in glioma more scientifically and rigorously, we further conducted in vitro experiments to validate our analysis results. First, we used RT-qPCR to detect the expression level of HOXA4 in the glioma cell line (U251) and corresponding normal cells (HA). As presented in ), the result showed that the HOXA4 expression level was significantly elevated in glioma cell lines. Then, we used siRNA to knock down the HOXA4 in U251 cells to evaluate the effect of U251 on the malignant biological behavior of glioma cells. Three siRNA fragments named siRNA-1, siRNA-2, and siRNA-3 were used, and siRNA-2 was chosen for subsequent experiments ()). The results of the CCK8 assay showed that the downregulation of HOXA4 could inhibit cell proliferation ability and chemotherapeutic resistance in U251 cells ()). In addition, the results of the colony formation assay also confirmed that the cell proliferation ability decreased obviously after the reduction of HOXA4 expression, which was consistent with the CCK8 assay results ()). Finally, the wound healing experiment results demonstrated that HOXA4 expression decreased could significantly inhibit the migration ability of U251 cells compared with the negative control group ()). Taken together, the results of in vitro experiments indicate that HOXA4 overexpression may lead to poor prognosis of glioma patients by enhancing the proliferation, migration, and chemotherapeutic resistance of glioma cells.
Figure 8. Downregulation of HOXA4 could inhibit the malignant phenotypes of U251 cells. (a) The expression levels of HOXA4 in U251 cell lines and HA were determined by RT-qPCR, (b) The interference efficiency of different si-RNA sequences for HOXA4 in U251 cell line, (c) CCK8 assays in U251 cells with si-RNA2 or NC treated with 40 μM TMZ, (d) Clone formation results of U251 cell lines transfected with si-RNA2 or NC, (e) Analysis of clone formation results, (f) Wound healing assay results U251 cell lines transfected with si-RNA2 or NC, (g) Analysis of wound healing assay results. (h) Flow cytometry results of cell cycle of U251 cell in different groups. (i) The distribution of cell phases in U251 cells of both groups. (j) The expression of cell cycle related proteins in siRNA treated cells. (k) Analysis of protein expressions in western blotting assay. ****P < 0.0001, ***P < 0.001, **P < 0.01, *P < 0.05.
Cell cycle pathway regulated by HOXA4
To answer the question through which mechanism HOXA4 regulates the malignant characteristics of glioma cells, experiments were performed to verify the role of HOXA4 on the cell cycle pathway based on the result of GSEA analysis. Flow cytometry results showed that knockdown of HOXA4 reduced the population of G1 phase cells and increased the population of G2/S phase cells ()). Combined with clone formation experiment, it can be concluded that knockdown of HOXA4 blocks the cell cycle in the G2/S phase. Moreover, western blotting experiments confirmed that CDK2 and Cyclin E1 expression was increased in the HOXA4 knockdown group, while CDK4 expression was decreased ()). Combining the above experimental results, we have sufficient evidence to confirm that HOXA4 can regulate the cell cycle pathway, thus benefiting malignant progression such as abnormal proliferation of glioma.
Discussion
Gliomas are the most common primary intracranial malignant tumors [Citation28]. Due to their high recurrence rate and unfavorable prognosis, this tumor type is associated with a sizable economic burden [Citation6]. In recent years, although with the development of research, the biological and molecular basis of the occurrence and development of gliomas has been extensively verified, the diagnosis and treatment of tumors have also made significant progress. The prognosis of glioma patients is still poor [Citation29,Citation30]. Therefore, it is necessary further to study the clinical diagnosis and treatment of glioma, explore new risk factors and molecular markers, and develop new therapeutic targets to improve the clinical prognosis of patients with glioma. Previous studies have established that B7-H3 can be used as an immune-checkpoint therapy for glioma patients [Citation31]. As an independent prognostic factor, RGS16 plays a vital role in glioma progression, especially in GBM, and therapeutically targeting RGS16 may have positive effects on the patient response [Citation32]. HOXA4 is another gene whose potential for diagnosis and prognosis of other cancer types has been established. However, few reports regarding the relationship between HOXA4 and glioma have been published. In the present study, we aimed to analyze the expression of HOXA4 in glioma patients and to relate it to diagnosis, prognosis, and clinical outcomes, with the goal of establishing a novel therapeutic target for glioma.
In the present study, the result of survival analysis demonstrated that HOXA4 overexpression in glioma tissue was associated with poor prognosis in glioma. In previous studies, Ganapathi et al. used RNA sequencing data and qPCR to detect HOX markers for cell division and progression-free survival in patients with primary high-grade serous ovarian cancer (HGSOC). The HOXA4 risk score can be used as a prognostic biomarker for recurrence in patients with HGSOC in cases where there is no effective biomarker other than mutations in BRCA1/2 and homologous recombination-related genes [Citation33]. Our results of ROC analysis of the CGGA RNA-seq and CGGA microarray datasets indicated that HOXA4 also had clinical diagnostic value for WHO II glioma and the results of analyzing all three datasets indicated clinical diagnostic value for WHO III glioma. These results provided preliminary evidence that HOXA4 might be a prognostic factor for glioma patients.
To further explore whether HOXA4 overexpression can be an independent risk factor for the prognosis of glioma, we carried out the univariate and multivariate analyses. According to the univariate and multivariate analysis results, the prognostic value of HOXA4 expression level was independent of well-known clinical prognostic factors, including age and gender, further attesting to its potential usefulness in clinical practice. This supports previous reports showing that the HOX gene family has predictive value for the prognosis of human tumors [Citation34]. MassARRAY and pyrosequencing have been used to measure the methylation of HOXA3, 7, 9, and 10 in glioma specimens, with hypermethylation of these genes identified as a prognostic factor for patients with glioma [Citation35]. Hung et al. compared the expression profiles of pancreatic cancer cells among three genetically engineered mice with different proliferation and metastasis capacities. They found that HOXA3, B8, and C5 overexpression was related to low survival rates for pancreatic cancer, indicating that these genes have an oncogenic role [Citation36]. Furthermore, our in vitro experiments validated these bioinformatics analysis results. The results from our in vitro assays indicated that upregulation of HOXA4 may promote the proliferation, migration, and chemotherapy resistance of glioma cells, leading to poor prognosis in glioma patients. However, the specific molecular mechanism remains unclear.
Subsequently, to further reveal the specific mechanism of HOXA4 leading to poor prognosis of patients with glioma, we used GSEA to identify related enriched signaling pathways. GSEA is widely used to reveal the molecular mechanisms underlying diseases and has high reliability. Compared with traditional analysis methods, GSEA has the advantage of using large samples and can avoid the inherent deviation of experimental results caused by artificial threshold settings [Citation37]. The GSEA results indicated that the patients with HOXA4 overexpression were enriched in tumor-associated signaling pathways such as Cell cycle, Cell adhesion molecules cams, and JAK/STAT signaling pathway. These pathways contribute to the proliferation, migration, and recurrence of cancer cells and are considerably involved in the development and progression of tumors [Citation38–42]. Similar interactions have been described previously. For instance, Previous studies have proven that proteins that regulate cell cycle pathways may lead to the progression, recurrence, and poor prognosis of glioma [Citation43]. Peng C et al. showed that 1,2:5,6-Dihydrogalactitol inhibits the growth of human glioma cells in vivo and in vitro by blocking the cell cycle in G (2)/M phase [Citation44]. Additionally, recent studies have shown that changes in cell adhesion molecules play a key role in tumor progression. They not only define the adhesion function of tumor cells, but also directly affect the classical signal transduction pathways, thereby regulating the metastatic behavior of tumor cells [Citation45]. Moreover, aberrant JAK/STAT signaling has been identified to contribute to cancer progression and metastatic development [Citation46]. Chun Hua Xu et al. revealed that the microRNA-221/222 cluster promotes glioblastoma angiogenesis by activating the cytokine signaling-3 dependent JAK/STAT pathway [Citation47]. Collecting the above results, these above-mentioned cancer-related signaling pathways may be a way for HOXA4 to lead to a poor prognosis of patients with glioma.
As enlightened by the above-mentioned results, we have conducted a more in-depth validation of the specific mechanism of HOXA4 function in glioma. First, in vitro experiments demonstrated that HOXA4 can promote malignant proliferation of glioma cells by regulating the cell cycle pathway. As reported, regulators of cell cycle pathway can significantly influence the progression of glioma [Citation48]. For example, miR-188, which is targeting β-catenin, damages the proliferation of glioma by inhibiting G1-S transition [Citation49]. Second, HOXA4, like other prognostic factors of glioma, can influence the malignant characteristics of glioma cells such as invasion and chemotherapy resistance. As a novel target for the prognosis prediction of glioma, LncRNA GAS5-AS1 can inhibit the invasion of U251 cells through miR-106b-5p/TUSC2 axis [Citation50]. Also, it’s reported that the underexpression of HOXA11 is associated with treatment resistance and poor prognosis in glioblastoma [Citation51]. The above results suggest that HOXA4 has diverse functions in glioma and may be involved in multiple signaling pathways that mediate malignant progression of glioma. This study further expands the biological functions of HOXA4 and provides a potentially important biomarker for glioma treatment, in which targeted therapy on HOXA4 may lead to a better prognosis for glioma patients.
Conclusion
In conclusion, we are the first to identify the HOXA4 expression associated with the clinical characteristics and prognosis of patients with glioma. At the same time, this study revealed that the overexpression of HOXA4 could be used as independent prognostics biomarker for glioma, and the downregulation of HOXA4 can block the cell cycle progression and inhibit glioma cell proliferation, migration, and chemotherapeutic resistance. It is reasonable to believe that HOXA4 can be used as a potential diagnostic and therapeutic target to improve the prognosis of glioma.
Ethics approval
The study was approved by the Ethics Review Committee of Henan provincial people’s hospital (Zhengzhou, China).
Supplemental Material
Download Zip (3.1 MB)Acknowledgments
Thank all members of CGGA, TCGA, GEO, GEPIA, and HPA database for providing a good platform for researchers.
Disclosure statement
No potential conflict of interest was reported by the author(s).
Data availability statement
All raw data included in this manuscript can be found in the online repository (chengMD2022/HOXA4- (github.com)).
Supplementary material
Supplemental data for this article can be accessed online at https://doi.org/10.1080/15384101.2022.2096715
Additional information
Funding
References
- Ohgaki H, Kleihues P, Kleihues P, et al. Epidemiology and etiology of gliomas. Acta Neuropathol. 2005;109(1):93–108. Acta Neuropathol (Berl).
- Larjavaara S, Maentylae R, Salminen T, et al. Incidence of gliomas by anatomic location. Neuro Oncol. 2007;9(3):319.
- Ostrom QT, Gittleman H, Stetson L, et al. Epidemiology of intracranial gliomas. Prog Neurol Surg. 2018;30:1–11.
- Liu Y, Hu H, Wang K, et al. Multidimensional analysis of gene expression reveals TGFB1I1-induced EMT contributes to malignant progression of astrocytomas. Oncotarget. 2014;5(24):12593–12606.
- Hsu K, Whitham E, Kichenadasse G. Potential role of cannabidiol for seizure control in a patient with recurrent glioma. J Clin Neurosci. 2019;71:275–276.
- Lemee JM, Clavreul A, Menei P. Intratumoral heterogeneity in glioblastoma: don’t forget the peritumoral brain zone. Neuro Oncol. 2015;17(10):1322–1332.
- Xia P, Li Q, Wu G, et al. An immune-related lncRNA signature to predict survival in glioma patients. Cell Mol Neurobiol. 2021;41(2):365–375.
- Akhir M, Choy CS, Abdullah MA, et al. The role of ISL1 and LHX5 LIM homeobox genes in bladder tumourigenesis. Malays J Med Sci. 2020;27(1):37–45.
- Ota T, Klausen C, Salamanca MC, et al. Expression and function of HOXA genes in normal and neoplastic ovarian epithelial cells. Differentiation. 2009;77(2):162–171.
- Schiemann SM, Martin-Duran JM, Borve A, et al. Clustered brachiopod hox genes are not expressed collinearly and are associated with lophotrochozoan novelties. Proc Natl Acad Sci U S A. 2017;114(10):E1913–E22.
- Rezsohazy R, Saurin AJ, Maurel-Zaffran C, et al. Cellular and molecular insights into hox protein action. Development. 2015;142(7):1212–1227.
- Fan W, Zhang C, and Cai J, et al. Upregulation of long noncoding RNA HOXA-AS3 promotes tumor progression and predicts poor prognosis in glioma. Oncotarget. 2017;8(32):53110–53123.
- Lin S, Zhang R, An X, et al. LncRNA HOXA-AS3 confers cisplatin resistance by interacting with HOXA3 in non-small-cell lung carcinoma cells. Oncogenesis. 2019;8(2):8.
- Li J, Ye M, Zhou C. Expression profile and prognostic values of HOXA family members in laryngeal squamous cell cancer. Front Oncol. 2020;10:368.
- Omatu T. Overexpression of human homeobox gene in lung cancer A549 cells results in enhanced motile and invasive properties. Hokkaido Igaku Zasshi. 1999;74(5):367–376.
- Kim HJ, Roh MS, Son CH, et al. Loss of Med1/TRAP220 promotes the invasion and metastasis of human non-small-cell lung cancer cells by modulating the expression of metastasis-related genes. Cancer Lett. 2012;321(2):195–202.
- Cheng S, Qian F, Huang Q, et al. HOXA4, down-regulated in lung cancer, inhibits the growth, motility and invasion of lung cancer cells. Cell Death Dis. 2018;9(5):465.
- Wang J, Su Z, Lu S, et al. LncRNA HOXA-AS2 and its molecular mechanisms in human cancer. Clin Chim Acta. 2018;485:229–233.
- Strathdee G, Sim A, Parker A, et al. Promoter hypermethylation silences expression of the HoxA4 gene and correlates with IgVh mutational status in CLL. Leukemia. 2006;20(7):1326–1329.
- Gray S, Pandha HS, Michael A, et al. HOX genes in pancreatic development and cancer. Jop. 2011;12(3):216–219.
- Tang X, Jiang J, Zhu J, et al. HOXA4-regulated miR-138 suppresses proliferation and gefitinib resistance in non-small cell lung cancer. Mol Genet Genomics. 2018;294(1):1–9.
- B ZZA, Knza C, and D QWA, et al., Chinese glioma genome atlas (CGGA): a comprehensive resource with functional genomic data from Chinese glioma patients - sciencedirect. Genom Proteom Bioinf. 2021;19(1):1–12.
- Tomczak K, Czerwinska P, and Wiznerowicz M. The cancer genome atlas (TCGA): an immeasurable source of knowledge. Wspolczesna Onkologia-Contemporary Oncology. 2015;19:A68–77.
- Meltzer DPS. GEOquery: a bridge between the gene expression omnibus (GEO) and bioconductor. Bioinformatics. 2007;23(14):1846–1847.
- Tang Z, Li C, Kang B, et al. GEPIA: a web server for cancer and normal gene expression profiling and interactive analyses. Nucleic Acids Res. 2017;45(W1):W98–W102.
- Thul PJ, Lindskog C. The human protein atlas: a spatial map of the human proteome. Protein Sci A Publ Protein Soc. 2017;27(1):233–244
- Thul PJ, Lindskog C. The human protein atlas: a spatial map of the human proteome. Protein Sci. 2018;27(1):233–244. 10.1002/pro.3307.
- Wen PY, Reardon DA. Neuro-oncology in 2015: progress in glioma diagnosis, classification and treatment. Nat Rev Neurol. 2016;12(2):69–70.
- Grimm SA, Chamberlain MC. Brainstem glioma: a review. Curr Neurol Neurosci Rep. 2013;13(5). 10.1007/s11910-013-0346-3
- Cooney T, Lane A, Bartels U, et al. HG-109contemporary survival endpoints: an international diffuse intrinsic pontine glioma registry study. Neuro Oncol. 2016;18(suppl 3):iii73.4–iii74.
- Wang Z, Wang Z, Zhang C, et al. Genetic and clinical characterization of B7-H3 (CD276) expression and epigenetic regulation in diffuse brain glioma. Cancer Sci. 2018;109(9):2697–2705.
- Huang R, Li G, and Zhao Z, et al., RGS16 promotes glioma progression and serves as a prognostic factor. CNS Neurosci Ther. 2020;26(8):791–803.
- Miller KR, Patel JN, Zhang Q, et al. HOXA4/HOXB3 gene expression signature as a biomarker of recurrence in patients with high-grade serous ovarian cancer following primary cytoreductive surgery and first-line adjuvant chemotherapy. Gynecol Oncol. 2018;149(1):155–162.
- Shah N, Sukumar S. The Hox genes and their roles in oncogenesis. Nat Rev Cancer. 2010;10(5):361–371.
- Di Vinci A, Casciano I, Marasco E, et al. Quantitative methylation analysis of HOXA3, 7, 9, and 10 genes in glioma: association with tumor WHO grade and clinical outcome. J Cancer Res Clin Oncol. 2012;138(1):35–47.
- Kuo TL, Cheng KH, and Chen LT, et al. Deciphering the potential role of hox genes in pancreatic cancer. Cancers (Basel). 2019;11(5):734.
- Subramanian A, Tamayo P, Mootha VK, et al. Gene set enrichment analysis: a knowledge-based approach for interpreting genome-wide expression profiles. Proc Natl Acad Sci USA. 2005;102(43):15545–15550.
- Phan TG, Croucher PI. The dormant cancer cell life cycle. Nat Rev Cancer. 2020;20(7):398–411.
- Yin X, Yang G, Ma D, et al. Inhibition of cancer cell growth in cisplatin-resistant human oral cancer cells by withaferin-A is mediated via both apoptosis and autophagic cell death, endogenous ROS production, G2/M phase cell cycle arrest and by targeting MAPK/RAS/RAF signalling pathway. J buon. 2020;25(1):332–337.
- Ren C, Ren T, Yang K, et al. Inhibition of SOX2 induces cell apoptosis and G1/S arrest in Ewing’s sarcoma through the PI3K/Akt pathway. J Exp Clin Cancer Res. 2016;35(1):44.
- Kobayashi H, Boelte KC, Lin PC. Endothelial cell adhesion molecules and cancer progression. Curr Med Chem. 2007;14(4):377–386.
- Groner B, von Manstein V. Jak Stat signaling and cancer: opportunities, benefits and side effects of targeted inhibition. Mol Cell Endocrinol. 2017;451:1–14.
- Jonsson P, Lin AL, Young RJ, et al. Genomic correlates of disease progression and treatment response in prospectively characterized gliomas. Clin Cancer Res off J Am Assoc Cancer Res. 2019;25(18):5537–5547.
- Peng C, Qi XM, Miao LL, et al. 1,2:5,6-dianhydrogalactitol inhibits human glioma cell growth in vivo and in vitro by arresting the cell cycle at G(2)/M phase. Acta Pharmacol Sin. 2017;38(4):561–570.
- Cavallaro U, Christofori G. Multitasking in tumor progression: signaling functions of cell adhesion molecules. Ann N Y Acad Sci. 2004;1014(1):58–66.
- Pencik J, Pham HT, Schmoellerl J, et al. JAK-STAT signaling in cancer: from cytokines to non-coding genome. Cytokine. 2016;87:26–36.
- Xu CH, Liu Y, Xiao LM, et al. Silencing microRNA-221/222 cluster suppresses glioblastoma angiogenesis by suppressor of cytokine signaling-3-dependent JAK/STAT pathway. J Cell Physiol. 2019;234(12):22272–22284.
- Ouyang Q, Xu L, Cui H, et al. MicroRNAs and cell cycle of malignant glioma. Int J Neurosci. 2016;126(1):1–9.
- Li N, Shi H, Zhang L, et al. miR-188 inhibits glioma cell proliferation and cell cycle progression through targeting β-catenin. Oncol Res. 2018;26(5):785–794.
- Huang W, Shi Y, Han B, et al. LncRNA GAS5-AS1 inhibits glioma proliferation, migration, and invasion via miR-106b-5p/TUSC2 axis. Hum Cell. 2020;33(2):416–426.
- Se Y, Kim S, Kim J, et al. Underexpression of HOXA11 is associated with treatment resistance and poor prognosis in glioblastoma. Cancer Res Treat. 2017;49(2):387–398.