
ABSTRACT
Increasing evidence has proved that circRNAs might act as potential biomarkers for tumor diagnosis and prognosis. However, the functions and mechanisms of multiple circRNAs in colon cancer remains unclear. Here, we found circPLOD2 was dramatically upregulated in colon cancer tissue and cell lines. In vitro CCK-8, colony formation and transwell assays, and in vivo tumor transplantation assay were performed and explored that circPLOD2 might promote tumor proliferation, migration and invasion in vitro and in vivo. Moreover, based on the analysis of RNA pull-down, RNA immunoprecipitation, luciferase and rescued assays, we confirmed that the interactions between circPLOD2, miR-513a-5p and SIX1. It suggested that circPLOD2 acted as a sponge of miR-513a-5p to regulate the activation of the target gene SIX1. In addition, as a key transcription factor of Warburg effect related genes, SIX1 was proved to enhance the transcriptional expression of LDHA by chromatin immunoprecipitation assay, thereby regulating glycolysis in colon cancer cells. Therefore, we identified that circPLOD2 promoted colon cancer progression through miR-513a-5p/SIX1/LDHA axis, and acted as a new biomarker for colon cancer prognosis and treatment.
Introduction
Colon cancer is one of the most frequent cancer types leading to high mortality in the world [Citation1,Citation2]. Currently, despite new treatment approaches that have been generated to remove the primary tumor and resect the metastatic disease, cure rates remain limited because of the recurrence and chemotherapy resistance [Citation3]. Against these issues, screening researches for early detection or prognosis of colon cancer is still urgent.
Circular RNAs (circRNAs) are a novel type of non-coding RNAs that are generated through back splicing. During this specific splicing event, the downstream splice-doner sites bind with the upstream splice-doner sites [Citation4]. Therefore, circRNAs are highly stable compared to the linear splicing, and resistant to the RNase R digestion. Increasing evidence from high-throughput RNA sequencing identifies that circRNAs exist in multiple cell types, including the tumor cells and the normal tissues [Citation5]. Based on its subcellular location, studies have also proven that circRNAs may function as scaffolds in the formation of protein complexes [Citation6], regulators of their parental genes [Citation7], and play an essential role in controlling alternative splicing and RNA–protein interactions [Citation8,Citation9]. The most common function of circRNAs is that serve as the microRNA (miRNA) sponges since circRNAs generally accumulate in the cytoplasm [Citation10–12]. For tumorigenesis, multiple research groups have investigated that circRNAs participate in several events during tumor progressions, such as cell proliferation, death, invasion and migration [Citation13–15]. For example, Shaw-Jenq et al. reported that circCCDC66 was associated with colorectal cancer migration and proliferation inhibiting miR-33b, miR-93 and miR-185 to regulate the expression of a subset of oncogenes [Citation16]. In addition, in the study of Jingting et al., circPPP1R12A was significantly upregulated in the colon cancer tissues and promoted tumor progression in vitro and in vivo by activating the Hippo-Yap signaling pathway [Citation17]. Moreover, in breast cancer, circRNA-0025202 exhibited low expression levels in the primary and metastatic tumors, which acted as the sponge for miR-182-5p and further activated FOXO3a expression to enhance tamoxifen efficacy [Citation18]. However, the functions and mechanisms of multiple circRNAs in colon cancer remains unclear.
circPLOD2 (circbase ID: hsa_circ_0122319) is produced by back splicing of PLOD2 mRNA, which is located on chromosome 3q24 and has 3118 nucleotides in length. According to the RNA sequence analysis, one group reported that circPLOD2 was overexpressed in the recurrent samples from patients with stage II/III colon cancer, as well as in the colon cancer cell lines (SW620 and HCT116 cells). Knockdown of such circRNA significantly inhibited cell invasion and migration in the HCT-116 cells [Citation19]. However, the function and mechanism of circPLOD2 in colon cancer progression have not been explored. In this study, we confirmed that circPLOD2 was upregulated in colon cancer cells, and associated with the cell proliferation, invasion and migration in vitro and in vivo. Importantly, circPLOD2 regulated tumor progression by acting as a sponge of miR-513a-5p to active SIX1 expression. Moreover, we investigated that SIX1 promoted that the expression of LDHA to further control the Warburg effect in cancer cells. In summary, circPLOD2 serves as an oncogene in colon cancer and maybe a novel biomarker for colon cancer prognosis and diagnosis.
Methods
Patient samples
Ten pairs of colon cancer and adjacent tumor-free tissues were collected from the patients with colon cancer in Xibei Hospital. This study was approved by the Ethics Committee of Xibei Hospital.
Cell culture
Human colon cancer cell lines (SW620, HCT-116, HT-29, LoVo) and normal colon cells (RCM-1) were purchased from the Type Culture Collection of the Chinese Academy of Science (Shanghai, China). The cells were cultured by DMEM medium added 10% fetal bovine serum (FBS) (Gibco, USA) and 1% penicillin-streptomycin. The cells were maintained in an incubator with 5% CO2 at 37°C.
RNA extraction and quantitative real-time PCR (qRT-PCR)
Total RNA of cells and tissues was isolated using TRIzol (Thermo, USA) following the manufacturer’s instructions. According to the manufacturer’s protocol of PARIS™ Kit (Thermo, USA), the Nuclear and cytoplasmic RNA fractionation from SW620 and HCT-116 cells were extracted. For RNase R treatment, 10 μg of total RNA from these cells were incubated with RNase R (40 U, Epicenter Technologies, USA) for 10 min at 37°C.
The RNA samples were reversely transcribed into cDNA by PrimeScript™ RT Master Mix reagent kit (TaKaRa, Japan). The PrimeScript™ RT reagent kit (TaKaRa, Japan) was used to transcribe miRNAs. The expression of circRNA, miRNA and gene were detected using qRT-PCR platform with SYBR Premix Ex Taq™ (TaKaRa, Japan). GAPDH and U6 was used as the internal controls. The 2-ΔΔCt method was used to validate these data. The primers were presented as follow: miR-136 (human): forward 5’-CATCATCGTCTCAAATGAGTCT-3’, reverse 5’-GTAGTAGCAGAGTTTACTCAGA-3’; miR-139-5p (human): forward 5’-TCTACAGTGCACGTGTCTCCAGT −3’, reverse 5’-AGATGTCACGTGCACAGAGGTCA-3’; miR-144 (human): forward 5’-GGATATCATCATATACTGTAAG-3’, reverse 5’-CCTATAGTAGTATATGACATTC-3’; miR-197 (human): forward 5’-TTCACCACCTTCTCCACCCAGC-3’, reverse 5’-AAGTGGTGGAAGAGGTGGGTCG-3’; miR-203 (human): forward 5’-AGTGGTTCTTAACAGTTCAACAGTT-3’, reverse 5’-TCACCAAGAATTGTCAAGTTGTCAA-3’; miR-217 (human): forward 5’-TACTGCATCAGGAACTGATTGGA-3’, reverse 5’-ATGACGTAGTCCTTGACTAACCT-3’; miR-383 (human): forward 5’-AGATCAGAAGGTGATTGTGGCT-3’, reverse 5’-TCTAGTCTTCCACTAACACCGA-3’; miR-549 (human): forward 5’-AGCTCATCCATAGTTGTCACTG-3’, reverse 5’-TCGAGTAGGTATCAACAGTGAC-3’; miR-942 (human): forward 5’-TCTTCTCTGTTTTGGCCATGTG-3’, reverse 5’-AGAAGAGACAAAACCGGTACAC-3’; miR-647 (human): forward 5’-GTGGCTGCACTCACTTCCTTC-3’, reverse 5’-CACCGACGTGAGTGAAGGAAG-3’; miR-513a-5p (human): forward 5’-TTCACAGGGAGGTGTCAT-3’, reverse 5’-AAGTGTCCCTCCACAGTA-3’; SIX1 (human): forward 5’-GACTCCGGTTTTCGCCTTTG-3’, reverse 5’-GAAAGGACGGCTTCCTAGGGT-3’; circPLOD2 (human): forward 5’-ggattccacgatttatgcag-3’, reverse 5’-ggattccatcgatttatgcag-3’; PLOD2 (human): forward 5’-catggacacaggataatggctg-3’, reverse 5’-aggggttggttgctcaataaaaa-3’; GAPDH (human): forward 5’-GCAACTAGGATGGTGTGGCT-3’, reverse 5’-TCCCATTCCCCAGCTCTCATA-3’; U6 (human): forward 5’-GAAGCGCGGCCACGAG-3’, reverse 5’-AGTGCAGGGTCCGAGGTATT-3’.
Transfection, oligonucleotides and plasmids
The downregulation plasmids of circPLOD2 (sh-circ#1, sh-circ#2) and control (sh-nc), the mimic, inhibitor and negative control (mimic-NC, inhibitor-NC), the overexpression and downregulation plasmids of SIX1 (SIX1-OE, SIX1-KD), as well as the negative control (vector), were constructed by RiboBio (Guangzhou, China). These oligonucleotides and plasmids were incubated with cells (105) supplementary with 50 nM Lipofectamine™ 2000 (Invitrogen, USA) following the manufacturer’s protocol.
CCK-8 assay and colony formation assay
After transfection, cells were seeded onto the 96-well plates (5000 cells/well). The cell viability was detected using the CCK-8 kit (Dojindo, Japan) at different time points according to the manufacturer’s protocol. The optical density value was measured by a microplate reader at 450 nm.
For the colony formation assays, 1000 cells were plated into 6-well plates and maintained for 7 days. The colonies were fixed by methanol, stained with hematoxylin and observed using the light microscope.
Transwell assay
After different transfection, cells (104 per well) were seeded onto the upper chamber of the transwell system (8.0 um, Corning, USA) with or with Matrigel (Corning, USA). The culture medium with 10% FBS was added to the bottom chamber. After 24 h, the membrane was fixed by 4% polymethanol for 30 min, and then strained using 0.1% crystal violet for another 20 min. Finally, the number of colonies was measured under a light microscope.
RNA pull-down assay
The circPLOD2 hybridized probe and control oligo probe were generated using Biotin RNA Labeling Mix (Roche, USA). The purified probes were then hybridized with streptavidin-coated magnetic beads (Sigma, USA) at 25°C for 2 h. After that, probes-coated beads were incubated with cell lysis for 24 h at 4°C. The bound miRNAs were extracted for qRT-PCR assay.
RNA immunoprecipitation (RIP) assay
According to the manufacturer’s protocol, the EZ-Magna RIP kit (Sigma, USA) was used to conduct the RIP assay. The cell lysis was incubated with human negative IgG or anti-AGO2 antibody (Sigma, USA) overnight. Subsequently, the bound RNA was extracted for qRT-PCR analysis or agarose gel electrophoresis.
Luciferase assay
The wildtype (WT) and mutant (MUT) of circPLOD2 sequence or 3’-UTR of SIX1 were cloned into the pGL3-Firefly-Renilla vector (Ribobio, China). These plasmids were co-transfected into HEK293 cells (106 cells per well) with miR-513a-5p mimic, inhibitor or related controls (mimic-NC, inhibitor-NC) using Lipofectamine 2000 reagent. After 48 h, the luciferase activity was measured and normalized with Renilla luciferase activity.
In situ hybridization (FISH)
The Cy3-labeled circPLOD2 or Dig-labeled miR-513a-5p probes were purchased from RiboBio (Guangzhou, China) and measured by the FISH kit (RiboBio, China). The nuclei were dyed with 4,6-diamidino-2-phenylindole (DAPI, Beyotime, China). Afterward, the images were observed under the fluorescence microscope.
Target prediction
The potential target genes of miR-513a-5p were predicted by miRDB (http://mirdb.org/), miRWalk (http://mirwalk.umm.uni-heidelberg.de/) and Targetscan (http://www.targetscan.org). The criteria of overlapped genes were: 1) score in miRDB > 70; 2) score in miRWalk > 0.9; 3) Cumulative weighted context score > −0.04.
Protein extraction and western blotting
The cells or tissues were homogenized using radioimmunoprecipitation assay buffer. Equal total protein (20 µg of each sample) was loaded onto the SDS-polyacrylamide gel electrophoresis (Bio-Rad, USA). After transferred onto the polyvinylidene fluoride membrane (Millipore, USA), the membrane was then blocked with 5% BSA for 2 h at room temperature, followed by incubation with primary antibodies against SIX1 (1:1000, Abcam, USA), PKM2 (1:1000, Abcam, USA), GLUT1 (1:1000, Abcam, USA), LDHA (1:1000, Abcam, USA) and beta-actin (1:5000, Abcam, USA) at 4°C overnight. After incubation with secondary antibody (1:5000, Abcam, USA) at room temperature for 2 h, the bands were enhanced using ECL chemiluminescent reagent (Thermo, USA) and analyzed by the Image J software.
Glucose Uptake, Pyruvate, Lactate and ATP Assays
The Glucose Uptake Assay Kit, Pyruvate Assay kit, Lactate Assay Kit II, ATP Colorimetric Assay Kit (Jiancheng, China) were performed to detected glucose uptake, pyruvate level, lactate production, and ATP production in the cells with different transfection according to the manufacturer’s protocols. All data were detected by a microplate reader and normalized to cell number.
Chromatin immunoprecipitation (ChIP) assay
The ChIP assay was performed using the EZ-CHIP Kit (Millipore, USA) following the manufacturer’s protocols. In brief, the cells were treated with 1% formaldehyde for 15 min and sonicated with 0.125 M glycine, followed by incubation with SIX1 or IgG antibodies. Finally, the bound DNA fragments were isolated, purified, and analyzed by qRT-PCR analysis or agarose gel electrophoresis.
Animal experiments
Male BALB/c athymic nude mice were purchased from the Animal Center of Nanjing University (Nanjing, China) and housed in the condition with controlled temperature and humidity. The animals were provided with food and water ad libitum. After different transfection, 107 HCT-116 cells were resuspended and subcutaneously injected into mice (four groups, 3 mice per group). The volume of the tumor was measured every week following the formula (tumor = (length×width2)/2). Four weeks after transplantation, the mice were sacrificed and the tumor was removed and weighted. The tumor was then fixed and embedded by paraffin. All animal studies were approved by the Ethics Committee of Xibei Hospital.
H&E staining and immunohistochemical analysis (IHC)
The embedded tissues were cut into 5 μm thick sections. For H&E staining, the sections were dyed with hematoxylin and eosin solution (Beyotime, China) according to the manufacturer’s instructions. For the IHC assay, the sections were dewaxed, rinsing and incubated with primary antibody against Ki-67 (1:300, Abcam, USA) at 4°C for 12 h. Then, the sections were stained with secondary antibody at room temperature for 30 min, followed by developing using DAB. Hematoxylin solution was performed to dye the nuclei. Finally, the sections were observed under light microscopy.
Statistical analysis
The data were analyzed using SPSS 22.0 software and represented as the mean ± SD for three experiments independently. The statistical significance was measured by a two-tailed Student t-test. The survival curves were analyzed using the Kaplan-Meier method. P < 0.05 was considered statistically significant.
Results
circPLOD2 is increased in colon cancer and associated with the poor prognosis
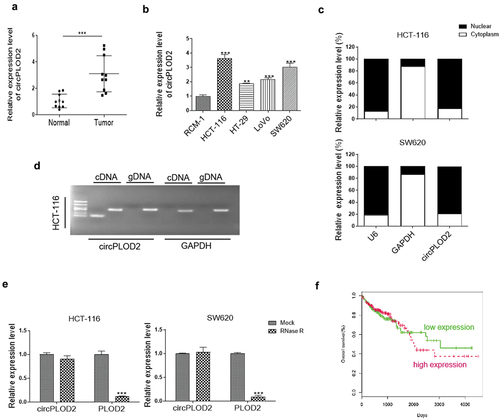
The expression levels of circPLOD2 in the normal colon tissues and cancer samples (n = 10) were first detected by qRT-PCR. It was about 2-fold higher in the tumor samples as compared with that in the normal ones (). We then observed the expression levels of circPLOD2 in colon cancer cell lines, including HCT-116, HT-29, LoVo and SW620 cells, were both increased compared with the normal colon cell line (RCM-1). The HCT-116 and SW620 cells showed a higher level of such circRNA than other cancer cells (). Besides, we checked the subcellular localization of circPLOD2 in HCT-116 cells and SW620 cells. The results illustrated that circPLOD2 was enriched in the cytoplasm in these cells (). To validate whether the head-to-tail splicing of circPLOD2 derived from the trans-splicing or genomic rearrangements, we isolated cDNA and gDNA from HCT-116 cells. The result of gel electrophoresis demonstrated that circPLOD2 was only identified in the cDNA rather than the gDNA, which suggested that the loop structure of circPLOD2 resulted from reverse splicing (). Moreover, following the RNase R treatment, the expression levels of linear PLOD2 mRNA were significantly down-regulated, while that of circPLOD2 were not changed under the same condition, indicating that circPLOD2 was highly stable (). Further, as shown in , the patients with a high level of circPLOD2 expression showed markedly shorter overall survival rate than those with the low level of this circRNA, which suggesting that circPLOD2 increase might be a key event during colon cancer progression and act as an essential factor for colon cancer diagnosis.
Figure 1. CircPLOD2 was increased and associated with the poor prognosis of colon cancer. (A) qRT-PCR analysis of circPLOD2 between colon cancer and related normal colon tissues (n = 10 per group). ***p < 0.001 vs. the tumor group. (B) Relative expression of circPLOD2 in colon cancer and normal colon cell lines. **p < 0.01, ***p < 0.001 vs. the RCM-1 group. (C) The expression level of circPLOD2, U6 and GAPDH located in the cytoplasm and nuclear of HCT-116 and SW620 cells were determined by nuclear-cytoplasmic fractionation assay. (D) Representative image of the gel electrophoresis was performed for the existence of circPLOD2 in HCT-116 cells. GAPDH was used as the linear control. (E) Relative expression of linear PLOD2 and circPLOD2 in HCT-116 and SW620 cells with or without RNase R treatment was measured by qRT-PCR. (F) The overall survival rate of the patients with high or low circPLOD2 expression was analyzed using the Kaplan-Meier method. N = 3, all data were represented as mean ± SD.
circPLOD2 promotes migration and invasion of colon cancer cells
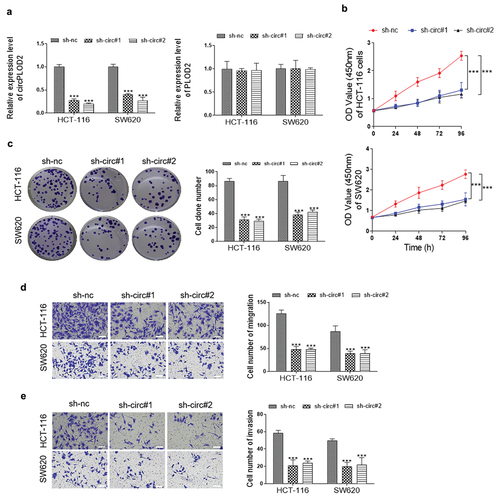
Changes of circPLOD2 and mRNA PLOD2 in colon cancer cells (HCT-116 and SW620) transfected with two sh-RNAs against circPLOD2 (sh-circ#1 and sh-circ#2) or control sh-RNA (sh-nc) were determined using qRT-PCR analysis. The results showed that following the sh-circ#1 or sh-circ#2 transfection, the expression levels of circPLOD2 were significantly reduced, while that of linear PLOD2 mRNA were not regulated (). Consistently, the cell viability of HCT-116 and SW620 was dramatically decreased by the down-regulation of circPLOD2 (). A similar effect was also confirmed by the colony formation assay (). Besides, we observed that inhibition of circPLOD2 significantly suppressed the migration and invasion ability of these tumor cells ( d and e). These results indicated that circPLOD2 promoted the progression of colon cancer in vitro.
Figure 2. Downregulation of circPLOD2 inhibited proliferation, migration and invasion of colon cancer cells in vitro. (A) Transfection efficiency of two downregulation plasmids of circPLOD2 (sh-circ#1 and sh-circ#2) in HCT-116 and SW620 cells. (B and C) The cell viability and colony formation ability of HCT-116 and SW620 after different transfection were detected by CCK-8 assay and colony formation assay. (D and E) The cell migration and invasion were determined by transwell assays after knockdown of circPLOD2 in colon cancer cells. N = 3, all data were represented as mean ± SD. ***p < 0.001 vs. the control group (sh-nc).
circPLOD2 serves as a sponge of miR-513a-5p
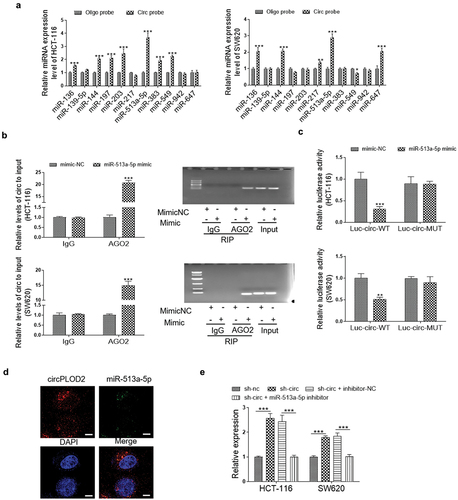
To determine whether circPLOD2 can act as a sponge of miRNAs in the cytoplasm of these cancer cells, we selected the top eleven miRNAs, including miR-136, miR-139-5p, miR-144, miR-197, miR-203, miR-217, miR-513a-5p, miR-383, miR-549, miR-942 and miR-647 by the binding score from the circlnteractome database (https://circinteractome.nia.nih.gov/). The biotinylated circRNA probe was then used to confirm which miRNA could interact with circPLOD2. As shown in , 7 miRNAs in HCT-116 cells and 5 miRNAs in SW620 cells were enriched. Among them, miR-513a-5p was the highest one miRNA that was pulled down by circPLOD2 in both cells. Furthermore, the data of RNA immunoprecipitation analysis showed that miR-513a-5p and circPLOD2 were both upregulated in AgO2-immunoprecipitation as compared to that of the IgG group in both HCT-116 and SW620 cells (). Next, we performed luciferase reporter assays and found that upregulation of miR-513a-5p declined the luciferase activity of wildtype circPLOD2 rather than the mutant ones in these cells (). Similarly, as analysis by FISH, a clear co-location between circPLOD2 and miR-513a-5p was observed in the cytoplasm of HCT-116 cells (). In addition, as shown in , down-regulation of circPLOD2 significantly elevated the expression level of miR-513a-5p, while this effect was reversed when the cells were co-treated by sh-circ and miR-513a-5p inhibitor.
Figure 3. CircPLOD2 interacted with and negatively regulated miR-513a-5p. (A) The expression level of the top eleven miRNAs targeted circPLOD2 were assessed by qRT-PCR. **p < 0.01, ***p < 0.001 vs. the oligo probe group. (B) The HCT-116 and SW620 cells were transfected with miR-513a-5p mimic and related control (mimic-NC) for 48 h. Immunoprecipitated RNA was isolated, and the levels of circPLOD2 were measured by qRT-PCR and gel electrophoresis. (C) Luciferase activities were determined in these colon cancer cells co-transfected with luciferase reporter containing wildtype or mutant circPLOD2 sequence, and miR-513a-5p mimic or mimic-NC. Luciferase activity was normalized by renilla luciferase. (D) The subcellular localization of circPLOD2 and miR-513a-5p was detected by the FISH assay. (E) Real-time PCR analysis of miR-513a-5p expression in circPLOD2-depleted HCT-116 and SW620 cells with or without miR-513a-5p inhibitor treatment. N = 3, all data were represented as mean ± SD. **p < 0.05, ***p < 0.001 vs. the mimic-NC group.
To further confirm the function of circPLOD2/miR-513a-5p in colon cancer cells, the proliferation, migration and invasion of circPLOD2-depleted cancer cells were determined with or without miR-513a-5p transfection. Our result showed that silencing of miR-513a-5p by miRNA inhibitor dramatically re-promoted HCT-116 and SW620 cells proliferation, migration and invasion that were inhibited after sh-circPLOD2 treatment (Supplementary Fig.1).
miR-513a-5p regulates colon cancer progression through inhibiting SIX1 expression
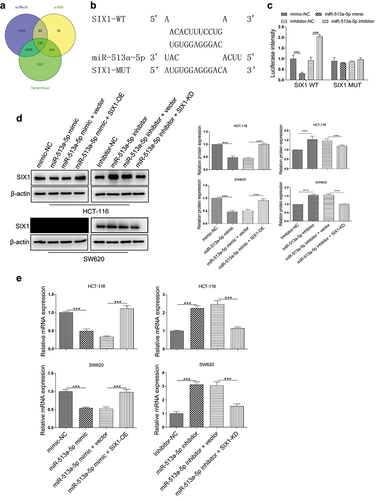
To date, abundant evidence suggested that the typical function of miRNAs was inhibited one or several target genes via binding to the 3ʹUTR of genes. Thus, in this study, TargetScan, miRDB and miRWalk databases were used to predict the potential targets of miR-513a-5p. As shown in , 9411, 650, and 3424 potential target genes, were predicted by the miRWalk database, miRDB database, and TargetScan databases. Moreover, 343 genes to be the overlapping ones among these databases. Among them, SIX1, which was one of the highest-degree targets, was selected for further study first. Then, the luciferase report vector containing the binding sites of SIX1 3ʹUTR and miR-513a-5p was cloned (). Co-transfection with miR-513a-5p mimic led to a significant reduction in luciferase activity in HEK293T cells with SIX1-WT vector transfection. Conversely, miR-513a-5p inhibitor treatment increased the luciferase activity of wild-type ACSL4 plasmid, but not the mutant one (). Consistently, we determined that overexpression miR-513a-5p expression significantly inhibited the protein and mRNA expression levels of SIX1, while the silencing of this miRNA exhibited a dramatic upregulation in the protein and mRNA levels of SIX1. These effects were abolished when co-transfected with miR-513a-5p mimic and SIX1-OE vector, or miR-513a-5p inhibitor and SIX1-KD vector ( d and e). Besides, we also verified that miR-513a-5p enriched cells presented lower proliferation ability than the control group, while combine transfected with the SIX1 overexpression vector, this effect was markedly reversed in these cells. Similar results were also observed on the ability of colony formation, migration and invasion (Supplementary Fig.2). Hence, we confirmed that miR-513a-5p affects colon cancer progression via directly targeting SIX1.
Figure 4. SIX1 was a target gene of miR-513a-5p. (A) The target genes of miR-513a-5p were predicted by miRDB, miRWalk and Targetscan databases. (B) Predicted binding sites for miR-513a-5p on the SIX1 transcript. (C) Luciferase activities were determined in HEK293T cells co-transfected with luciferase reporter containing 3’-UTR of wildtype or mutant SIX1, and miR-513a-5p mimic or inhibitor. Luciferase activity was normalized by renilla luciferase. (D and E) The effect of miR-513a-5p on the expression of SIX1 at mRNA and protein levels were detected by western blot and qRT-PCR. N = 3, all data were represented as mean ± SD. ***p < 0.001.
SIX1 promotes the progression of colon cancer by regulating the LDHA-induced Warburg effect
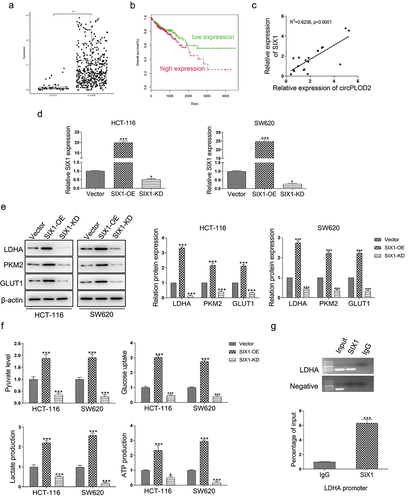
Although SIX1 acts as an oncogene that is upregulated in several types of cancer, its expression in colon cancer remains unclear. Here, we sought to determine the expression of SIX1 in colon cancer tissues and normal colon tissues by TCGA analysis. As shown in , a higher level of SIX1 was investigated in the tumor samples as compared with the normal ones. Moreover, the patients with high SIX1 expression presented a poorer survival rate than those with the low level (). In addition, in our colon cancer samples, we found that circPLOD2 expression was positively correlated with the expression of SIX1 (p < 0.001) (). To further explore SIX1 downstream factors, we first transferred the HCT-116 and SW620 cells with the SIX1-overexpression vector or SIX1-knockdown vector. We assessed that significantly increased SIX1 in these cells after overexpression of SIX1, while about 50% reduction was verified in cells when silencing SIX1 expression (). Some known SIX1 target genes which were associated with Warburg effect were validated using western blot. The results showed that SIX-OE displayed about 3-fold upregulations of LDHA in these cells, and around a 2-fold increase of other genes, such as GLUT1 and PKM2, but SIX1-KD significantly decreased the expression of these genes (). Since the SIX1 regulates glycolytic gene expression, we tested whether SIX1 regulated the glycolytic phenotype in these cells. As shown in , overexpression of SIX1 increased glucose uptake, pyruvate level, lactate production, and ATP level in these cells. However, silencing of SIX1 displayed a dramatic decrease of such events in HCT-116 and SW620 cells. To further explore the effect of SIX1 on the expression of LDHA, a Ch-IP assay was performed. The results demonstrated that SIX1 was recruited to the binding sites in the LDHA promoter (). Thus, we confirmed that SIX1 might regulate the Warburg effect via enhancing LDHA expression.
Figure 5. SIX1 was upregulated in colon cancer and correlated with the LDHA-induced Warburg effect. (A) The expression level of SIX1 in colon cancer tissues (n = 456) and normal colon tissues (n = 41) was detected by TCGA analysis. ***p < 0.001 vs. the normal group. (B) The overall survival rate of patients with high or low SIX1 expression was analyzed using the Kaplan-Meier method. (C) The level of SIX1 positively correlated with the level of circPLOD2 in colon cancer tissues by Pearson correlation analysis. (D) Transfection efficiency of overexpression or downregulation vector of SIX1 (SIX1-OE and SIX-KD) in HCT-116 and SW620 cells. (E) The effect of SIX1 on the protein expression of LDHA, PKM2 and GLUT1 in these colon cancer cells was performed by western blot. (F) The pyruvate level, glucose uptake, lactate production and ATP production in HCT-116 and SW620 cells with SIX-OE or SIX-KD vector transfection. *p < 0.05, ***p < 0.001 vs. the vector group. (G) The effect of SIX1 on the transcriptional expression of LDHA was assessed by the ChIP assay. N = 3, all data were represented as mean ± SD.
CircPLOD2 regulates the Warburg effect through the miR-513a-5p/SIX1 axis in vitro
To investigate whether circPLOD2 displayed its function by miR-513a-5p/SIX1 axis, the rescued experiments were performed with inhibition of miR-513a-5p in circPLOD2-depleted cells. The results showed that circPLOD2 depletion markedly reduced the expression of SIX1 at both protein and mRNA levels. But the silencing of miR-513a-5p reversed the effect of circPLOD2 in these cells ( a and b). Moreover, glycolysis assay was also detected under such conditions. The results showed that downregulation of miR-513a-5p attenuated the function of circPLOD2 to enhance glucose uptake, pyruvate level, lactate production, and ATP level in HCT-116 and SW620 ().
Figure 6. CircPLOD2 regulated the SIX1-mediated Warburg effect in colon cancer through miR-513a-5p. (A) Representative blots and analyses for SIX1 in circPLOD2-depleted HCT-116 and SW620 cells with or without miR-513a-5p inhibitor treatment. (B) Relative expression of SIX1 in circPLOD2-depleted HCT-116 and SW620 cells with or without miR-513a-5p inhibitor treatment was measured by qRT-PCR. (C) The pyruvate level, glucose uptake, lactate production and ATP production in HCT-116 and SW620 cells with different transfection. N = 3, all data were represented as mean ± SD. ***p < 0.001.
CircPLOD2 promoted the proliferation of colon cancer cells in vivo
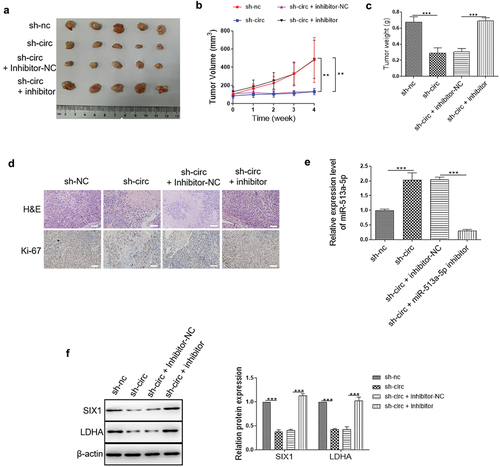
To detect the functions of circPLOD2/miR-513a-5p in vivo, the stable HCT-116 cells with sh-circPLOD2 and miR-513a-5p inhibitor transfection were generated, and transplanted by subcutaneously injection. After 4 weeks, the tumor samples were collected. The volume and weight of tumors with sh-circPLOD2 transfection or co-transfection with inhibitor-NC was dramatically lower than the control group (sh-NC). However, compared with the sh-circPLOD2+ inhibitor-NC group, co-transfection of sh-circPLOD2 and inhibitor significantly increased the volume and weight of tumors ( a–). Besides, IHC staining investigated mice with sh-circPLOD2 and inhibitor presented more positive Ki-67 signals, the marker of cell proliferation, than the control group (). Moreover, we observed that the expression of miR-513a-5p in mice bearing circPLOD2-depleted cells was higher than in mice bearing cells with sh-NC, whereas this level was shapely reduced in mice bearing circPLOD2-depleted cells with miR-513a-5p inhibitor (). The results of western blot revealed that the protein level of SIX1 and LDHA were decreased in mice bearing circPLOD2-depleted cells, while this function of circPLOD2 was reversed when co-transfected with miR-513a-5p inhibitor (). Accordingly, we considered that circPLOD2 enhanced tumorigenicity of colon cancer in vivo through regulating the miR-513a-5p/SIX1/LDHA axis.
Figure 7. CircPLOD2 promoted tumor progression through the miR-513a-5p/SIX1 axis in vivo. (A) Representative images of tumors of HCT-116 cells with different transfection. (B and C) The tumor volume and weight were measured. (D) Representative images of H&E staining and IHC assay for Ki-67 expression in the tumor tissues. (E) The expression level of miR-513a-5p in tumor tissues was detected by qRT-PCR. (F) Representative blots and analyses for SIX1 and LDHA in circPLOD2-depleted tumor samples with or without miR-513a-5p inhibitor transfection. N = 3, all data were represented as mean ± SD. **p < 0.01, ***p < 0.001 vs. the sh-nc group.
Discussion
Increasing researches have proved that circRNAs could act as potential biomarkers for disease diagnosis and prognosis, and have a crucial role in the initiation and development of cancer. However, few circRNAs have been well identified in colon cancer. In this study, we found circPLOD2 was dramatically upregulated in colon cancer tissues and cells. Since proliferation and metastasis are the most important events to cancer development, resulting in high mortality of patients with colon cancer. Hence, it is urgent to investigate the function of such circRNAs in colon cancer. With the gain-or-loss experiments, we found down-regulation of circPLOD2 inhibited proliferation, invasion and migration of colon cancer cells in vitro and in vivo. Moreover, because of the stable loop structure and resistance to the RNase R degradation, circPLOD2 might be an effective and functional marker for colon cancer diagnosis and treatment.
Nowadays, abundant studies have been demonstrated that circRNAs exerted multiple functions through serving as the sponge of miRNAs. In this study, we investigated that circPLOD2 was accumulated in the cytoplasm and interacted with several miRNAs. Among them, miR-513a-5p was the top one in both colon cancer cells. Based on the RIP, FISH and luciferase reporter assay, we identified that circPLOD2 could target miR-513a-5p. downregulation of circPLOD2 could increase the miR-513a-5p expression in colon cancer cells. The miR-513a-5p served as a tumor suppressor in multiple cancer. For example, Dong et al. reported that miR-513a-5p expression was decreased in osteosarcoma tissues or cells. Overexpression of such miRNA enhanced the radiosensitivity of osteosarcoma [Citation20]. Another group demonstrated that silencing of miR-513a-5p might promote gastric cancer cell proliferation and migration through activating APE1 expression [Citation21]. In this work, we validated that inhibition of miR-513a-5p could significantly reverse the antitumor effect on colon cancer induced by circPLOD2 knockdown. Accordingly, these data revealed that circPLOD2 was upregulated, and then suppressed the expression of miR-513a-5p, thereby promoted tumor progression.
In addition, according to the bioinformatics analysis, the high-grade overlapping target genes that binding with miR-513a-5p were predicted. Among them, SIX1 was selected and confirmed as a potential target of miR-513a-5p by luciferase assay. Besides, overexpression of miR-513a-5p markedly reduced the expression of SIX1, while the downregulation of miR-513a-5p markedly increased its expression level. Restoring SIX1 expression reversed the proliferation, invasion and migration suppression induced by miR-513a-5p overexpression. Together, we suggested that miR-513a-5p could inhibit tumor cell progression through directly binding to SIX1.
SIX1 is overexpressed in multiple types of cancer and is related to poor clinical outcomes. Our work also confirmed that SIX1 expression was significantly increased in the colon cancer tissues and cells, and positively correlated with the expression level of circPLOD2. Up to now, many key glycolytic genes that are related to the Warburg effect, including HK2, PKM2 and LDHA, have been reported to mediate by SIX1 [Citation22,Citation23]. As a hallmark of cancer, the Warburg effect regulates the pro-oncogenic metabolism pattern that cancer cells consume more glucose than the normal cells, and prefer to incomplete oxidation of glucose in an oxygen-independent manner [Citation24,Citation25]. LDHA, a step-limiting enzyme in the glycolysis pathway, is essential for the progression of several cancer [Citation26]. Downregulation of LDHA caused a reduction in cell migration and invasion through inhibiting MMP-2 activation [Citation27,Citation28]. In the present study, we found that SIX1 directly banded with LDHA promoter, and thus controlled the transcription of LDHA in colon cancer cells. Moreover, downregulation of miR-513a-5p attenuated the function of circPLOD2 to enhance glucose uptake, pyruvate level, lactate production, and ATP level in HCT-116 and SW620 cells. Therefore, circPLOD2 regulated LDHA by the miR-513a-5p/SIX1 axis.
In summary, we explored that a novel circRNA PLOD2 was enriched in colon cancer and associated with tumor progression and poor outcomes. Moreover, we investigated that circPLOD2 initiated cell migration and invasion in vitro and in vivo through miR-513a-5p/SIX1 axis. In addition, upregulated circPLOD2 controlled the Warburg effect in colon cancer by activating the LDHA expression. Our findings firstly identified the functional role and mechanism of circPLOD2, which provided a novel approach for colon cancer prognosis and treatment.
Supplemental Material
Download Zip (5.4 MB)Disclosure statement
No potential conflict of interest was reported by the author(s).
Supplementary material
Supplemental data for this article can be accessed online at https://doi.org/10.1080/15384101.2022.2103339.
Additional information
Funding
References
- Kuipers EJ, Rosch T, Bretthauer M. Colorectal cancer screening–optimizing current strategies and new directions. Nat Rev Clin Oncol. 2013;10:130–142.
- Capelle LG, Van Grieken NC, Lingsma HF, et al. Risk and epidemiological time trends of gastric cancer in Lynch syndrome carriers in the Netherlands. Gastroenterology. 2010;138:487–492.
- Kuipers EJ, Grady WM, Lieberman D, et al. Colorectal cancer. Nat Rev Dis Primers. 2015;1:15065.
- Sanger HL, Klotz G, Riesner D, et al. Viroids are single-stranded covalently closed circular RNA molecules existing as highly base-paired rod-like structures. Proc Natl Acad Sci U S A. 1976;73:3852–3856.
- Kristensen LS, Andersen MS, Stagsted LVW, et al. The biogenesis, biology and characterization of circular RNAs. Nat Rev Genet. 2019;20:675–691.
- Du WW, Fang L, Yang W, et al. Induction of tumor apoptosis through a circular RNA enhancing Foxo3 activity. Cell Death Differ. 2017;24:357–370.
- Li Z, Huang C, Bao C, et al. Exon-intron circular RNAs regulate transcription in the nucleus. Nat Struct Mol Biol. 2015;22:256–264.
- Ashwal-Fluss R, Meyer M, Pamudurti NR, et al. circRNA biogenesis competes with pre-mRNA splicing. Mol Cell. 2014;56:55–66.
- Du WW, Yang W, Liu E, et al. Foxo3 circular RNA retards cell cycle progression via forming ternary complexes with p21 and CDK2. Nucleic Acids Res. 2016;44:2846–2858.
- Memczak S, Jens M, Elefsinioti A, et al. Circular RNAs are a large class of animal RNAs with regulatory potency. Nature. 2013;495:333–338.
- Hansen TB, Jensen TI, Clausen BH, et al. Natural RNA circles function as efficient microRNA sponges. Nature. 2013;495:384–388.
- Zheng Q, Bao C, Guo W, et al. Circular RNA profiling reveals an abundant circHIPK3 that regulates cell growth by sponging multiple miRNAs. Nat Commun. 2016;7:11215.
- Sun H, Xi P, Sun Z, et al. Circ-SFMBT2 promotes the proliferation of gastric cancer cells through sponging miR-182-5p to enhance CREB1 expression. Cancer Manag Res. 2018;10:5725–5734.
- Li XN, Wang ZJ, Ye CX, et al. RNA sequencing reveals the expression profiles of circRNA and indicates that circDDX17 acts as a tumor suppressor in colorectal cancer. J Exp Clin Cancer Res. 2018;37:325.
- Zhong Y, Du Y, Yang X, et al. Circular RNAs function as ceRNAs to regulate and control human cancer progression. Mol Cancer. 2018;17:79.
- Hsiao KY, Lin YC, Gupta SK, et al. Noncoding effects of circular RNA CCDC66 promote colon cancer growth and metastasis. Cancer Res. 2017;77:2339–2350.
- Zheng X, Chen L, Zhou Y, et al. A novel protein encoded by a circular RNA circPPP1R12A promotes tumor pathogenesis and metastasis of colon cancer via Hippo-YAP signaling. Mol Cancer. 2019;18:47.
- Sang Y, Chen B, Song X, et al. circRNA_0025202 regulates tamoxifen sensitivity and tumor progression via regulating the miR-182-5p/FOXO3a axis in breast cancer. Mol Ther. 2019;27:1638–1652.
- Ju HQ, Zhao Q, Wang F, et al. A circRNA signature predicts postoperative recurrence in stage II/III colon cancer. EMBO Mol Med. 2019;11:e10168.
- Dai N, Qing Y, Cun Y, et al. miR-513a-5p regulates radiosensitivity of osteosarcoma by targeting human apurinic/apyrimidinic endonuclease. Oncotarget. 2018;9:25414–25426.
- Lu MD, Liu D, Li YX. LINC01436 promotes the progression of gastric cancer via regulating miR-513a-5p/APE1 axis. Onco Targets Ther. 2020;13:10607–10619.
- Liberti MV, Locasale JW. The Warburg effect: how does it benefit cancer cells? Trends Biochem Sci. 2016;41:211–218.
- Yang X, Zhao H, Yang J, et al. MiR-150-5p regulates melanoma proliferation, invasion and metastasis via SIX1-mediated Warburg effect. Biochem Biophys Res Commun. 2019;515:85–91.
- Vander Heiden MG, Cantley LC, Thompson CB. Understanding the Warburg effect: the metabolic requirements of cell proliferation. Science. 2009;324:1029–1033.
- Gatenby RA, Gillies RJ. Why do cancers have high aerobic glycolysis? Nat Rev Cancer. 2004;4:891–899.
- Du P, Liao Y, Zhao H, et al. ANXA2P2/miR-9/LDHA axis regulates Warburg effect and affects glioblastoma proliferation and apoptosis. Cell Signal. 2020;74:109718.
- Baumann F, Leukel P, Doerfelt A, et al. Lactate promotes glioma migration by TGF-beta2-dependent regulation of matrix metalloproteinase-2. Neuro Oncol. 2009;11:368–380.
- Seliger C, Leukel P, Moeckel S, et al. Lactate-modulated induction of THBS-1 activates transforming growth factor (TGF)-beta2 and migration of glioma cells in vitro. PLoS One. 2013;8:e78935.