
ABSTRACT
Previous studies have not completely elucidated the role of the histaminergic system in the pathogenesis of psoriasis. This study aimed to evaluate the effects of adalimumab and cyclosporine A on the expression of histaminergic system-related genes and miRNAs regulating these genes in bacterial lipopolysaccharide A (LPS)-stimulated human keratinocyte (HaCaT) cells. HaCaT cells were treated with 1 µg/mL LPS for 8 h, followed by treatment with 8 µg/mL adalimumab or 100 ng/mL cyclosporine A for 2, 8, or 24 h. Untreated cells served as controls. The cells were subjected to ribonucleic acid (RNA) extraction and microarray, quantitative real-time polymerase chain reaction, and enzyme-linked immunosorbent assay analyses. Statistical analysis was performed using the Statistica 13.0 PL (StatSoft, Cracow, Poland) and the Transcriptome Analysis Console programs (Affymetrix, Santa Clara, CA, USA) (p < 0.05). The differential expression of the following two miRNAs was not affected in LPS-stimulated cells upon treatment with cyclosporine A or adalimumab: hsa-miR-583 (downregulated expression), involved in the regulation of histamine receptor 1 – HRH1 (overexpression); has-miR-1275 (downregulated expression), involved in the regulation of histamine receptor 1 – HRH3 (overexpression) and Solute carrier family 22 member 3 – SLC23A2 (downregulated expression)). Adalimumab and cyclosporine A modulated the histaminergic system in HaCaT cells in vitro. However, further studies are needed to elucidate the underlying mechanisms.
Abbreviations: (-) – downregulated in comparison to the control, (+) – overexpression in comparison to the control, ACTB - β-actine, ADA - Adenosine deaminase, ADCYAP1 - Adenylate Cyclase Activating Polypeptide 1, BMP - bone morphogenetic protein, bp - base pair, cAMP - adenosine 3’ 5’-cyclic monophosphate, CBX7 - Chromobox protein homolog 7, cDNA - double-stranded complementary DNA, CSA - cyclosporine A DAG – diacylglycerol, DIAPH - Diaphanous related formin 1, DNMT - DNA methyltransferases, DRD2 - Dopamine receptor D2, EDN1 - Endothelin 1, EDNRA - Endothelin receptor type A, ELISA - Enzyme-linked immunosorbent assay, EZH2 - Enhancer of zeste homolog 2, FC - fold change, GABRB1 - Gamma-aminobutyric acid (GABA) A receptor, alpha 1, GABRB2 - Gamma-aminobutyric acid (GABA) A receptor, alpha 2, GABRB3 - Gamma-aminobutyric acid (GABA) A receptor, alpha 3, HaCaT - Human adult, low-calcium, high-temperature keratinocytes, HIS - Human Histamine, HLAs - human leukocyte antigens, HNMT - Histamine N-methyltransferase, HNMT - Histamine N-Methyltransferase, HRH1 – histamine receptor 1, HRH2 – histamine receptor 2, HRH3 – histamine receptor 3, HRH4 – histamine receptor 4, HTR6 - 5-Hydroxytryptamine Receptor 6, IGF1 - Insulin-like growth factor 1, IL10 -interleukin 10, IL12 -interleukin 12, IL6 - interleukin 6, IP3 - inositol 1,4,5-triphosphate, LPS - bacterial lipopolysaccharide A, LYN - LYN Proto-Oncogene, Src Family Tyrosine Kinase, MAPKs -mitogen-activated protein kinases, miRNA - micro RNA, MMP2 - matrix metalloproteinase-2, NHDF – Normal Human Dermal Fibroblasts, NHEK - Normal Human Epidermal Keratinocytes, OCT3 - organic cation transporter 3, PANTHER - Protein ANalysis THrough Evolutionary Relationships Classification, PBS - phosphate-buffered saline, PI3K-AKT - phosphatidylinositol 3-kinase-protein kinase B, PIP2 - phosphatidylinositol 4,5 bisphosphate, PMSF - phenylmethylsulfonyl fluoride, PSORS1- psoriasis susceptibility gene 1, qRT-PCR - quantitative Reverse Transcription Polymerase Chain Reaction, RNA - ribonucleic acid, RNAi - RNA interference, RTqPCR - Real-Time Quantitative Reverse Transcription Reaction, SLC223A2 - Solute carrier family 22 member 3, SNX -Sorting nexin, SOX9 - SRY-Box Transcription Factor 9, TGF-α - transforming growth factor α, TGF-β - transforming growth factor beta, TNF-α - tumor necrosis factor alpha, TP53 - tumor protein 5 z, VAMP2 - Vesicle associated membrane protein 2.
Introduction
Previous studies have examined the anatomy and functions of the histaminergic system. However, the roles of the histaminergic system in the physiological and pathological processes have not been completely elucidated. Histamine mediates the functions of the histaminergic system through its receptors: histamine receptor 1 (HRH1), histamine receptor 2 (HRH2), histamine receptor 3 (HRH3), and histamine receptor 4 (HRH4). The endogenic amino acid histidine is decarboxylated to histamine. The histamine-mediated activation of histamine receptors stimulates several processes, including proinflammatory responses involved in allergic reactions and the production of prostaglandins, in humans [Citation1,Citation2]. HRH1 is expressed in the smooth muscles, blood vessels, central nervous system, and heart. The activation of HRH1 expression promotes vasodilation and increased vessel wall permeability, smooth muscle contraction, and enhanced mucus secretion. These effects are mediated by activated phospholipase C, which catalyzes the decomposition of phosphatidylinositol 4,5 bisphosphate (PIP2) into inositol 1,4,5-triphosphate (IP3) and diacylglycerol (DAG) that constitute the effector system of HRH1. Consequently, activated HRH1 upregulates the levels of intracellular calcium and nitrogen oxide [Citation3,Citation4]. The histamine-induced stimulation of HRH2, which is expressed in the uterus, stomach, and heart. The functions of HRH2 are dependent on the Gs protein, which stimulates adenylyl cyclase, an enzyme involved in the synthesis of cyclic adenosine monophosphate (cAMP), and upregulates the cellular cAMP levels [Citation3]. HRH3, which also mediates the effects of histamine, is expressed in the central nervous system, respiratory system, and gastrointestinal tract. The stimulation of HRH3 modulates the nerve impulse pathways in the central nervous system. Activated HRH3 upregulates histamine synthesis in the mast cells and concomitantly downregulates the cAMP levels. Furthermore, HRH3 regulates the phospholipase A2-activated kinase and mitogen-activated protein kinase (MAPK) pathways, as well as the cellular calcium concentration [Citation5]. HRH4, which is expressed in the leukocytes, thymus, spleen, and bone marrow, is a component of the histaminergic system that regulates the immune system by downregulating the release of tumor necrosis factor alpha (TNF-α), interleukin 6 (IL6), interleukin 12 (IL12) and promoting interleukin 10 (IL10) synthesis. Additionally, HRH4, which is coupled with the Gi protein, downregulates the levels of adenosine 3’ 5’-cyclic monophosphate (cAMP). The functions of the histaminergic system are independent of external stimuli irrespective of the receptor type that is activated [Citation3,Citation6,Citation7]. Psoriasis is a chronic, multi-factor, inflammatory skin disease with a complex immunopathogenesis. The most common forms of psoriasis are plaque psoriasis, arthropathic psoriasis, and pustular psoriasis. The phenotypic presentations of psoriasis are red lesions on the epidermal surface that are subsequently covered with scales generated from the callused skin. These epidermal changes cause burning and itching. Mechanical scraping or removal of the scales/callused skin is painful, especially during severe stages of the disease, which adversely affects the quality of life of patients with psoriasis. In Europe and the United States, psoriasis affects approximately 1%–4% of the population [Citation1]. The etiological factors, including genetic factors, for psoriasis have not been completely elucidated. However, immune and genetic factors are reported to be involved in the pathogenesis of psoriasis. Individuals aged < 40 years and 50–70 years are highly susceptible to psoriasis [Citation8].
Intrinsic alterations in epidermal keratinocytes may also contribute to the pathogenesis of psoriasis in an autocrine or paracrine manner. Thus, intrinsic alterations in epidermal keratinocytes have challenged the concept of psoriasis being a disease exclusively mediated by T-cell activation. Keratinocytes are a major source of inhibitory cytokines, which maintain the skin in an inflammatory quiescent status in the absence of triggers that activate local dendritic cells [Citation9,Citation10].
However, the imbalance between anti-inflammatory and proinflammatory signals may lead to the development of chronic inflammatory skin diseases, such as psoriasis and atopic dermatitis [Citation11]. Keratinocytes regulate the immune response through the cell surface receptors. Additionally, keratinocytes can function as antigen-presenting cells to initiate or enhance the activity of immune cells by expressing human leukocyte antigens (HLAs). HLA-Cw 0602 is the pathogenic allele in the psoriasis susceptibility gene 1 (PSORS1) locus. Previous studies have reported that keratinocytes can express class I and II HLAs upon stimulation [Citation12]. However, the role of keratinocyte HLAs in the pathogenesis of psoriasis has not been elucidated. During the psoriasis process, keratinocyte growth is promoted through the activation of an autocrine loop involving various growth factors, such as insulin-like growth factor, keratinocyte growth factor, transforming growth factor α (TGF-α), amphiregulin, and members of the inhibitory transforming growth factor beta (TGF-β) family [Citation13,Citation14].
Previously, we had demonstrated the effect of adalimumab and cyclosporine A (CSA) on the transcriptome and proteome of the human adult, low-calcium, high-temperature, keratinocytes (HaCaT) [Citation15–18].
Dermatological research involves the use of cells, such as skin fibroblasts, normal human epidermal keratinocytes (NHEKs), or the HaCaT.
Primary NHEKs, which originate from a single donor and are isolated from the epidermis of the juvenile foreskin, are cryopreserved for further analysis. These cells constitute the majority of the cells in the epidermis, accounting for approximately 90% of the cells. Epidermal keratinocytes originate in the stratum basale and migrate up through the epidermal layers. During this migration, the cells undergo gradual differentiation and morphological changes until they reach the stratum corneum where they form a layer of nucleus-free, flat, and highly keratinized squamous cells. This layer forms an effective barrier to the entry of infectious agents into the body and minimizes moisture loss. Keratinocytes can produce various cytokines, growth factors, interleukins, and complement factors [Citation19,Citation20].
HaCaT cells were originally isolated from primary upper back skin melanoma in a patient aged 62 years and named based on their origin (human, adult, low-calcium, high-temperature, keratinocytes). The conditions for the establishment of the cell line were determined at the German Cancer Research Center in Heidelberg in the late 1980s. This permanent epithelial cell line is classified as non-tumorigenic and exhibits spontaneous phenotypic transformation. The cells exhibit the following characteristics: physiological keratinocyte morphology and epidermal differentiation capacity, non-tumorigenic, and undergo ultraviolet light-induced apoptosis (similar to human keratinocytes). The differentiation rate of HaCaT cells, which is dependent on the calcium concentration, increases with an increase in the calcium content from low to high/physiological levels. High calcium levels promote the differentiation and stratification of keratinocytes. However, low calcium levels promote the formation of an adherent monolayer of proliferating cells. Previous studies have reported that both alleles of tumor protein 53 (TP53) in HaCaT cells harbor typical mutations observed in UV-exposed human epidermis. HaCaT cells are widely used in in vitro and in vivo studies examining the therapeutic potential of dermatological drugs. We had used HaCaT cells in our previous study [Citation21,Citation22].
Adalimumab, an immunosuppressive drug, is a recombinant human monoclonal antibody that neutralizes the membrane and soluble forms of TNF-α. Additionally, adalimumab is used to treat arthropathic psoriasis, rheumatoid arthritis, and Crohn’s disease [Citation23,Citation24]. In addition to biological drugs, conventional therapy is also used to treat psoriasis. For example, CSA, which is a cyclical peptide containing 11 amino acids in its structure, selectively inhibits the immune response by modulating the activation of Th lymphocytes. Thus, CSA indirectly inhibits the production of antibodies and the activation of macrophages. CSA downregulates the expression of ICAM1 in keratinocytes and endothelial cells. Furthermore, CSA downregulates the levels of inflammatory cytokines by modulating dendritic cells and the Th17 lymphocytes [Citation24–26].
Epigenetic factors regulate the expression of genes. RNA interference (RNAi) is an epigenetic mechanism of gene regulation mediated by microRNAs (miRNAs). The size of miRNAs is in the range of 18–24 nucleotides. miRNAs are considered negative post-transcriptional regulators of gene expression. In cases of full complementarity between mRNA and its regulating miRNA, the transcript is completely degraded and the protein is not synthesized, while in cases of partial complementarity, the protein coded by the miRNA-regulated gene is downregulated [Citation27,Citation28].
Cytosine methylation in the CpG dinucleotide site is another epigenetic mechanism involved in regulating gene expression. CpG dinucleotides can be divided into two groups. The first group comprises CpG dinucleotides distributed throughout the genome, while the second group comprises dinucleotides occurring in large groups, which form the CpG islands [Citation29,Citation30]. Currently, a CpG island is defined as a nucleotide sequence that is longer than 200 base pair (bp) with a GC content > 50% and the CpG observed/CpG expected ratio of > 0.6 [Citation31,Citation32]. Deoxyribonucleic acid (DNA) methylation may inhibit the expression of genes directly by inhibiting the binding of transcription factors and RNA polymerase [Citation33] or indirectly by recruiting methyl-CpG binding domain (MBD) proteins [Citation34]. Subsequently, the MBD proteins recruit complexes that modify histones and remodel chromatin, which impairs or inhibits active transcription. The silencing effect of DNA methylation is potentiated by the Polycomb protein family members, such as Enhancer of zeste homolog 2 (EZH2) and Chromobox protein homolog 7 (CBX7), which can interact with DNA methyltransferases (DNMT) [Citation35,Citation36].
This study aimed to evaluate the effect of CSA and adalimumab on the expression profiles of histaminergic system-related mRNAs and miRNAs in lipopolysaccharide A (LPS)-stimulated HaCaT cells.
Materials and methods
HaCaT cell culture
HaCaT cells (CLS Cell Lines Service, Eppelheim, Germany) were cultured in Dulbecco’s modified Eagle’s medium (Sigma-Aldrich, St. Louis, MO, USA) supplemented with 4500 mg/L glucose (Sigma-Aldrich), 10% fetal bovine serum (Sigma-Aldrich), 100 U/mL penicillin (Sigma-Aldrich), 100 mg/mL streptomycin (Sigma-Aldrich), and 2 mM glutamine (Sigma-Aldrich) at 37°C and 5% CO2. Based on our previous studies [Citation15–17], HaCaT cells were incubated with 1 μg/mL LPS for 8 h, followed by incubation with 8 μg/mL adalimumab or 100 ng/mL of CSA for 2 (H_2 group), 8 (H_8 group), or 24 h (H_24 group). HaCaT cells not treated with LPS, adalimumab, or CSA served as controls. The concentrations of the drugs were customized according to those observed in the serum of patients with psoriasis.
The concentrations of the drugs were customized according to those observed in the serum of patients with psoriasis. The quantity of cells and their viability were monitored by cell counting in the Bürker chamber after staining them with 0.2% trypan blue (Biological Industries, Beit HaEmek, Israel).
RNA extraction
Total ribonucleic acid (RNA) was isolated from LPS-stimulated HaCaT cells treated with adalimumab or CSA and control HaCaT cells using TRIzol reagent (Invitrogen Life Technologies, Carlsbad, CA, USA; Catalog number: 15,596,026), following the manufacturer’s instructions. The isolated RNA was purified using the RNeasy mini kit (QIAGEN, Hilden, Germany; Catalog number: 74,104) and DNase I (Fermentas International Inc., Burlington, ON, Canada; Catalog number: 18,047,019). The RNA was qualitatively evaluated using 1% agarose electrophoresis with 0.5 mg/mL ethidium bromide and quantitatively evaluated by measuring the absorbance at 260 nm.
Microarray profile of histaminergic system-related genes
The differential expression of histaminergic system-related genes between LPS-stimulated HaCaT cells treated with adalimumab or CSA and control cells was analyzed using the HG-U 133_A2 microarray (Affymetrix, Santa Clara, CA, USA) and GeneChip™ 3 IVT PLUS reagent kit (Affymetrix; Catalog Number 902,416), following the manufacturer’s instructions and the methods used in our previous study 1, 15,16,17,18].
Of the 22,277 mRNA probes in the microarray plate, 65 were associated with the histaminergic system. The names of the probes were indicated on the Affymetrix NetAffx Analysis Center database after entering the query “histaminergic system” (http://www.affymetrix.com/analysis/index.affx; accessed on 20 November 2020). To perform microarray analysis, double-stranded complementary DNA (cDNA) was synthesized using the GeneChip 30IVT Express kit (at 42°C for 2 h). Next, the sample was incubated with 20 μL of Second Strand master mix for 1 h at 16°C, followed by incubation for 10 min at 65°C. The sample was then incubated with 30 µL of IVTMaster Mix for cDNA for 16 h at 40°C to promote the synthesis of biotinylated aRNAs. Subsequently, the aRNAs were fragmented using a matrix fragmentation buffer for 35 min at 94°C. The mixture was hybridized using the GeneChip hybridization, wash, and stain kit. The fluorescence intensity was examined using an Affymetrix Gene Array Scanner 3000 7 G and Gene Chip® Command Console® Software (Affymetrix).
Microarray profile of histaminergic system-related miRNAs and its potential influence on the expression of analyzed genes
The microarray profile of miRNAs was analyzed using the commercially available GeneChip miRNA 2.0 Array (Affymetrix), following the manufacturer’s instructions. Differentially expressed miRNAs between drug-treated and control HaCaT cells involved in the regulation of differentially expressed mRNAs were determined using Targetscan (http://www.targetscan.org/; accessed on 14th April 2021) [Citation37] and miRanda (http://www.miranda-im.org/; accessed on 14th April 2021) [Citation38]. Differentially expressed miRNAs among the following group pairs were selected: LPS-stimulated and control groups; LPS-stimulated/adalimumab-treated and control groups; LPS-stimulated/CSA-treated and control groups.
Quantitative reverse transcription polymerase chain reaction (qRT-PCR) analysis
The microarray data were validated using quantitative Reverse Transcription Polymerase Chain Reaction (qRT-PCR), which was performed using the SensiFast SYBR No-ROX One-Step kit (Bioline, London, UK), following the manufacturer’s instructions. The expression patterns of selected genes in the drug-treated cells were presented as fold change (FC) relative to those in the control cells. The relative expression levels were determined using the 2−∆∆Ct method (FC for the control was set as 1.0). The following specific primers (Thermo Fisher Scientific, USA) were used for qRT-PCR analysis: HRH1, Hs00185542_m1; HRH2, Hs00254569_s1; HRH3, Hs00200610_m1; GABRB1, Hs00181306_m1; GABRB2, Hs00241451_m1, GABRB3, Hs00241459_m1; HTMT, Hs02759756_s1); ACTB, Hs03023943_g1. β-actine (ACTB) served as an endogenous control.
Enzyme-linked immunosorbent assay (ELISA)
Next, the expression of HRH1, HRH2, and HRH3 at the protein level was comparatively analyzed between drug-treated and control HaCaT cells using Enzyme-linked immunosorbent assay (ELISA).
The following ELISA kits were used in this study: ELISA kit for Histamine Receptor H1 (HRH1) (Hölzel Diagnostika Handels GmbH, Köln, Germany; Catalog number: SEG037Hu); Human Histamine (HIS) ELISA kit (MyBioSource, Inc., San Diego, CA, USA; Catalog number: MBS265945); ELISA kit for histamine receptor H3 (HRH3) (Hölzel Diagnostika Handels GmbH; Catalog number: DL-HRH3-Hu-48 T).
For total protein extraction, HaCaT cells were washed with cold phosphate-buffered saline (PBS) and lysed in radioimmunoprecipitation assay lysis buffer (0.5% deoxycholate, 1% Nonidet P-40, 0.1% sodium dodecyl sulfate, 100 μg/mL phenylmethylsulfonyl fluoride, 1 mM Na2VO4, and 8.5 μg⁄mL of aprotinin in PBS) with shaking for 20 min at 4°C. The samples were collected using a scraper, incubated for 60 min at 4°C, and centrifuged for 15 min at 4°C. The supernatant was stored at −20°C until use.
The samples were transferred to the ELISA plate wells containing biotin-labeled antibodies, washed with PBS, and incubated with the avidin–peroxidase conjugates. The standard curve was prepared by plotting the mean optical density and concentration of each standard and multiplied by the dilution factor
Statistical analysis
Statistical analyses were performed using the licensed versions of the Statistica 13.0 PL (StatSoft, Cracow, Poland), the Transcriptome Analysis Console programs (Affymetrix), and Protein Analysis Through Evolutionary Relationships (PANTHER) Classification System 16.0 program. The normality of the data distribution was examined using the Shapiro-Wilk test (p < 0.05). The means between groups were analyzed using analysis of variance (ANOVA), followed by Tukey’s post-hoc test (p < 0.05).
Results
Microarray profile of histaminergic system-related genes in LPS-stimulated HaCaT cells treated with Adalimumab or CSA
Of the 22,277 mRNAs in the HG-U133A_2 microarrays (Affymetrix), 65 are associated with the histaminergic system.
One-way ANOVA with Benjamini-Hochberg multiple testing correction revealed that of the 65 histaminergic system-associated mRNAs, 12 were differentially expressed between LPS-treated and control cells (p < 0.05). Additionally, 16 mRNAs were differentially expressed between LPS-stimulated/adalimumab-treated and control HaCaT cells, while 14 mRNAs were differentially expressed between LPS-stimulated/CSA-treated and control HaCaT cells (p < 0.05).
Tukey’s post-hoc test revealed the number of significant differentially expressed mRNAs between the compared groups. The number of differentially expressed mRNAs between groups treated with LPS for various durations and control group was presented in and was as follows: H_2 versus control groups, 6 mRNAs: Histamine N-Methyltransferase (HNMT), 5-Hydroxytryptamine Receptor 6 (HTR6), endothelin 1 (EDN1), Endothelin receptor type A (EDNRA), LYN proto-oncogene, Src family tyrosine kinase (LYN), Adenosine deaminase (ADA); H_8 versus control groups, 8 mRNAs (END1, EDRA, LYN, ADA, Solute carrier family 22 member 3 (SLC3A2), HRH1, HRH2, HRH3); H_24 versus control groups, 5 mRNAs: LYN, ADA, SLC23A2, gamma-aminobutyric acid type A receptor subunit beta 1 (GABRB1), gamma-aminobutyric acid type A receptor subunit beta 3 (GABRB3).
Table 1. Changes in the expression profile of genes differentiating keratinocyte cultures exposed to LPS compared to the controls (p < 0.05; −2.0 < FC> +2.0 at least in one comparison).
Meanwhile, the number of differentially expressed mRNAs between LPS-stimulated groups treated with CSA for various durations and control group () was as follows: H_2 and control groups, 11 mRNAs: SLC23A2, DRD2, EDN1, ADA, HRH1, HRH2, HRH3, LYN, EDNRA); H_8 and control groups, 11 mRNAs (HRH1, HRH2, HRH3, LYN, EDNRA, Gamma-aminobutyric acid (GABA) A receptor, alpha 2 (GABRB2), ADCYAP1, SNX, HNMT, Dopamine Receptor D2 (DRD2), EDN1; H_24 and control groups, 7 mRNAs: ADA, GABRB3, HNMT, DRD2, EDN1, Adenylate Cyclase Activating Polypeptide 1 (ADCYAP1) and Sorting Nexin 1 (SNX).
Table 2. Changes in the expression profile of genes differentiating keratinocyte cultures exposed to LPS and cyclosporin A compared to the controls (p < 0.05; −2.0 < FC> +2.0 at least in one comparison).
Furthermore, the number of differentially expressed mRNAs between LPS-stimulated groups treated with adalimumab for various durations and control group () was as follows: H_2 and control groups, 9 mRNAs (DRD2, SNX, GABRB3, ADA, HTR6, EDN1, HRH1, HRH3, SLC23A2); H_8 and control groups, 11 mRNAs (HTR6, EDN1, HRH1, HRH3, SLC23A2, HNMT, GABRB1, EDNRA, diaphanous related formin 1 (DIAPH1), LYN, Vesicle associated membrane protein 2 (VAMP2); H_24 and control groups, 9 mRNAs: GABRB2, GABRB1, GABRB3, HNMT, ADA, EDNRA, HRH1, HRH3, SLC23A2.
Table 3. Changes in the expression profile of genes differentiating keratinocyte cultures exposed to LPS and Adalimumab compared to the controls (p < 0.05; −2.0 < FC> +2.0 at least in one comparison).
Next, the number of characteristic mRNAs among the differentially expressed mRNAs in the groups treated with the drugs for 2, 8, and 24 h and control group was determined and showed in the Venn diagram ().
Figure 1. The Venn diagram of microarray results (p < 0.05). (a) List of mRNAs statistically significant differences HaCaT cells treated with LPS in comparison to a control cells. (b) List of mRNAs statistically significant differences HaCaT cells treated with LPS and next to cyclosporine A in comparison to a control cells. (c) List of mRNAs statistically significant differences HaCaT cells treated with LPS and next Adalimumab in comparison to a control cells.
In LPS-stimulated HaCaT cells, the number of characteristic mRNAs in different groups was as follows: H_2 group, 2 of the 6 differentially expressed mRNAs: HNMT, HTH6; H_8 group, 3 of the 8 differentially expressed mRNAs: HRH1, HRH2, HRH3; H_24 group, 2 of the f5differentially expressed mRNAs: GABRB1, GABRB3. LYN and ADA exhibited differential expression irrespective of the treatment duration ()).
In LPS-stimulated/CSA-treated HaCaT cells, the number of characteristic mRNAs was as follows: H_2 group, three: SLC23A2, DRD2, and EDN1 of the 11 differentially expressed mRNAs; H_8 group, one mRNA corresponds to GABRB2 of the 11 differentially expressed mRNAs; H_24 group, one mRNA corresponds to GABRB3 of the seven differentially expressed mRNAs. ADCYAP1 and SNX exhibited differential expression patterns irrespective of the treatment duration ()).
In LPS-stimulated/adalimumab-treated HaCaT cells, the number of characteristic mRNAs was as follows: H_2 group, 2 of the 11 differentially expressed mRNAs: DRD2, SNX; H_8 group, 3 of the 11 differentially expressed mRNAs: DIAPH1, LYN, VAMP; H_24 group, 1 mRNA corresponds to GABRB2 of the 9 differentially expressed mRNAs. HRH1, HRH3 and SLC23A2 were differentially expressed irrespective of the treatment duration ()).
qRT-PCR analysis of histaminergic system-related genes in LPS-stimulated HaCaT cells treated with Adalimumab or cyclosporine A
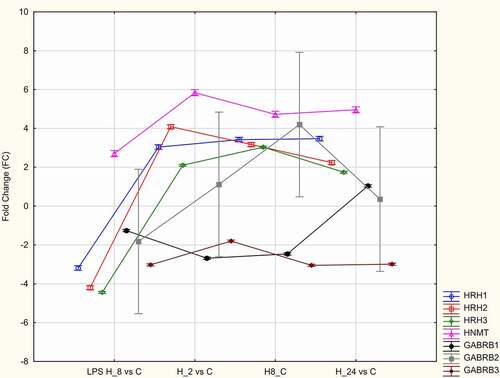
The microarray data were validated using qRT-PCR. In the microarray analysis, the expression levels of HRH1, HRH2, HRH3, HNMT, GABRB1, GABRB2, and GABRB3 exhibited the most marked changes. Hence, the expression levels of these genes were validated using qRT-PCR analysis. The results of qRT-PCR were consistent with those of microarray analysis (). The expression levels of HRH1, HRH2, HRH3, and HNMT in LPS-stimulated/adalimumab-treated HaCaT cells were upregulated (independent of the treatment duration) when compared with those in control cells. In contrast, the expression levels of GABRB1, GABRB2, and GABRB3 in LPS-stimulated/adalimumab-treated cells were downregulated when compared with those in control cells ().
Figure 2. Quantitative real-time polymerase chain reaction analysis of the mRNA expression patterns of HRH1, HRH2, HRH3, HNMT, GABRB1, GABRB2, and GABRB3 in lipopolysaccharide (LPS)-stimulated/Adalimumab-treated and control HaCaT cells.
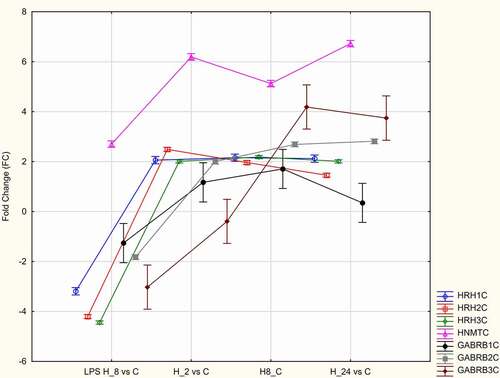
Compared with those in control cells, the expression levels of HNMT, HRH1, HRH2, HRH3, GABRB1, GABRB2, and GABRB3 were upregulated in LPS-stimulated/CSA-treated HaCaT cells ().
Figure 3. Quantitative real-time polymerase chain reaction analysis of mRNA expression patterns of HRH1, HRH2, HRH3, HNMT, GABRB1, GABRB2, and GABRB3 in lipopolysaccharide-stimulated/cyclosporine A-treated HaCaT cells.
Expression patterns of miRNAs that regulate the expression of differentially expressed genes between LPS-stimulated/drug-treated cells and control cells
The expression patterns of miRNAs potentially involved in the regulation of differentially expressed histaminergic system-associated genes between drug-treated and control cells were analyzed. The number of differentially expressed miRNAs between different group pairs was as follows: LPS-treated and control groups, 4 miRNAs: hsa-miR-3202, hsa-miR-3915, hsa-miR-27a-5p, hsa-miR-382; LPS-stimulated/adalimumab-treated and control groups, 7 miRNAs: hsa-miR-33a-5p, hsa-miR-382, hsa-miR-3202, hsa-miR-583, hsa-miR-1-3p, hsa-miR-1275, hsa-miR-27a-5p; LPS-stimulated/CSA-treated and control groups, 4 miRNAs: hsa-miR-1275, hsa-miR-583, hsa-miR-575. In turn, hsa-miR-1275, hsa-miR-583 were differentially expressed among LPS-stimulated HaCaT cells irrespective of treatment with adalimumab or CSA ().
Table 4. The expression profile of miRNAs regulating the expression of selected mRNAs in HaCaT treated with LPS and next Adalimumab or cyclosporine A after 2, 8, and 24 hours of exposure in comparison to the control culture.
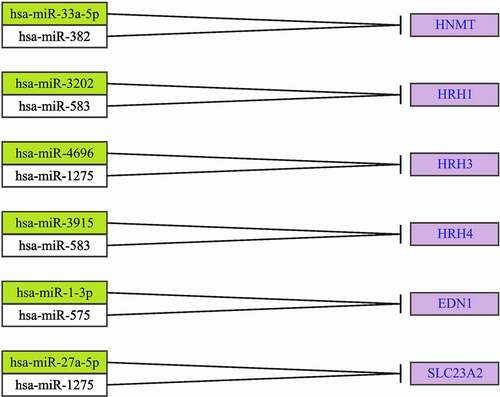
Bioinformatics analysis revealed the miRNAs that are potentially involved in the regulation of the expression of previously selected mRNAs ().
Figure 4. MicroRNAs (miRNAs) that modulate the expression of differentially expressed genes between drug-treated and control HaCaT cells.
Effect of Adalimumab and CSA on the expression levels of HRH1, HRH2, and HRH3 in LPS-stimulated HaCaT cells
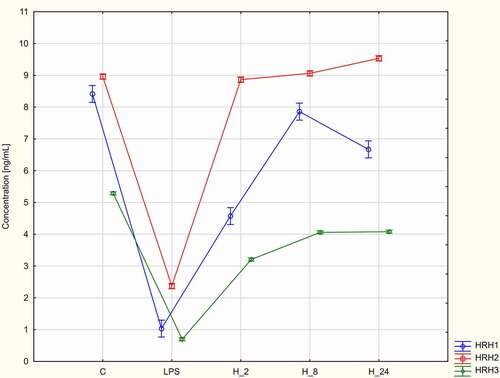
The effects of treatment with adalimumab or CSA for different durations on the HRH1, HRH2, and HRH3 levels were evaluated. The HRH1, HRH2, and HRH3 levels in LPS-stimulated cells were significantly lower than those in control cells and increased upon treatment with adalimumab or CSA (p < 0.05, ). The HRH1 and HRH3 levels were the highest in LPS-stimulated HaCaT cells treated with adalimumab or CSA in the H_8 group. The HRH2 levels were the highest in LPS-stimulated/adalimumab-treated cells in the H_8 group. Meanwhile, the HRH2 levels were the highest in LPS-stimulated/CSA-treated HaCaT cells in the H_24 group ().
Figure 5. Comparative analysis of the HRH1, HRH2, and HRH3 levels in lipopolysaccharide-stimulated/Adalimumab-treated and control HaCaT cells using enzyme-linked immunosorbent assay (p < 0.05).
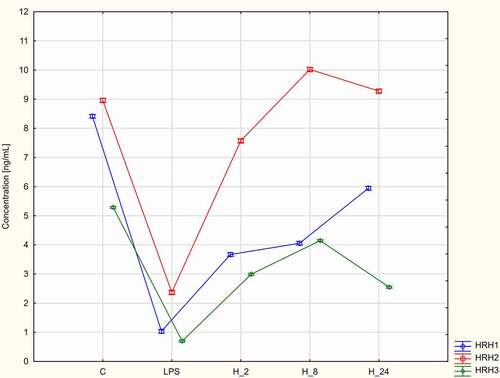
Figure 6. Comparative analysis of HRH1, HRH2, and HRH3 levels in lipopolysaccharide-stimulated/cyclosporine A-treated and control HaCaT cells using enzyme-linked immunosorbent assay (p < 0.05).
Analysis of the signaling pathways in which histaminergic system-related genes are involved
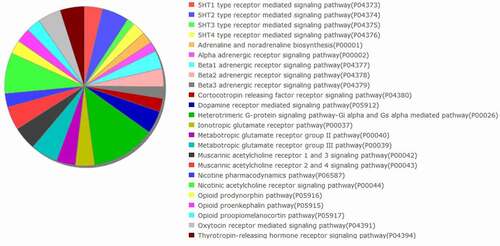
The signaling pathways in which the histaminergic system-related genes are involved were analyzed using the PANTHER database. shows the complexity of the histaminergic system.
Figure 7. Analysis of signaling pathways in which the histaminergic system-associated genes are involved using the Protein Analysis Through Evolutionary Relationships (PANTHER) classification system [Citation42].
![Figure 7. Analysis of signaling pathways in which the histaminergic system-associated genes are involved using the Protein Analysis Through Evolutionary Relationships (PANTHER) classification system [Citation42].](/cms/asset/97ad5f61-8b7b-4f33-a727-0e8437548ed3/kccy_a_2103342_f0007_b.gif)
Discussion
In this study, LPS, which was previously reported to induce inflammation by Triantafilou and Triantafilou [Citation39], was used to mimic the inflammatory conditions in the epidermal area in vitro. LPS is recognized by the human immune system and elicits a severe inflammatory reaction, which leads to multiple organ dysfunction syndrome and death [Citation39]. The effects of LPS are mediated by its interaction with the LPS-binding protein and subsequently with the CD14 surface protein [Citation40,Citation41]. In this study, the effects of adalimumab or CSA were examined in LPS-stimulated cells.
The results of this study indicated the complexity of the histaminergic system. The histaminergic system comprises genes coding histamine receptors and enzymes involved in the metabolism of histamine. Additionally, the histaminergic system interacts with other neural systems, including the dopaminergic [Citation5], GABAergic [Citation6], opioidergic [Citation7], noradrenergic [Citation40], and angiotensynergic systems [Citation41], which was confirmed using the PANTHER database [Citation42]. The findings of this study also suggested that the inflammatory condition modulates the histaminergic system and that the histaminergic system-associated genes are involved in the pathogenesis of psoriasis. Treatment with CSA and adalimumab modulated the expression patterns of histaminergic-associated genes.
Elucidating the roles of the histaminergic system in psoriasis and the efficacy of psoriasis treatment is critical as histamine mediates skin itching, a major symptom of psoriasis [Citation43]. As molecular changes precede phenotypic changes [Citation44], molecular studies must also be performed.
Similar to the mast cells in the skin, HaCaT cells release histamine [Citation45], which regulates the inflammatory response in HaCaT cells [Citation46].
Treatment with CSA or adalimumab upregulated the expression levels of three (HRH1, HRH2, and HRH3) of the four genes encoding histamine receptors in LPS-stimulated HaCaT cells. However, the anti-TNF-α drug may potently modulate the expression of these genes. This study performed ELISA to determine the concentration of HRH1, HRH2, and HRH3 in HaCaT cells. ELISA is a widely used technique in biomedical research for research and diagnostic purposes. The advantages of ELISA include rapid analysis, high accuracy, ease of handling, possibility of automation, safety, and cost-effectiveness. The major limitation of ELISA is the lack of a universal procedure for various types of research material. All parameters that are essential for obtaining accurate results are highly specific and strongly dependent on the reagents [Citation47]. Beermaann et al. [Citation48] indicated that no specific antibody is available for HRH4. Therefore, ELISA cannot be used to determine the expression of HRH4 [Citation48]. Glatzer et al. [Citation49] confirmed the mRNA levels of HRH1, HRH2, HRH3, and HRH4 in human primary neonatal keratinocytes isolated from the foreskin. The authors reported that the expression of HRH4 in HaCaT cells was low or undetectable. However, the expression of HRH1 and HRH4 was detected in HaCaT cells after transfection with an HRH4-expressing plasmid. The proliferation of vector-transfected HaCaT was higher than that of non-transfected and control-transfected HaCaT cells [Citation49]. This suggests that LPS and adalimumab alter the expression of histamine receptors, such as HRH4 in HaCaT cells.
The upregulated expression of ET1, which is always synthesized de novo, contributes to the contraction of blood vessels. This may result from adaptive mechanisms after the drugs are added to the cell culture or due to persistent inflammation. Chronic and acute cases of psoriasis and atopic dermatitis are characterized by upregulated expression of ET1 [Citation50].
The results of this study are partially consistent with those of Fujimoto et al. who demonstrated the expression of only HRH1 and HRH2 in HaCaT cells. The authors indicated that the upregulation of HRH3 may be a false-positive result [Citation51], which was not consistent with the results of Cannon et al. [Citation52]. Cannon et al. demonstrated the expression of HRH3 in the skin of rodents using immunohistochemical staining [Citation52]. Suwa et al. reported that the expression of HRH4 in HaCaT cells may be dependent on the concentration of calcium ions in the culture medium [Citation53].
However, in this study, HaCaT cells were stimulated with LPS, followed by treatment with CSA or adalimumab. Therefore, the possibility of LPS inducing HRH3 expression cannot be ruled out.
N-methylhistamine, whose concentration in urine is an indicator of the activation of mast cells, is involved in histamine metabolism in humans. HNMT is responsible for the intracellular decomposition of approximately 80% of histamine in the system [Citation54–56]. Nagnuma et al. [Citation57] demonstrated that the deficiency of HNMT increased the concentration of histamine in the mouse brain, which disrupted the sleep-wake cycle and increased the frequency of aggressive behavior [Citation57]. Moreover, clinical studies by Yoshikawa et al. suggest that single nucleotide polymorphism of HNMT in humans is associated with disorders in the central nervous system, which lead to the development of attention-deficit hyperactivity disorder or Parkinson’s disease [Citation58]. The upregulation of histamine in the brain by downregulating HNMT can be an effective therapeutic strategy for methamphetamine addiction and overdose. Methamphetamine causes dopaminergic neurotoxicity with a loss of striatal dopaminergic nerve endings [Citation57–59]. Adalimumab and CSA activate mechanisms associated with the biotransformation of histamine, potentially by increasing its concentration. However, this cannot be confirmed because the histamine concentration in the culture medium was not markedly high. Histamine is reported to decrease the concentration of TNF-α and IL12 and concomitantly upregulate the expression of IL10 [Citation60]. This suggests that histamine also mediates its effects through the JAK/STAT pathway. This is consistent with our previous observation of the roles of adalimumab and CSA in the vicious cycle of inflammation [Citation61]. Therefore, histamine is characterized by dual activities.
T lymphocytes promote the hyperproliferation of keratinocytes in psoriasis. Adenosine deaminase (ADA), which mediates the degradation of purines, is an atypical marker for T lymphocyte activation [Citation62–64]. Khan et al. [Citation65] demonstrated that ADA concentration in patients with psoriasis is higher than that in the control group. Additionally, the ADA concentration is linearly correlated with the severity of the disease [Citation65]. Yildirim et al. [Citation66] demonstrated that the average concentration of ADA before treatment with CSA was higher than that after treatment [Citation66]. This is consistent with the findings of this study. In this study, the expression of ADA in drug-treated HaCaT cells was higher than that in control cells. The expression of ADA in HaCaT cells treated with CSA for 24 h was approximately three times lower than that in control cells. This suggests that CSA inhibits ADA activity. The upregulation of ADA should be considered within the context of the adalimumab and CSA-mediated activation of immune mechanisms. However, this effect is prominent after treatment with a biological drug [Citation65].
Adalimumab and CSA exerted contrasting effects on the expression of GABA receptors. The expression levels of GABRB1 and GABRB2 were downregulated upon treatment with adalimumab but upregulated upon treatment with CSA. This suggests that these genes and proteins are potential novel therapeutic targets. The expression of GABAergic system-associated genes is correlated with pruritus, which accompanies psoriasis [Citation67]. Further analysis must be performed using various samples, especially clinical samples.
The role of miRNAs in the regulation of histaminergic system-associated genes was evaluated. Predictive analysis revealed that miRNAs regulated histaminergic system-associated genes in the presence of LPS, adalimumab, or CSA. However, this effect was prominent in the presence of the anti-TNF-α drug. A single miRNA can regulate the expression of more than one mRNA. Additionally, one gene may be regulated by more than one miRNA. The following two miRNAs were differentially expressed irrespective of the drug: hsa-miR-583 (downregulated expression), regulates HRH1 expression (overexpression); hsa-miR-1275 (downregulated expression), regulates HRH3 expression (overexpression) and SLC23A2 (downregulation).
miR-583 is also involved in the regulation of SRY-Box Transcription Factor 9 (SOX9), Insulin-like growth factor 1 (IGF1), and matrix metalloproteinase-2 (MMP2) and the signaling pathways dependent on epidermal growth factor receptor, phosphatidylinositol 3-kinase-protein kinase B (PI3K-AKT), and bone morphogenetic protein (BMP). SOX9, MMP2, and IGF1 promote the cellular anabolic processes [Citation68–70]. Chen et al. [Citation71] and Joo et al. [Citation72] demonstrated a positive correlation between the upregulated expression of bone morphogenetic protein 2 (BMP2) and bone morphogenetic protein 6 (BMP6) and the severity of ankylosing spondylitis [Citation70]. Additionally, Chen et al. [Citation71] demonstrated that the expression of BMP2 is dependent on the exposure of peripheral blood mononuclear cells to TNF-α [Citation71].
Li et al. [Citation73] reported that miR-583 inhibits the proliferation of cells [Citation73]. Therefore, silencing miR-583 expression may result in the hyperproliferation of HaCaT cells. However, the results of our previous studies indicate that adalimumab and CSA did not inhibit HaCaT proliferation at the tested concentrations. This discrepancy may be because Li et al. [Citation73] used a prostate cancer cell line, whose metabolism differs from that of healthy cells.
The expression of hsa-miR-1275 in drug-treated cells was higher than that in control cells. Farr et al. [Citation74] confirmed the effectiveness of adalimumab and CSA combination therapy against keratinocytes. The serum level of miR-1275 in patients with coronavirus disease was downregulated when compared with that in healthy volunteers. Thus, the upregulated activity of miR-1275 must be interpreted within the context of downregulated inflammatory conditions and cytokine storm associated with the ongoing inflammation. miR-1275 was differentially expressed between drug-treated and control cells. Sonkoly et al. [Citation75] indicated that the expression levels of miR-203, miR-146a, miR-21, and miR-125b in patients with psoriasis were different from those in healthy volunteers and patients with atopic eczema. Rabby et al. [Citation76] used a mouse model of Aldara-induced psoriasis-like skin inflammation to demonstrate that adalimumab significantly modulates miR-1275 expression. miRNAs regulate the expression of genes coding proteins (HRH1, HRH2, and HRH3) directly associated with the histaminergic system. HNMT is regulated by hsa-miR-3202 (HRH1 in a culture with adalimumab), hsa-miR-583 (HRH1, independent of the drug added to the culture), hsa-miR-1275 (SLC23A2 and HRH3), hsa-miR-4696 (HRH3 in a culture with CSA), and hsa-miR-382 (HNMT in a culture with adalimumab).
The role and significance of miR-382 have been widely examined. miR-382 is downregulated in various types of cancers. Previous studies have reported that miR-382 is involved in angiogenesis and cancer invasion. miR-382 inhibits the proliferation, migration, and invasion of cancer cells and suppresses epithelial-mesenchymal transition [Citation77]. Based on the etiopathogenesis of psoriasis, the adalimumab-mediated upregulation of miR-382 in HaCaT cells may be a potential therapeutic strategy for psoriasis. However, the observations of Seok et al. [Citation78] must also be considered. The authors reported that miR-382 promotes angiogenesis and functions as an angiogenic oncogene by inhibiting PTEN under hypoxic conditions [Citation78].
hsa-miR-1-3p, hsa-miR-575 regulate the expression of EDN1, while hsa-miR-27a and hsa-miR-1275 potentially regulate the activity of SLC23A2.
SLC23A2 codes for an organic cation transporter 3 (OCT protein), which is involved in the external transport of bioamines and some drugs, such as metformin, histamine, and dopamine [Citation79]. The downregulation of SLC23A2 increases the intracellular concentration of histamine [Citation37,Citation38,Citation80].
The strengths of this study include the usage of modern methods to evaluate gene expression, determination of the changes in the histaminergic system induced by LPS, adalimumab, and CSA at the transcriptome and proteome levels, and examination of the miRNA-mediated epigenetic mechanism of gene regulation. In addition, we confirmed the influence of adalimumab on the expression of mRNAs and miRNAs related to histaminergic system in Normal Human Dermal Fibroblasts (NHDFs). We observed the statistically significant changes in expression profile of genes, namely: SLC22A3, EDNRA, EDN1, VAMP, HNMT, ADA, HRH1, DIAPH1, SNX, DRD2, LYN and GABRA1. It was also confirmed the differences in expression of miRNAs: hsa-miR-1275, hsa-miR- 382, hsa-miR- 34a, hsa-miR- 1909, hsa-miR- 196a, hsa-miR- 143, hsa-miR- 199a-5p, hsa-miR- 1231, hsa-miR- 16, hsa-miR- 22, hsa-miR- 34a, hsa-miR- 939, hsa-miR- 3162 [Citation1]. This study has several limitations. The results of this study were not validated in vivo. Additionally, the expression levels of HRH1, HRH2, and HRH3 were not examined at the proteome level using western blotting. The use of NHEK cultures should be considered to validate the results of qRT-PCR and ELISA analyses.
In summary, this study demonstrated that adalimumab and CSA modulate the activity of the histaminergic system in HaCaT cells in vitro. However, further studies are needed to elucidate the underlying mechanisms. The concentrations of HRH1, HRH2, and HRH3 in LPS-stimulated cells were significantly lower than those in control cells but increased upon treatment with adalimumab or CSA (p < 0.05). hsa-miR-583 (downregulated expression; involved in the regulation of HRH1 expression (overexpression)) and has-miR-1275 (downregulated expression; involved in the regulation of HRH3 expression (overexpression) and SLC23A2 (downregulation)) were differentially expressed irrespective of treatment with adalimumab or CSA in LPS-stimulated HaCaT cells.
Author contributions
Conceptualization, T.K. and B.O.G.; methodology, T.K. and M.D.; formal analysis, B.Z.W.; resources, K.B.; M.W.-S.; data curation, T.K., and M.D.; writing—original draft preparation, T.K., W.W., M.M.; writing—review and editing, T.K., and B.O.G.; visualization, W.W., and M.M.; supervision, B.O.G.; project administration, B.O.G. All authors have read and agreed to the published version of the manuscript.
Institutional review board statement
Ethical review and approval were waived for this study, due to using the commercially available cell line, only an in vitro study was performed.
Acknowledgments
We would like to thank Mrs. Sonia Banaszak for improving the figures.
Disclosure statement
No potential conflict of interest was reported by the author(s).
Data availability statement
All data was included in the paper.
Additional information
Funding
References
- Wcisło-Dziadecka D, Grabarek B, Zmarzły N, et al. Influence of adalimumab on the expression profile of genes associated with the histaminergic system in the skin fibroblasts in vitro. Biomed Res Int. 2018Jan2;2018:1582173. PMID: 29487864; PMCID: PMC5816894.
- Li B, Zhu JN, Wang JJ. Histaminergic afferent system in the cerebellum: structure and function. CerebellumAtaxias. 2014Jun16;1:5. PMID: 26331029; PMCID: PMC4549136.
- Reich A, Adamski Z, Chodorowska G, et al. Psoriasis. diagnostic and therapeutic recommendations of the polish dermatological society. part 2. Dermatology Review/Przeglad Dermatologiczny. 2020;107(2):110–137.
- Szczerkowska-Dobosz A, and Nowicki R. Algorytm leczenia łuszczycy. ABC łuszczycy. Łuszczyca w pytaniach i odpowiedziach Poznań, Poland: Termedia Sp z o. o. 2016;155–162. 987-83-7988-122-2.
- Zhuang QX, Xu HT, Lu XJ, et al. Histamine excites striatal dopamine D1 and D2 receptor-expressing neurons via postsynaptic H1 and H2 receptors. Mol Neurobiol. 2018;55(10):8059–8070.
- Yang L, Wang Y, and Chen Z. Central histaminergic signaling, neural excitability, and epilepsy. British Journal of Pharmacology. 2020;179:3–22. https://bpspubs.onlinelibrary.wiley.com/doi/epdf/10.1111/bph.15692
- Valizadegan F, Zarrindast M. Interaction between dorso-hyppocampal histaminergic and medio-septal opioidergic systems in anxiety behavior. Nova BiologicaReperta. 2017;4(2):189–200.
- Feldmann M, Williams RO, Paleolog E. What have we learnt from targeted anti-TNF therapy? Ann RheumDis. 2010Jan;69(Suppl 1):i97–99. PMID: 19995756.
- Benhadou F, Mintoff D, Del Marmol V. Psoriasis: keratinocytes or immune cells–which is the trigger? Dermatology. 2019;235(2):91–100.
- Hugh JM, Weinberg JM. Update on the pathophysiology of psoriasis. Cutis. 2018;102(5S):6–12.
- Deng Y, Chang C, Lu Q. The inflammatory response in psoriasis: a comprehensive review. Clin Rev Allergy Immunol. 2016;50(3):377–389.
- de Freire Cassia F, Cardoso JF, Porto LC, et al. Association of HLA alleles and HLA haplotypes with psoriasis, psoriatic arthritis and disease severity in a miscegenated population. Psoriasis: Targets and Ther. 2021;11:41.
- Stannard JN, Reed TJ, Myers E, et al. Lupus skin is primed for IL-6 inflammatory responses through a keratinocyte-mediated autocrine type I interferon loop. J Invest Dermatol. 2017;137(1):115–122.
- Bunker EN, Wheeler GE, Chapnick DA, et al. Suppression of α-catenin and adherens junctions enhances epithelial cell proliferation and motility via TACE-mediated TGF-α autocrine/paracrine signaling. Mol Biol Cell. 2021;32(4):348–361.
- Grabarek BO, Kasela T, Adwent I, et al. Evaluation of the influence of adalimumab on the expression profile of leptin-related genes and proteins in keratinocytes treated with lipopolysaccharide a. Int J Mol Sci. 2021;22(4):1595.
- Grabarek BO, Dąbala M, and Kasela T, et al. Changes in the expression pattern of DUSP1-7 and miRNA regulating their expression in the keratinocytes treated with LPS and adalimumab. Curr Pharm Biotechnol. 2021;23(6):873–881. doi:10.2174/1389201022666210802102508.
- Adwent I, Grabarek BO, and Kojs-Mrożkiewicz M, et al. The influence of adalimumab and cyclosporine a on the expression profile of the genes related to TGFβ signaling Pathways in Keratinocyte Cells Treated with Lipopolysaccharide A Mediators of Inflammation. Mediators of Inflammation. 2020;2020:1–11. https://www.hindawi.com/journals/mi/2020/3821279/.
- Grabarek B, Schweizer M, and Adwent I, et al. Differences in expression of genes related to drug resistance and miRNAs regulating their expression in skin fibroblasts exposed to Adalimumab and cyclosporine A. Adv in Dermatol and Allergology/Postepy Dermatologii I Alergologii. 2020;36(1):249–255.
- Tsao MC, Walthall BJ, Ham RG. Clonal growth of normal human epidermal keratinocytes in a defined medium. J Cell Physiol. 1982;110(2):219–229.
- Dalmau N, Andrieu-Abadie N, Tauler R, et al. Phenotypic and lipidomic characterization of primary human epidermal keratinocytes exposed to simulated solar UV radiation. J Dermatol Sci. 2018;92(1):97–105.
- Colombo I, Sangiovanni E, Maggio R, et al. HaCaT cells as a reliable in vitro differentiation model to dissect the inflammatory/repair response of human keratinocytes. Mediators Inflamm. 2017;2017:1–12.
- Deyrieux AF, Wilson VG. In vitro culture conditions to study keratinocyte differentiation using the HaCaT cell line. Cytotechnology. 2007;54(2):77–83.
- Murdaca G, Spanò F, Contatore M, et al. Immunogenicity of infliximab and Adalimumab: what is its role in hypersensitivity and modulation of therapeutic efficacy and safety? Expert Opin DrugSaf. 2016Jan;15(1):43–52. Epub 2015 Nov 11. PMID: 26559805.
- Murdaca G, Negrini S, Greco M, et al. Immunogenicity of infliximab and Adalimumab. Expert Opin DrugSaf. 2019May;18(5):343–345. Epub 2019 Apr 16. PMID: 30938213.
- Feldmann M, Maini RN. Anti-TNF therapy, from rationale to standard of care: what lessons has it taught us? J Immunol. 2010Jul15;185(2):791–794. PMID: 20601610.
- Fujisaki Y, Yamauchi A, Shuto H, et al. Pharmacological characterization of cyclosporine A-induced kaolin intake in rats. PharmacolBiochemBehav. 2001Oct-Nov;70(2–3):267–271. PMID: 11701197.
- Zhang S, Cheng Z, Wang Y, et al. The risks of miRNA therapeutics: in a drug target perspective. Drug Des Devel Ther. 2021;15:721–733.
- Bavelloni A, Ramazzotti G, Poli A, et al. MiRNA-210: a current overview. Anticancer Res. 2017;37(12):6511–6521.
- Moore LD, Le T, Fan G. DNA methylation and its basic function. Neuropsychopharmacology. 2013;38(1):23–38.
- Dor Y, Cedar H. Principles of DNA methylation and their implications for biology and medicine. Lancet. 2018;392(10149):777–786.
- Budak M, Ozkan U, Yildiz M. Identification of potential methylation regions of the Smad4 mRNA and determining primer sequences for MS-PCR with the ‘Methprimer’program. Int J Genet Genomics. 2019;7(3):55.
- Stolzenbach F, Valdivia S, Ojeda-Provoste P, et al. BBA-molecular basis of disease.
- Yin Y, Morgunova E, Jolma A, et al. Impact of cytosine methylation on DNA binding specificities of human transcription factors. Science. 2017;356(6337).
- Locke WJ, Guanzon D, Ma C, et al. DNA methylation cancer biomarkers: translation to the clinic. Front Genet. 2019;10:1150.
- Kim J, Lee Y, Lu X, et al. Polycomb-and methylation-independent roles of EZH2 as a transcription activator. Cell Rep. 2018;25(10):2808–2820.
- McLaughlin K, Flyamer IM, Thomson JP, et al. DNA methylation directs polycomb-dependent 3D genome re-organization in naive pluripotency. Cell Rep. 2019;29(7):1974–1985.
- Agarwal V, Bell GW, Nam J, et al. Predicting effective microRNA target sites in mammalian mRNAs. eLife. 2015;4:e05005.
- Chen Y, Wang X, Yuhao Chen and Xiaowei Wang. miRDB: an online database for prediction of functional microRNA targets. Nucleic Acids Res. 2020;48(D1):D127–D131.
- Triantafilou M, and Triantafilou K. Lipopolysaccharide recognition: CD14, TLRs and the LPS-activation cluster. Trends Immunol 2002 June 01;23(6):301–304.
- Mirnaghizadeh SV, Zendehdel M, Babapour V. Involvement of histaminergic and noradrenergic receptors in the oxytocin-induced food intake in neonatal meat-type chicks. Vet Res Commun. 2017;41(1):57–66.
- Jochem J, Zwirska-Korczala K, Sowa P, et al. Interactions between the histaminergic and angiotensinergic systems in the central cardio-vascular regulation in rats. Inflamm Res. 2006;55(Suppl. 1):s69–S70.
- Mi H, Ebert D, Muruganujan A, et al. PANTHER version 16: a revised family classification, tree-based classification tool, enhancer regions, and extensive API. Nucleic Acids Res. 2021;49(D1):D394–D403.
- Stark H. Histaminereceptors. Biotrend Rev. 2007;11:1–9.
- Zmarzły N, Hermyt E, and Kruszniewska-Rajs C, et al. Expression profile of EMT-related genes and miRNAs involved in signal transduction via the WntPathway and cadherins in endometrialcancer. Curr Pharm Biotechnol. 2021;22(12):1663–1671. doi:10.2174/1389201021666201218125900.
- Fitzsimons C, Engel N, Policastro L, et al. BiochemicalPharmacol 2002. Biochemical Pharmacology. 2002;63:1785–1796.
- Yang CC, Hung YL, Li HJ, et al. Quercetin inhibits histamine-induced calcium influx in human keratinocyte via histamine H4 receptors. Int Immunopharmacol. 2021;96:107620.
- Kępska M, and Futoma-Kołoch B. Test immunoenzymatyczny ELISA-zasada działania i optymalizacja reakcji. Laboratorium Medyczne. 2018;2:42–29. https://yadda.icm.edu.pl/baztech/element/bwmeta1.element.baztech-f5f3b1ea-9120-4009-b3f7-9ffaa7753fef.
- Beermann S, Seifert R, Neumann D. Commercially available antibodies against human and murine histamine H 4-receptor lack specificity. Naunyn-Schmiedeberg’s Arch Pharmacol. 2012;385(2):125–135.
- Glatzer F, Gschwandtner M, Ehling S, et al. Histamine induces proliferation in keratinocytes from patients with atopic dermatitis through the histamine 4 receptor. J Allergy Clin Immunol. 2013;132(6):1358–1367.
- Nakahara T, Kido‐Nakahara M, Ohno F, et al. The pruritogenic mediator endothelin‐1 shifts the dendritic cell–T‐cell response toward Th17/Th1 polarization. Allergy. 2018;73(2):511–515.
- Fujimoto S, Komine M, Karakawa M, et al. Histamine differentially regulates the production of Th1 and Th2 chemokines by keratinocytes through histamine H1 receptor. Cytokine. 2011;54(2):191–199.
- Cannon KE, Chazot PL, Hann V, et al. Rice Immunohistochemical localization of histamine H3 receptors in rodent skin, dorsal root ganglia, superior cervical ganglia, and spinal cord: potential antinociceptive targets. Pain. 2007;129:76–92.
- Suwa E, Yamaura K, Sato S, et al. Increased expression of the histamine H4 receptor following differentiation and mediation of the H4 receptor on interleukin-8 mRNA expression in HaCaT keratinocytes. Exp Dermatol. 2014;23(2):138–140.
- Simsekoglu MF, Kaleler I, Onal B, et al. Do urinary mast cell mediators predict immune response to BCG in patients with primary high‐grade non‐muscle invasive bladder cancer? Int J Clin Pract. 2021;75(5):e13959.
- Naganuma F, Nakamura T, Yoshikawa T, et al. Histamine N-methyltransferase regulates aggression and the sleep-wake cycle. Sci Rep. 2017;7:15899.
- Yoshikawa T, Nakamura T, Yanai K. Histamine N-Methyltransferase in the brain. Int J Mol Sci. 2019;20(3):737.
- Kacik J, Wawrzyniak A, Rakowska M, et al. Objawy pseudoalergii a zaburzenia metabolizmu histaminy. Pediatria i Medycyna Rodzinna. 2016;12(3):234–241.
- Szukalski B. Neurotoksyczność metaamfetaminy – morfologiczne i molekularne zmiany w mózgu. Farmacja Polska. 2009;65(9):655–663. https://ptfarm.pl/pub/File/Farmacja%20Polska/2009/9/11%20%20Neurobiologiczne%20podstawy.pdf.
- Ares – Santos S, Granado N, Espadas I, et al. Methamphetamine causes degeneration of dopamine cell bodies and terminals of the nigrostriatal pathway evidenced by silver staining. Neuropsychopharmacology. 2014;39(5):1066–1080.
- Osadchiy V, Mayer EA, Gao K, et al. Analysis of brain networks and fecal metabolites reveals brain-gut alterations in premenopausal females with irritable bowel syndrome. Transl Psychiatry. 2020;10(1):1–8.
- Grabarek B, Wcislo-Dziadecka D, Gola J, et al. Changes in the expression profile of Jak/Stat signaling pathway genes and miRNAs regulating their expression under the Adalimumab therapy. Curr Pharm Biotechnol. 2018;19(7):556–565.
- Rajeev PD, Jain AK, Ramesh V. Current concepts in the pathogenesis of psoriasis. Indian J Dermatol. 2009;54(1):7–12.
- Zülal E, Erbagci AB, Köylüoglu O, et al. Serum adenosine deaminase activity in monitoring disease activity and response to therapy in severe psoriasis. Acta Medica (Hradec Králové). 2006;49(2):101–104.
- Sarianowska A, Krenke R, Dmowska – Sobstyl B, et al. Aktywność deaminazy adenozyny w gruźliczym I nowotworowym wysięku w opłucnej. Pneumonologia i Alergologia Polska. 2006;74:5–9.
- Khan SA, Agrawal S, Baral N, et al. Evaluation of ADA activity as a potential marker of disease severity in psoriasis patients. Psoriasis: Targets and Ther. 2018;8:59–63.
- Yildirim FE, Karaduman A, Pinar A, et al. CD26/dipeptidyl-peptidase IV and adenosine deaminase serum levels in psoriatic patients treated with cyclosporine, etanercept, and psoralen plus ultraviolet A phototherapy. Int J Dermatol. 2011;50(8):948–955.
- Nigam R, El-Nour H, Amatya B, et al. GABA and GABA A receptor expression on immune cells in psoriasis: a pathophysiological role. Arch Dermatol Res. 2010;302(7):507–515.
- Fontana G, See E, Pandit A. Current trends in biologics delivery to restore intervertebral disc anabolism. Adv Drug Deliv Rev. 2015;84:146–158.
- Shi S, Wang C, Acton AJ, et al. Role of Sox9 in growth factor regulation of articular chondrocytes. J Cell Biochem. 2015;116:391–1400.
- Li Y, Pan D, Liu S, et al. Identification of circ-FAM169A sponges miR-583 involved in the regulation of intervertebral disc degeneration. J Orthop Translat. 2021;26:121–131.
- Chen MH, Chen HA, Chen WS, et al. Upregulation of BMP-2 expression in peripheral blood mononuclear cells by proinflammatory cytokines and radiographic progression in ankylosing spondylitis. Mod Rheumatol. 2015;25(6):913–918.
- Joo YB, Bang SY, and Kim TH, et al.Bone morphogenetic protein 6 polymorphisms are associated with radiographic progression in ankylosing spondylitis. PLoS One. 2014; 9(8):1–7. article e104966
- Li Z, Chen J. miR‑583 inhibits the proliferation and invasion of prostate cancer cells by targeting JAK1. Mol Med Rep. 2021;23(3):1.
- Farr R, Rootes C, Rowntree L, et al. Altered microRNA expression in COVID-19 patients enables identification of SARS-CoV-2 infection. PLOS Pathogens. 2021;17:e1009759.
- Sonkoly E, Wei T, Janson PC, et al. MicroRNAs: novel regulators involved in the pathogenesis of psoriasis? PLoS ONE. 2007;2:e610.
- Raaby L, Langkilde A, Kjellerup RB, et al. Changes in mRNA expression precede changes in micro RNA expression in lesional psoriatic skin during treatment with Adalimumab. Br J Dermatol. 2015;173(2):436–447.
- Wang J, Chen C, Yan X, et al. The role of miR-382-5p in glioma cell proliferation, migration, and invasion. Onco Targets Ther. 2019;12:4993.
- Seok JK, Lee SH, Kim MJ, et al. MicroRNA-382 induced by HIF-1α is an angiogenic miR targeting the tumor suppressor phosphatase and tensin homolog. Nucleic Acids Res. 2014;42(12):8062–8072.
- Biniecka M, Kennedy A, Ng CT, et al. Successful tumor necrosis factor (TNF) blocking therapy suppresses oxidative stress and hypoxia-induced mitochondrial mutagenesis in inflammatory arthritis. Arthritis Res Ther. 2011;13(4):1–9.
- Clayton SA, MacDonald L, Kurowska-Stolarska M, et al. Mitochondria as key players in the pathogenesis and treatment of rheumatoid arthritis. Front Immunol. 2021;12:1488.