
ABSTRACT
Considering the determining role of TGFβ signaling in the tumor microenvironment (TME) on immune evasion, the inhibition of signaling is expected to enhance the therapeutic efficacy of immunotherapies, especially immune checkpoint blockade (ICB), which is confirmed in preclinical data. However, successive failures in clinical translation occur at the initial stage. To provide a better understanding of TGFβ signaling within the TME and its relation to the individual immunological status, we performed a pan-cancer analysis comparing the activation of TGFβ pathway among different TMEs based on multi-omics data. Compared with non-inflamed tumors, increased TGFβ signaling activity appeared in four non-cancer cell types within TME in inflamed tumors. Significant correlations were revealed between TGFβ signaling and reliable biomarkers for ICB therapy, as well as between TGFβ signaling and HPV status. Our findings contribute to explain the inconsistency between preclinical and clinical research, and are crucial to optimizing upcoming clinical trial design and improving patient stratification for personalized prediction.
Introduction
Immune checkpoint blockade (ICB) therapies are monoclonal antibodies targeting regulatory immune checkpoint molecules that inhibit T cell activation [Citation1]. Among these molecules, cytotoxic T lymphocyte associated antigen-4 (CTLA4) and programmed cell-death-1 (PD-1) are found on the surface of T cells, and programmed cell death ligand-1 (PD-L1) is expressed by cancer cells as well as other antigen presenting cells. PD-1 and CTLA4 are crucial to maintain immune self-tolerance, and ICB therapies can restore antitumor effector function of exhausted T cells. Over the last decade, they have revolutionized the treatment landscape and dramatically improved patient outcomes in multiple advanced cancers [Citation2]. Unfortunately, only a proportion of patients durably respond to ICB treatment, and clinical evidence suggests that inflamed tumor microenvironment (TME) is related to a better response [Citation3–5]. In addition, it is widely believed that we need a variety of therapeutics for each cancer type due to the diversity in different cancer types. The fact that one treatment strategy appears to be promising for treating multiple cancer types is quite exciting. As a well-studied pathway, TGFβ signaling plays essential roles in carcinomas and their TME [Citation6,Citation7]. It not only promotes cancer progression through shaping tumor cell architecture but also generates an immunosuppressive TME by inhibiting the anti-tumor immune responses of immune cells. It exerts profound immunosuppressive activities on key cell types implicated in innate and adaptive immunity, such as T cell, B cell, NK cell, macrophage, neutrophil, and so on [Citation7]. Some studies have reported that the presence of TGFβ in TME was related to immune-cold tumors and lack of response to anti-PD-L1 therapy in tumors [Citation8,Citation9]. All the evidence indicates that in combination with TGFβ inhibition is likely to be a promising therapeutic strategy to enhance the efficacy of ICB through transforming non-inflamed to inflamed tumors, and its role is currently being evaluated in multiple clinical trials [Citation10]. Among them, bintrafusp alfa (M7824) stands out as a first-in-class bifunctional drug simultaneously targeting PD-L1 and TGFβ, and encouraging clinical activity has been exhibited in phase I trials in some cancer types, especially HPV-positive tumors [Citation11,Citation12]. However, clinical trials about M7824 at later stages have failed one after another in several tumors, such as non-small cell lung cancer, microsatellite instability high (MSI-H) solid tumors, and biliary tract cancer. These results appear to contradict several preclinical findings regarding improved ICB treatment efficacy by TGFβ inhibition.
TGFβ is released and activated by cancer and non-cancer cells within the TME and shapes the TME via affecting cancer-associated fibroblasts and endothelial cells, modifying tumor architecture, and suppressing protective immune cell functions [Citation7,Citation13]. Some studies have reported that TGFβ functioned as a master immune regulator in the maintenance of an immunosuppressive TME and had a positive correlation with immune-excluded or -cold tumors [Citation8,Citation9]. However, there existed some limitations, including inadequate markers used for estimation of pathway activation and TME classification, single omics data analyzed, and limited number of cancer types. In this study, we performed a pan-cancer analysis comparing the activation of TGFβ pathway among different TMEs based on multi-omics data, including transcriptome, proteome, and phosphoproteome. Additionally, as a predominant pathway in triggering the endothelial-mesenchymal transition (EMT), relevant downstream protein products were taken as markers of pathway activation [Citation14,Citation15]. Considering the combination treatment strategy, we analyzed the relationship between TGFβ activation and reliable biomarkers that could predict the efficacy of ICB therapy, including tumor mutation burden (TMB), microsatellite instability (MSI), neoantigen load, and immune checkpoints (e.g. PD-L1, PD-1, CTLA-4) [Citation16–19]. Moreover, a higher response rate of M7824 was reported in HPV-positive patients in comparison with HPV-negative patients in phase I trials [Citation11], which highlighted the need for further investigation to clarify the role of HPV infection and its correlation with TGFβ pathway activity. We believe that the underlying reasons for the inconsistency between preclinical and clinical research have important guiding significance in optimizing future clinical trial design and enhancing the potential success of the trial.
Methods
Tumor datasets
Public gene expression data, somatic mutations, copy number alterations (CNAs), and corresponding clinical information of pan-cancer cohort were downloaded from The Cancer Genome Atlas (TCGA) dataset (https://portal.gdc.cancer.gov/). Due to certain tumor cells characterized by high intrinsic immune cell transcript, three cancer types (diffuse large B-cell lymphoma, acute myeloid leukemia, and thymoma) were excluded from the cohort. A total of 31 solid tumors from TCGA, including both primary and metastatic melanoma and other 29 primary tumors, were enrolled for further analysis. To compare gene expression among different tumors, the raw read counts were log2 transformed following upper-quantile normalization across all samples. For mutation data, silent mutations were filtered and not included in further analysis. For CNAs, gene-level thresholded GISTIC2-processed copy number data were utilized [Citation20]. Based on the yield value of each gene, tumor samples were divided into CN gain (+2, +1), CN normal (0), and CN loss (−1, −2) group. Additionally, the thresholded values, −2 and 2, represented high-level CN gain and loss, respectively. Protein levels of e-cadherin and PD-L1 in TCGA patients were available at The Cancer Proteome Atlas (TCPA) (https://tcpaportal.org/tcpa/) using reverse phase protein array (RPPA). Six immune cell populations in TCGA patients were evaluated based on the Tumor Immune Estimation Resource (http://cistrome.dfci.harvard.edu/TIMER/). For the proteomic analysis, we selected two datasets (head and neck squamous cell carcinoma, CPTAC-HNSC; pancreatic ductal adenocarcinoma, CPTAC-PDAC) with both phosphoproteome and proteome data from the clinical proteomic tumor analysis consortium (CPTAC) (https://cptac-data-portal.georgetown.edu/). Additionally, two datasets from GEO, GSE14330 and GSE7568, were used to identify the effects of TGFβ on T cells and macrophages, respectively, and to construct the response signature (Table S1). Human peripheral blood mononuclear cells were used as a source of T cells and macrophages. After a systematic search for ICB trials with available gene expression data and therapy response, two cohorts were enrolled in this study: anti-PD-L1-treated urothelial cancer (Imvigor210 cohort) [Citation21] and anti-PD1-treated melanoma (GSE91061). To assess the TGFβ pathway activation differences between HPV-positive and -negative patients, one dataset from GEO, GSE40774, including transcriptome data and HPV status information, was utilized.
Identification of the immune phenotypes among pan-cancer patients
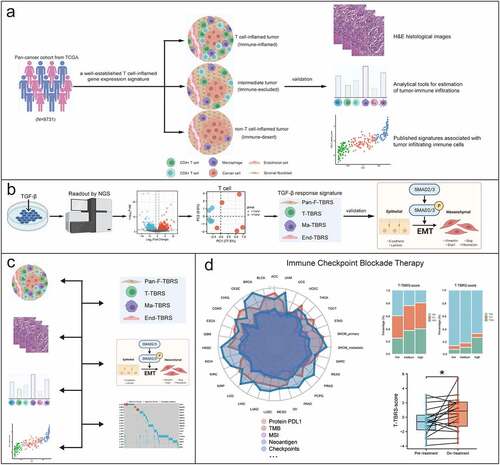
As illustrated in ), to categorize the tumor samples in our cohort into T-cell-inflamed tumor (“hot tumor”), intermediate tumor, and non-T-cell-inflamed tumor (“cold tumor”), we used a well-established T-cell-inflamed gene signature constructed by Thomas et al. [Citation22]. It consists of 160 genes that consistently coclustered with the 13 T-cell associated genes (also known as “concordant gene list”). Briefly, we applied a quantitative score system based on the expression values of 160 genes (details in Table S2) for categorization. Firstly, each gene expression value was converted as μi±βiσi (i = 1,2, … 160), where μ and σ were the mean and standard deviation of the ith gene expression value across all tumor samples, and β was equal to the z-score value, representing the number of standard deviation ith gene’s expression is separated from the mean. The threshold for T-cell-inflamed and non-T-cell-inflamed tumor (β0) was set as 0.1 in this system. For each gene, if its coefficient βi > β0, then this gene was classified as “up-regulated” in this sample and assigned a score of +1; similarly, if βi < -β0, it was classified as “down-regulated” and assigned score −1; otherwise, it was classified as “unchanged” and assigned score 0. Next, the total sums for scores of 160 genes, ranging from −160 (all genes were down-regulated) to +160 (all genes were up-regulated), were calculated in each sample. For each tumor sample, its sum score < −80 was grouped as non-T-cell-inflamed, >80 as T-cell-inflamed and the rest as intermediate. Also, we compared this signature with two publicly available gene sets, CD8 T-effector signature [Citation23,Citation24] and cytolytic activity [Citation25], which were closely related to immune cell infiltration in tumor microenvironment. Briefly, CD8 T-effector signature contained eight genes (CD8A, CXCL10, CXCL9, GZMA, GZMB, IFNG, PRF1, TBX21), and the first principal component was extracted to act as signature score. Cytolytic activity was determined by the geometric mean of the gene expression of two cytolytic markers. The relationship between this signature and six immune cell populations (B cell, CD4 + T cell, CD8 + T cell, neutrophil, macrophage, and myeloid dendritic cell) was explored. Moreover, randomly selected H&E staining images per immune phenotype from TCGA pan-cancer cohort were reviewed using the Cancer Digital Slide Archive (http://cancer.digitalslidearchive.net) for validation at tissue levels. The images were analyzed by a histopathologist (HJ.Z) and validated by another histopathologist (G.C) (Sample ID listed in Table S3).
Figure 1. Flow diagram of the study procedure. a) Identification and validation of the immune phenotypes among 31 cancer types. b) Generation and validation of TGFβ response signature (TBRS) in four cell types: fibroblast, T cell, macrophage, and endothelial cell. c) Multilevel comparisons of TGFβ pathway activation level among different immune phenotypes. d) The relationship between TGFβ signaling and immune checkpoint blockade therapy.
Generation and score computation of TGFβ response signature for four cell types
To reflect TGFβ pathway activity in tumor microenvironment, we generated four TGFβ response signatures (TBRS) to measure pathway activity in four cell types, including T cell, macrophage, fibroblast, and endothelial cell. To identify TGFβ-induced genes in T cells and macrophages, RNAseq transcriptome analysis was performed after treatment with (1) TGFβ1 or (2) control. The TBRS in T-cells (T-cell-TBRS) and macrophages (Macrophage-TBRS) were determined using the following criteria: (1) at least twofold higher expression change in TGFβ-treated group compared with the control; (2) at least 0.8 Spearman-rank correlation with the first principal component (PC1) of signature genes. The pan-fibroblast-TBRS (Pan-Fibroblast-TBRS) and endothelial cell-specific TBRS (Endothelial-TBRS) were adopted [Citation21,Citation26] (19 and 263 genes, respectively). To compute the signature score, we first converted the expression of each gene in the signature to a z-score. Then, a principal component analysis was conducted, and PC1 was extracted to act as signature score. In addition, we compared the correlation between TBRS score and phosphorylation level of SMAD2 and protein level of EMT biomarkers, including cell-surface proteins, cytoskeletal markers, ECM proteins, and transcription factors, to assess the efficacy of TBRS ()).
Association between TGFβ pathway activation and immune checkpoint blockade therapy
Multilevel comparisons of TGFβ pathway activation level among different immune phenotypes, involving transcriptome, proteome, immune cells, and downstream products, were performed ()). The relationships between TBRS score in four cell types and potential biomarkers reported to predict the response to immunotherapy, including TMB, MSI, neoantigen load, and immune checkpoints (e.g. PD-L1, PD-1, CTLA-4), were examined in 31 solid tumors ()). Additionally, protein PD-L1 expressions obtained from Imvigor210 cohort on tumor cells (TC) and tumor-infiltrating immune cells (IC), including macrophages, dendritic cells, and lymphocytes, were explored. Differences in TBRS score in four cell types were compared among the following three groups: progressive disease (PD), stable disease (SD), and complete/partial response (CR/PR). The changes in tumor immune microenvironment and TBRS score before and during immunotherapy were evaluated. Moreover, a comparison of T-cell-TBRS scores between HPV-positive and -negative groups was conducted.
Statistical analysis
Comparisons between continuous variables were performed using Student t-test or one-way ANOVA test. Paired data were analyzed by paired t-test. Categorical variables were compared by chi-square or Fisher's exact test. Correlation analysis was performed with the Spearman correlation method. Gene differential expression analysis was performed using the edgeR R package. The principal component analysis was performed using the prcomp R package. All statistics were conducted using IBM SPSS Statistics 26.0 and R software 4.0.2. For all statistical tests P < 0.05 was considered significant.
Results
Categorization of tumor samples into different immune phenotypes in 31 solid tumors
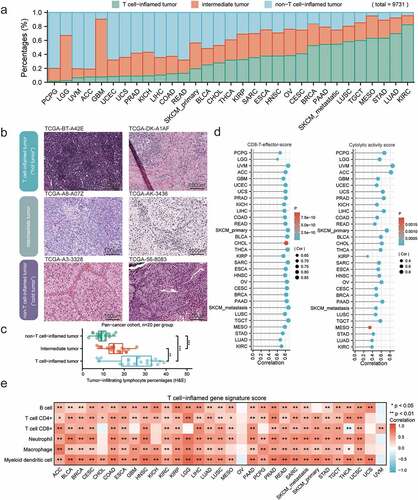
Based on the 160-gene T-cell-inflamed gene signature [Citation22], tumor samples were separated into T-cell-inflamed, intermediate, and non-T-cell-inflamed tumor microenvironment phenotypes. Among the total 9731 samples, 3534 (36.3%) patients were of the T-cell-inflamed phenotype, 2889 (29.7%) were intermediate, and 3308 (34.0%) were non-T-cell-inflamed. We ranked 31 solid tumors by the fraction of samples displaying T-cell-inflamed TME per cancer type ()). Kidney renal clear cell carcinoma (KIRC), lung adenocarcinoma (LUAD), and stomach adenocarcinoma (STAD) exhibited the highest proportion of T-cell-inflamed samples, while pheochromocytoma and paraganglioma (PCPG), brain lower grade glioma (LGG), and uveal melanoma (UVM) showed the lowest proportions. To validate the immune phenotype histologically, the representative tumor specimens in each phenotype from pan-cancer cohort (n = 60) were analyzed ()). Indeed, in comparison with non-T-cell-inflamed phenotype, significantly increased tumor-infiltrating lymphocyte percentages were observed in T-cell-inflamed and intermediate tumor samples ()). Additionally, this signature had relatively high positive correlations with both CD8 T-effector score [Citation23,Citation24] and cytolytic activity score [Citation25] in all cancer types ()). A similar trend of positive correlation between the signature score and six immune cell types, including B cell, CD4 + T cell, CD8 + T cell, neutrophil, macrophage, and myeloid dendritic cell, was observed in most cancer types, except for ovarian serous cystadenocarcinoma and uveal melanoma ()).
Figure 2. Immune phenotype classifications across 31 human solid tumors. a) The fraction of T-cell-inflamed (green), intermediate (orange), and non-T-cell-inflamed (blue) tumors in each cancer type, sorted by the fraction of T-cell-inflamed tumor (low to high). b) Representative TCGA H&E histological images of three immune phenotypes: T-cell-inflamed (“hot tumor”), intermediate, and non-T-cell-inflamed (“cold tumor”). c) Box plots showing percentages of tumor-infiltrating lymphocytes as determine by a pathologist in each immune phenotype (n = 20 per group). Boxplot center line and bounds of box represent median and interquartile range, respectively. d) Lollipop plots showing the correlation between T-cell-inflamed gene signature score and CD8 T effector score (left) and cytolytic activity score (right). e) Correlation heatmap showing strong positive correlations with immune cells in most cancer types. Spearman correlation coefficient and corresponding P value indicated beside plot. Sample size, exact coefficient and P value given in Supplementary table.
Well-established signatures reflecting TGFβ pathway activity status in non-cancer cells within the TME
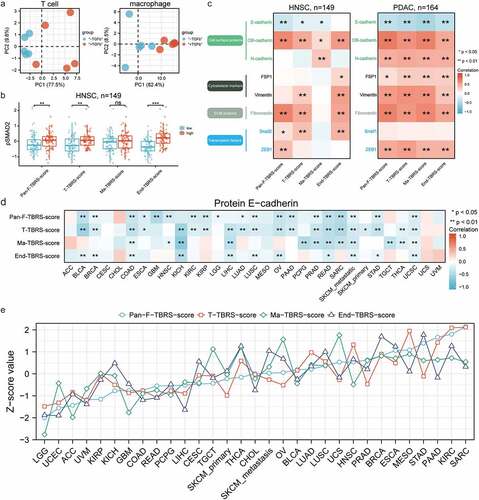
Eventually, four signatures (Pan-Fibroblast-TBRS, T-cell-TBRS, Macrophage-TBRS, and Endothelial-TBRS) were constructed comprising 19, 28, 87, and 263 genes, respectively (Supplementary materials). As shown in ), higher PC1 appeared in T cells and macrophages after treatment with TGFβ. Phosphorylated smad2 (pSMAD2), a reliable marker of TGFβ pathway activation, significantly increased in high score group of Pan-Fibroblast-TBRS, T-cell-TBRS, and Endothelial-TBRS, while not Macrophage-TBRS ()). Moreover, a similar trend of positive correlation between 4 TBRS scores and the EMT process was revealed in HNSC and PDAC ()). In terms of cell-surface proteins, TBRS scores exhibited a significant positive correlation with both OB-cadherin and N-cadherin, while a negative correlation with E-cadherin. Elevated cytoskeletal markers (including FSP1 and vimentin), ECM proteins (including fibronectin), and transcription factors (including ZEB1 and snail2) were associated with high TBRS scores. Similar results were obtained about the negative relationship between E-cadherin and TBRS scores, especially T-cell-TBRS score, when extending our analysis to the pan-cancer cohort ()). Above evidence proved that these signatures had the ability to reflect the activation status of TGFβ pathway. We ranked 31 solid tumors based on Pan-Fibroblast-TBRS score and observed a similar trend for z-scores of four signatures, indicating generally concordant TGFβ pathway activity among non-cancer cells within the TME ()). Compared with certain cancer types with low TBRS scores, such as brain lower grade glioma and uterine corpus endometrial carcinoma, high levels of TGFβ pathway activation existed in high-score cancer types, such as sarcoma and kidney renal clear cell carcinoma.
Figure 3. Well-established signatures reflecting TGFβ signaling activity in non-cancer types within the TME. a) PCA plots showing dispersion in T cell (left) treated with or without TGFβ1 and macrophage (right). Each dot represents a replicate. b) Box plots illustrating the comparisons of pSMAD2 expression between the low- and high-TBRS score group in HNSC. The center line and bounds of box represent median and interquartile range, respectively. c) Correlation heatmaps showing correlations between TBRS score and protein level of EMT biomarkers in HNSC (left) and PDAC (right). d) Pan-cancer analysis of correlation between T-cell-TBRS score and protein E-cadherin level. e) Landscape of TGFβ signaling activity in non-cancer cells within TME across 31 solid tumors, ranked by the Z-score value of Pan-Fibroblast-TBRS score from low to high. Spearman correlation coefficient and corresponding P value indicated beside plot. Sample size, exact coefficient and P value given in Supplementary table. TBRS, TGFβ response signature; HNSC, head and neck squamous cell carcinoma; PDAC, pancreatic ductal adenocarcinoma; ECM, extracellular matrix; EMT, endothelial–mesenchymal transition.
Activation of TGFβ pathway positively correlating with the T-cell-inflamed TME
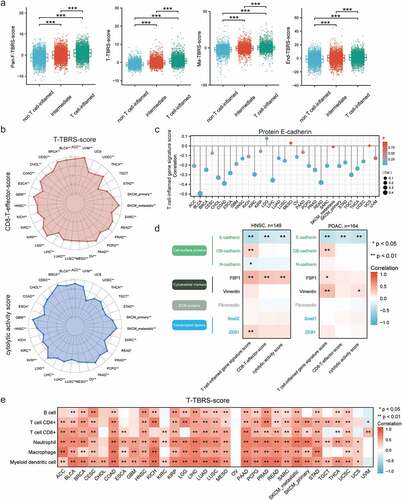
Given that pathway activity status was essential to the efficacy of pathway inhibition therapy, we compared TGFβ pathway activation levels in fibroblasts, T cells, macrophages, and endothelial cells among three immune phenotypes: T-cell-inflamed, intermediate, and non-T-cell-inflamed. Firstly, at the transcription level, Pan-Fibroblast-TBRS score was low in non-T-cell-inflamed but significantly higher in intermediate and T-cell-inflamed tumors ()). Regarding immune cells, significant positive correlations existed not only between T-cell-inflamed gene signature and TBRS score in T cells but also between T-cell-inflamed gene signature and TBRS score in macrophages. Similarly, high TGFβ pathway activity in endothelial cells was observed in T-cell-inflamed in comparison with non-T-cell-inflamed and intermediate tumors. TBRS scores in four non-cancer cell types, especially T cells, showed obvious positive correlations with CD8 T-effector score and cytolytic activity score in almost all solid tumors (), Figure S1). Next, we analyzed the differences in EMT-related markers at the protein level. We found that E-cadherin was inversely correlated with T-cell-inflamed gene signature, CD8 T-effector score, and cytolytic activity score in more than half of the cancer types (), Figure S2). Besides E-cadherin, others markers, such as OB-cadherin, FSP, and vimentin, showed positive relationships with T-cell-inflamed gene signature, CD8 T-effector score, or cytolytic activity score in HNSC and PDAC ()). Lastly, significant positive correlations existed between abundance of immune cells (B cell, CD4 + T cell, CD8 + T cell, neutrophil, macrophage, and myeloid dendritic cell) and TBRS scores in four non-cancer cell types, especially T cells (), Figure S3).
Figure 4. TGFβ signaling activation in T-cell-inflamed TME. a) Box plots showing comparisons of Pan-Fibroblast-TBRS score, T-cell-TBRS score, Macrophage-TBRS score, and Endothelial-TBRS score among three immune phenotypes. The center line and bounds of box represent median and interquartile range, respectively. b) Radar plots of relationships between T-cell-TBRS score and CD8 T-effector score (upper) and cytolytic activity score (lower). c) Lollipop plots showing the correlation between T-cell-inflamed gene signature score and protein E-cadherin level. d) Correlation heatmaps illustrating correlations between protein level of EMT biomarkers and immune-related signatures in HNSC (left) and PDAC (right). e) Pan-cancer analysis of correlation between T-cell-TBRS score and six immune cell types. Spearman correlation coefficient and corresponding P value indicated beside plot. Sample size, exact coefficient and P value given in Supplementary table. HNSC, head and neck squamous cell carcinoma; PDAC, pancreatic ductal adenocarcinoma; ECM, extracellular matrix.
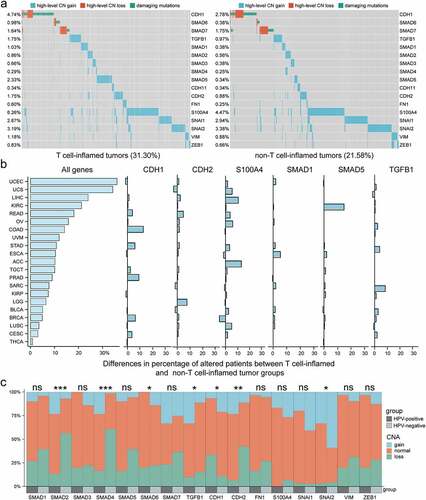
Non-silent mutations and CNAs of activation markers in TGFβ signaling, including TGFB1, Smad family members (SMAD1-7), and EMT markers (CDH1, CDH2, CDH11, FN1, S100A4, SNAI1, SNAI2, VIM, and ZEB1) were analyzed. For CDH1 and inhibitory Smads (SMAD6 and SMD7), both high-level CN loss and damaging mutations such as missense mutation, frameshift/non-frameshift insertions and deletions were included. For other activation markers, high-level CN gain was included for analysis. We found that the damaging mutations and high-level CNAs were mostly not overlapping, and the top six genes with the largest differences in the percentage of these changes between T-cell-inflamed and non-T-cell-inflamed group were CDH1, CDH2, S100A4, SMAD1, SMAD5, and TGFB1 (), Figure S4). Taken as a whole, a higher percentage of samples harboring high-level CNAs and damaging mutations was observed in T-cell-inflamed group (31.30%) compared with non-T-cell-inflamed group (21.58%). Concerning individual tumors, 21 of 31 cancer types (67.7%) exhibited a higher fraction of damaging mutations, high-level CNAs, or both in T-cell-inflamed compared with non-T-cell-inflamed tumors ()). Moreover, given the different anti-TGFβ treatment efficacy between HPV-positive and -negative status, we made comparisons of somatic CNAs in HNSC, and observed significantly higher ratios of CN gain and lower ratios of CN loss in SMAD2 (P < 0.001), SMAD4 (P < 0.001), TGFB1 (P < 0.05), CDH2 (P < 0.01), and SNAI2 (P < 0.05) in HPV-positive compared with HPV-negative patients, whereas the opposite results in SMAD6 (P < 0.05) and CDH1 (P < 0.05) ()).
Figure 5. Somatic mutation and CNA profile in TGFβ pathway in different immune phenotypes and HPV statuses. a) Landscape of CN loss and damaging mutation in CDH1, SMAD6, and SMAD7, and CN gain in other activation markers across T-cell-inflamed (left) and non-T-cell-inflamed (right) tumors. The percentage of samples harboring mutations and CNAs in each gene are shown on the left side. b) Histograms showing difference in percentage of altered patients (mutations or CNAs in above-mentioned genes) between T-cell-inflamed and non-T-cell-inflamed group per cancer type. A total of 21 cancer types with higher percentage of altered patients in T-cell-inflamed than non-T-cell-inflamed group are shown from high to low percentages (top to bottom). c) Bar graphs showing the differences in the percentage of CN gain, normal and loss in each gene between HPV-positive and -negative status. CNA, copy number alteration. *P < 0.05, **P < 0.01, ***P < 0.001.
Roles of TGFβ pathway activity in ICB therapy
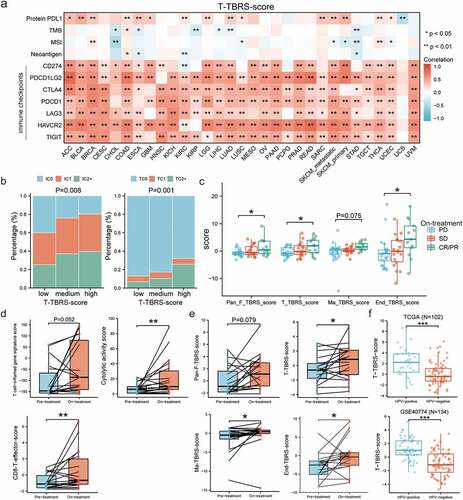
To figure out whether the addition of TGFβ inhibition improved the efficacy of ICB therapy, we first analyzed the relationship between TGFβ pathway activity within TME and significant biomarkers for immunotherapy, including protein PD-L1, TMB, MSI, neoantigen, and immune checkpoints. In most solid tumors, high levels of PD-L1 protein and mRNA were observed in tumor tissues with high TBRS score in non-cancer cells within TME, especially in T cells (), Figure S5). In Imvigor210 cohort with urothelial cancer, specimens in which the proportion of PD-L1 positive immune cells was <1%, ≥1% but <5%, or ≥5% were labeled “IC0”, “IC1”, and “IC2+”, respectively, and it was the same with tumor cells (“TC0”, “TC1”, and “TC2+”, respectively). Compared with medium T-cell-TBRS score, significant lower proportion of IC2+ and TC2+ was observed in the low-score group, while specimens with high score exhibited higher IC2+ and TC2+ proportions (P = 0.008 and P = 0.001, respectively) ()). However, no significant differences in the proportion of PD-L1 positive immune cells and tumor cells existed among low-, moderate-, and high-score groups for Pan-Fibroblast-TBRS, as well as Macrophage-TBRS and Endothelial-TBRS (Figure S6). In addition to PD-L1, there were obvious positive correlations between TBRS score in T cells and other immune checkpoints, including PDCD1, CTLA4, PDCD1LG2, LAG3, HAVCR2, and TIGIT, in the majority of cancer types ()). Compared with T cells, the associations were smaller but significant in fibroblasts, macrophages, and endothelial cells (Figure S5). As for TMB, MSI, and neoantigen, the significant relationships with TBRS score in four cell types appeared in only a few cancer types and varied among them, with some cancers showing a negative correlation (e.g. CHOL, STAD) and others a positive correlation (e.g. COAD, LGG) (), Figure S5). In advanced melanoma cohort (GSE91061), variable TGFβ signaling activities were observed in 33 ipilimumab-naive patients after treatment with anti-PD-1 agent Nivolumab. Compared with SD, patients who achieved a CR/PR had significantly higher TBRS scores in fibroblast, T cell, and endothelial cell, while lower TBRS scores in PD subgroup ()). TGFβ signaling in macrophages showed a similar, but not significant, trend. Moreover, T-cell-inflamed gene signature score after treatment was higher than that before treatment, but the difference was not statistically significant. CD8 T-effector score and cytolytic activity score increased significantly after anti-PD-1 therapy ()). Significantly increased TGFβ signaling activities after treatment were shown in T cell, macrophage, and endothelial cell, except for a slight but non-significant (P = 0.079) increase in fibroblast ()). To clarify the role of HPV infection as a potential biomarker of response to anti-TGFβ treatment, we compared the TGFβ signaling differences between HPV-positive and -negative patients, and observed an increased signaling in the former in both TCGA (n = 102) (P < 0.001) and GSE40774 (n = 134) (P < 0.001) cohort.
Figure 6. Synergistic roles of anti-TGFβ in ICB immunotherapy. a) Pan-cancer analysis of correlation between T-cell-TBRS score and the predictive biomarkers for ICB therapy, including TMB, MSI, neoantigen load, and immune checkpoints (e.g. PD-L1, PD-1, CTLA-4). b) Bar graphs showing the differences in the percentage of PD-L1 positive immune cells (left) and tumor cells (right) among low-, medium-, and high-T-cell-TBRS score group. IC0, TC0: <1%; IC1, TC1: ≥1% but <5%; IC2+, TC2+: ≥5%. c) Box plots indicating comparisons of TBRS scores among different anti-PD-1 responses: CR/PR, SD, and PD. The center line and bounds of box represent median and interquartile range, respectively. d) Differences in immune-related signatures before and after anti-PD-1 treatment. e) Scatter plots showing effects of anti-PD-1 therapy on TGFβ signaling activity in non-cancer cells within the TME. f Comparisons of T-cell-TBRS score between HPV-positive and HPV-negative samples in TCGA and GSE40774. Spearman correlation coefficient and corresponding P value indicated beside plot. Sample size, exact coefficient and P value given in Supplementary table. TMB, Tumor mutation burden; MSI, microsatellite instability; IC, immune cell; TC, tumor cell; CR/PR, complete response/partial response; SD, stable disease; PD, progressive disease. *P < 0.05, **P < 0.01, ***P < 0.001.
Discussion
TGFβ, a multifunctional cytokine, exerts direct and profound effects on most cells present in the TME. It can suppress tumor growth during the early stages of tumorigenesis, while its tumor-promoting functions on tumor cell architecture remodeling and cancer immune evasion have emerged as the tumor progresses [Citation6,Citation27–29]. In light of the determining effect of TGFβ signaling in the TME on cancer progression and immunosuppression, several therapeutic approaches targeting TGFβ signaling have been developed and classified into four main classes, including small-molecule inhibitors, antibodies, ligand traps, and inhibitors of TGFβ activation [Citation10]. In addition to single-agent TGFβ inhibition, combination therapy is another important category of therapeutics in clinical trials, consisting of chemotherapy, radiotherapy, and immunotherapy, especially ICBs. The promising results have emerged in preclinical studies, and multiple clinical trials are currently ongoing to evaluate the efficacy of these therapeutic strategies. Among them, M7824, a first-in-class bispecific antibody dual targeting PD-L1 and TGFβ, has been paid much attention in recent years and indeed shows satisfactory efficacy at the early stage. However, successive failures are encountered in phase II/III clinical trials on lung cancer, MSI-H solid tumors, and biliary tract cancer, which would challenge the synergistic role of TGFβ signaling inhibition in immunotherapy. Therefore, we conduct this study to provide a much better understanding of TGFβ signaling in the TME and its relation to the individual immunological status, which has guiding significance in explaining the inconsistent results between preclinical studies and clinical trials and stratifying patients to enhance the potential success of the trial.
Though TGFβ is confirmed to play immunosuppressive roles in TME, the differences in the level of pathway activation among different immunophenotypes are still not fully understood. Some studies have reported that the presence of TGFβ in the TME was associated with “cold” tumors [Citation8,Citation9], but in our opinion, only the level of TGFβ expression cannot fully reflect the pathway activation levels, let alone activation levels in specific cell types in the TME. The production and activation of TGFβ are conducted by a variety of tightly regulated processes [Citation7,Citation30]. In short, the bioactive TGFβ precursor is produced and linked to “latency-associated peptide” (LAP), forming latent TGFβ complexes. To release the active TGFβ from this complex, non-covalent association of the TGFβ prosegment through an Arg-Gly-Asp (RDG) motif with one of several integrin β-chains on the surface of highly contractile cells such as cancer cells, myeloid cells, and myofibroblasts is required [Citation31–33]. Active TGFβ binds heteromeric complexes of type I TGFβ receptor (TGFBR1) and TGFBR2 to initiate the signaling that consists of a canonical Smad pathway and Smad-independent non-canonical pathway. Therefore, compared with TGFβ itself, the roles of the key mediators in the pathway (e.g. pSMAD2/3) and the pathway-associated biological processes (e.g. EMT) in reflecting pathway activity are more convincing [Citation34,Citation35]. Based on differentially expressed genes between cells with or without TGFβ1, we constructed response signatures in fibroblasts, T cells, macrophages, and endothelial cells, and observed a positive correlation with pSMAD2 and EMT biomarkers, indicating signatures with satisfactory performance. It is worth noting that generally concordant TGFβ pathway activities exist among non-cancer cells within the TME. In addition, different from previous studies, several approaches were adopted for the immune status estimation within the TME to increase reliability, including well-established signatures, histological analyses, and bioinformatics tools, and yielded consistent results.
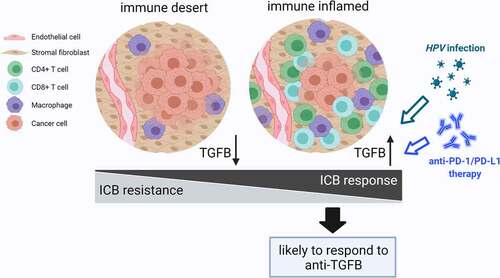
In preclinical studies, inhibition of TGFβ signaling played a vital role in transforming “cold” tumor into “hot” tumor and enhanced responsiveness to ICB therapy. Based on our results, overactive TGFβ signaling appears in T-cell-inflamed instead of non-T-cell-inflamed microenvironment. Consistently, an obvious positive correlation is observed between the proportion of various immune cells and TGFβ signaling activity in non-cancer cells within the TME, which seems to contradict the role of TGFβ in the maintenance of an immunosuppressive TME. In addition, analyses of non-silent mutations and CNAs in TGFβ signaling elements provided further evidence of TGFβ pathway activation in T-cell-inflamed group compared with non-T-cell-inflamed group in 21 cancer types. We think a plausible explanation for this phenomenon is that the production and activation of TGFβ in “hot” tumors is a passive and defensive process of tumor cells to evade immune surveillance and escape attacks. In addition, increased immune cells participating in TGFβ activation (e.g. myeloid cells) tend to promote this process to keep immunological balance. For the low TGFβ signaling activity in “cold” tumors, the following two reasons may include: reduced need for passive defense in tumor cells and impaired ability for activation in decreased immune cells. In a word, TGFβ signaling cannot determine the immune status as a master regulator but rather change with the immune microenvironment. Remarkably, TGFβ signaling activity is tightly correlated with PD-L1. As an inhibitory immune checkpoint, PD-L1 plays an important role in tumor immune escape as well, and shows a significant higher level in immune-inflamed microenvironment [Citation36]. EMT conferred increased cancer cell expression of PD-L1 in response to TGFβ signaling in some tumors [Citation28,Citation37,Citation38]. In terms of therapeutic efficacy, anti-PD-L1/anti-PD-1 treatment enhances the anti-tumor effect of TGFβ inhibition in basic research and vice versa [Citation21,Citation39,Citation40]. In our study, patients with better anti-PD-1 response had higher TBRS scores during immunotherapy. Anti-PD-1 treatment significantly increased TGFβ signaling activity in non-cancer cells within the TME. All these observations strengthen the rationale for anti-TGFβ and anti-PD-L1/PD-1 combination. Targeting the increased TGFβ activity in anti-PD-1 treated patients with anti-TGFβ treatment could further enhance the anti-tumoral effect. In addition, we found that TGFβ response signatures in 4 non-cancer cell types were all positively correlated with PD-L1 expression in most cancer types, and patients with high TBRS score showed relatively high proportions of PD-L1 positive tumor cells and immune cells. It is highly probable that both anti-TGFβ and anti-PD-L1/PD-1 are more effective in the inflamed tumors and the beneficiary groups of both therapies are significantly overlapped. Considering the low TGFβ pathway activity in non-T-cell-inflamed tumors, anti-TGFβ may enhance the efficacy of anti-PD-L1/PD1 to some extent; however, completely converting “cold” into “hot” tumors and significantly expanding the beneficiary population seem difficult to achieve. This finding helps to explain the successive failures of M7824 in phase II/III clinical trials. In early phase I clinical trials, high response rate appeared in high PD-L1 expression and HPV-positive patients, and the treatment outcomes were better than anti-PD-L1/PD-1 alone [Citation11,Citation41]. In HPV-positive status, we noticed obviously higher ratios of CN gain in SMAD2, SMAD4, TGFB1, CDH2 and CN loss in SAMD6 and CDH1, which inferred TGFβ pathway activation. Moreover, increased TGFβ signaling activities in T cells in HPV-positive patients were observed. In accordance with this result, Wang et al. reported that HPV-positive was associated with inflamed TME and improved response to anti-PD-1 therapy in HNSCC [Citation42]. Similarly, compared with HPV-negative subtype, HPV-positive subtype showed an immune phenotype, characterized by prominent infiltration with CD8+ lymphocytes, as reported by Michaela et al., which provided further evidence for our conclusion [Citation43]. The above evidence supports our opinion that compared with low TGFβ signaling in non-inflamed tumors, combination therapy has more advantages in inflamed tumors, and TBRS scores, especially T-cell-TBRS score, could serve as biomarkers for the ongoing and upcoming clinical trials ().
Figure 7. Schematic diagram of TGFβ signaling activity in tumor immune microenvironment.
We acknowledge some limitations in our study. This current work focused on systematic analysis of the relationship between TGFβ signaling and immune microenvironment in the context of pan-cancer data; however, due to limited data in public database, proteomics, phosphoproteomics, and immunotherapy analyses were conducted in a minority of tumors. Both basic research and prospective clinical research are required to validate the results and reveal the intrinsic mechanism. Another limitation is that, except for M7824, most relevant clinical trials are still ongoing and the therapeutic efficacies are unknown. Despite the failure in M7824, unlike special spatial structure of fusion protein, the efficacy of other treatments inhibiting TGFβ signaling (e.g. small molecules, antibodies) is to be anticipated.
Conclusion
Our study provides a better understanding of TGFβ signaling within TME and its relation to the individual immunological status. Comparisons with immune checkpoints, PD-L1, and HPV status may contribute to explain the variable efficacy of anti-TGFβ in clinical trials. Additionally, signatures are well established to reflect TGFβ signaling activity in four types of non-cancer cells among 31 cancer types, which may serve as reliable personalized predictors of responsiveness to anti-TGFβ immunotherapy.
Authors’ contributions
NH.S. conceived and supervised the project. JD.X, QJ.Z, and JC.L designed and performed the research. QJ.Z and PX.M performed data analysis. HJ.Z and G.C performed histological assessment of the tissue slides. JD.X, QJ.Z, and CJ.J interpreted the results and wrote the manuscript.
Availability of data and materials
All data generated or analyzed during this study are included in the published article, supplementary materials, source data or available from the corresponding author upon reasonable request.
Supplemental Material
Download Zip (1.6 MB)Acknowledgments
This study was funded by Medical Key Talent of Jiangsu Province: ZDRCA2016009 and the National Natural Science Foundation of China (82071638, 81971377).
Disclosure statement
No potential conflict of interest was reported by the author(s).
Supplementary material
Supplemental data for this article can be accessed online at https://doi.org/10.1080/15384101.2022.2109105
Additional information
Funding
Related Research Data
References
- Ribas A, Wolchok JD. Cancer immunotherapy using checkpoint blockade. Science. 2018;359(6382):1350–1355.
- Wieder T, Eigentler T, Brenner E, et al. Immune checkpoint blockade therapy. J Allergy Clin Immunol. 2018;142(5):1403–1414.
- de Miguel M, Calvo E, de Miguel M. Clinical challenges of immune checkpoint inhibitors. Cancer Cell. 2020;38(3):326–333.
- Topalian SL, Hodi FS, Brahmer JR, et al. Safety, activity, and immune correlates of anti-PD-1 antibody in cancer. N Engl J Med. 2012;366(26):2443–2454.
- Ayers M, Lunceford J, Nebozhyn M, et al. IFN-gamma-related mRNA profile predicts clinical response to PD-1 blockade. J Clin Invest. 2017;127(8):2930–2940.
- Batlle E, Massague J. Transforming growth factor-beta signaling in immunity and cancer. Immunity. 2019;50(4):924–940.
- Derynck R, Turley SJ, Akhurst RJ. TGFbeta biology in cancer progression and immunotherapy. Nat Rev Clin Oncol. 2021;18(1):9–34.
- Larson C, Oronsky B, Carter CA, et al. TGF-beta: a master immune regulator. Expert Opin Ther Targets. 2020;24(5):427–438.
- Hammerl D, Martens JWM, Timmermans M, et al. Spatial immunophenotypes predict response to anti-PD1 treatment and capture distinct paths of T cell evasion in triple negative breast cancer. Nat Commun. 2021;12(1):5668.
- Tauriello DVF, Sancho E, Batlle E. Overcoming TGFbeta-mediated immune evasion in cancer. Nat Rev Cancer. 2021;22(1):25–44.
- Ciardiello D, Elez E, Tabernero J, et al. Clinical development of therapies targeting TGFbeta: current knowledge and future perspectives. Ann Oncol. 2020;31(10):1336–1349.
- Lan Y, Zhang D, Xu C, et al. Enhanced preclinical antitumor activity of M7824, a bifunctional fusion protein simultaneously targeting PD-L1 and TGF-beta. Sci Transl Med. 2018;10(424). DOI:10.1126/scitranslmed.aan5488.
- Dahmani A, Delisle JS. TGF-beta in T cell biology: implications for cancer immunotherapy. Cancers (Basel). 2018;10(6):194.
- Xu J, Lamouille S, Derynck R. TGF-beta-induced epithelial to mesenchymal transition. Cell Res. 2009;19(2):156–172.
- Lamouille S, Xu J, Derynck R. Molecular mechanisms of epithelial-mesenchymal transition. Nat Rev Mol Cell Biol. 2014;15(3):178–196.
- Samstein RM, Lee CH, Shoushtari AN, et al. Tumor mutational load predicts survival after immunotherapy across multiple cancer types. Nat Genet. 2019;51(2):202–206.
- Andre T, Shiu KK, Kim TW, et al. Pembrolizumab in microsatellite-instability-high advanced colorectal cancer. N Engl J Med. 2020;383(23):2207–2218.
- Desrichard A, Snyder A, Chan TA. Cancer neoantigens and applications for immunotherapy. Clin Cancer Res. 2016;22(4):807–812.
- Gibney GT, Weiner LM, Atkins MB. Predictive biomarkers for checkpoint inhibitor-based immunotherapy. Lancet Oncol. 2016;17(12):e542–e551.
- Mermel CH, Schumacher SE, Hill B, et al. GISTIC2.0 facilitates sensitive and confident localization of the targets of focal somatic copy-number alteration in human cancers. Genome Biol. 2011;12(4):R41.
- Mariathasan S, Turley SJ, Nickles D, et al. TGFbeta attenuates tumour response to PD-L1 blockade by contributing to exclusion of T cells. Nature. 2018;554(7693):544–548.
- Spranger S, Luke JJ, Bao R, et al. Density of immunogenic antigens does not explain the presence or absence of the T-cell-inflamed tumor microenvironment in melanoma. Proc Natl Acad Sci U S A. 2016;113(48):E7759–E7768.
- Rosenberg JE, Hoffman-Censits J, Powles T, et al. Atezolizumab in patients with locally advanced and metastatic urothelial carcinoma who have progressed following treatment with platinum-based chemotherapy: a single-arm, multicentre, phase 2 trial. Lancet. 2016;387(10031):1909–1920.
- Balar AV, Galsky MD, Rosenberg JE, et al. Atezolizumab as first-line treatment in cisplatin-ineligible patients with locally advanced and metastatic urothelial carcinoma: a single-arm, multicentre, phase 2 trial. Lancet. 2017;389(10064):67–76.
- Rooney MS, Shukla SA, Wu CJ, et al. Molecular and genetic properties of tumors associated with local immune cytolytic activity. Cell. 2015;160(1–2):48–61.
- Wu X, Ma J, Han JD, et al. Distinct regulation of gene expression in human endothelial cells by TGF-beta and its receptors. Microvasc Res. 2006;71(1):12–19.
- David CJ, Massague J. Contextual determinants of TGFbeta action in development, immunity and cancer. Nat Rev Mol Cell Biol. 2018;19(7):419–435.
- Dongre A, Weinberg RA. New insights into the mechanisms of epithelial-mesenchymal transition and implications for cancer. Nat Rev Mol Cell Biol. 2019;20(2):69–84.
- Katsuno Y, Derynck R. Epithelial plasticity, epithelial-mesenchymal transition, and the TGF-beta family. Dev Cell. 2021;56(6):726–746.
- Shi M, Zhu J, Wang R, et al. Latent TGF-beta structure and activation. Nature. 2011;474(7351):343–349.
- Annes JP, Chen Y, Munger JS, et al. Integrin alphaVbeta6-mediated activation of latent TGF-beta requires the latent TGF-beta binding protein-1. J Cell Biol. 2004;165(5):723–734.
- Wipff PJ, Rifkin DB, Meister JJ, et al. Myofibroblast contraction activates latent TGF-beta1 from the extracellular matrix. J Cell Biol. 2007;179(6):1311–1323.
- Lodyga M, Hinz B. TGF-beta1 - A truly transforming growth factor in fibrosis and immunity. Semin Cell Dev Biol. 2020;101:123–139.
- Ahmadi A, Najafi M, Farhood B, et al. Transforming growth factor-beta signaling: tumorigenesis and targeting for cancer therapy. J Cell Physiol. 2019;234(8):12173–12187.
- Schmierer B, Hill CS. TGFbeta-SMAD signal transduction: molecular specificity and functional flexibility. Nat Rev Mol Cell Biol. 2007;8(12):970–982.
- Ott PA, Bang YJ, Piha-Paul SA, et al. T-cell-inflamed gene-expression profile, programmed death ligand 1 expression, and tumor mutational burden predict efficacy in patients treated with pembrolizumab across 20 cancers: KEYNOTE-028. J Clin Oncol. 2019;37(4):318–327.
- Noman MZ, Janji B, Abdou A, et al. The immune checkpoint ligand PD-L1 is upregulated in EMT-activated human breast cancer cells by a mechanism involving ZEB-1 and miR-200. Oncoimmunology. 2017;6(1):e1263412.
- Lequeux A, Noman MZ, Xiao M, et al. Impact of hypoxic tumor microenvironment and tumor cell plasticity on the expression of immune checkpoints. Cancer Lett. 2019;458:13–20.
- Tauriello DVF, Palomo-Ponce S, Stork D, et al. TGFbeta drives immune evasion in genetically reconstituted colon cancer metastasis. Nature. 2018;554(7693):538–543.
- Dodagatta-Marri E, Meyer DS, Reeves MQ, et al. alpha-PD-1 therapy elevates Treg/Th balance and increases tumor cell pSmad3 that are both targeted by alpha-TGFbeta antibody to promote durable rejection and immunity in squamous cell carcinomas. J Immunother Cancer. 2019;7(1):62.
- Ferris RL, Spanos WC, Leidner R, et al. Neoadjuvant nivolumab for patients with resectable HPV-positive and HPV-negative squamous cell carcinomas of the head and neck in the CheckMate 358 trial. J Immunother Cancer. 2021;9(6):e002568.
- Wang J, Sun H, Zeng Q, et al. HPV-positive status associated with inflamed immune microenvironment and improved response to anti-PD-1 therapy in head and neck squamous cell carcinoma. Sci Rep. 2019;9(1):13404.
- Keck MK, Zuo Z, Khattri A, et al. Integrative analysis of head and neck cancer identifies two biologically distinct HPV and three non-HPV subtypes. Clin Cancer Res. 2015;21(4):870–881.