
ABSTRACT
Emerging evidence indicated circadian clock gene Rev-erbα was involved in cartilage metabolism, however the contribution of Rev-erbα to growth plate chondrogenesis remains unknown. Here, we found that Rev-erbα exhibited the spatiotemporal expression model in growth plate. Moreover, Rev-erbα antagonist SR8278 inhibited longitudinal elongation of metatarsal bone ex vivo. And morphological analysis exhibited SR8278 led to the reduced height of growth plate and hypertrophic zone. Furthermore, blocking Rev-erbα suppressed the proliferation and hypertrophic differentiation of chondrocytes in growth plate. Similarly, knock-down Rev-erbα inhibited the proliferation and differentiation of primary chondrocytes in vitro. The mechanistic study indicated that knock-down Rev-erbα up-regulated MAPK-ERK1/2 pathway in chondrocytes. However, restraint of MAPK-ERK1/2 pathway alleviated partially SR8278-inhibited longitudinal elongation of metatarsal bone and growth plate development. Therefore, our results provide evidence of the vital role of Rev-erbα on growth plate chondrogenesis.
Introduction
In the mammal, most of the bones are formed by the complex process of endochondral ossification, in which cartilage is formed and then remodeled into bone. And growth plate, the development center of endochondral ossification, is essential for longitudinal bone growth. Chondrogenesis of growth plate is initiated when mesenchymal cells condense, and differentiates into proliferative chondrocytes expressed Col2a1 and Aggrecan. After that, chondrocytes undergo hypertrophy and express Col10a1, Mmp13 and VEGF. Further, chondrocytes apoptosis is accompanied by vascular invasion and osteoblasts migrate into the cartilage. Finally, cartilage is replaced by bone tissue [Citation1,Citation2]. The growth plate was functionally divided into the resting zone, proliferative zone, Prehypertrophic zone, and hypertrophic zone [Citation3]. Growth plate chondrogenesis is regulated by a complex network of endocrine factors, paracrine factors, and intracellular transcription factors [Citation2].
In all living organisms, almost all of behavioral, physiological, and metabolic processes are regulated by circadian clock. Circadian clock is consisted of central clock in suprachiasmatic nucleus and peripheral clocks existed in nearly all organs. Circadian clock functions by the network of cellular oscillators, such as Bmal1, Cry, Per and Rev-erbα. Although the circadian clock is regulated by the central clock that synchronizes peripheral clocks in tissues, the peripheral clocks function tissue-specific regulation independent on the central clock [Citation4,Citation5]. Recently, many of research showed the peripheral clock plays a vital role in chondrogenesis and skeletal development. Several evidence exhibited chondrocytes in rat growth plate had active proliferation mostly in the early morning but cartilage mineralization mainly happens in the evening [Citation6,Citation7]. And genetic evidence revealed global and cartilage-specific Bmal1 deficient mice had abnormal growth plate function and bone development [Citation8,Citation9]. Although these reports suggest the circadian clock has a great contribution to growth plate chondrogenesis, the effect of peripheral clock on chondrogenesis is not completely understood.
Rev-erbα is a core circadian clock component and a member of the nuclear receptors superfamily that functions as a potent repressor of transcription. Many studies have indicated Rev-erbα had a broad role in pathological conditions such as inflammatory diseases, metabolic disorders, and cancers [Citation10–16]. Recently, Rev-erbα was involved in cartilage metabolism. The expression of Rev-erbα was decreased on aging and osteoarthritis articular cartilage and knockdown Rev-erbα inhibited the TGFβ pathway in chondrocytes [Citation17]. As we know, both growth plate cartilage and articular cartilage belong to hyaline cartilage [Citation18]. But the contribution of Rev-erbα to the growth plate chondrogenesis is unknown.
The present study intended to explore the effect of Rev-erbα on chondrogenesis of growth plate and further dissected the underlying mechanisms of Rev-erbα to chondrocyte functions. Our results showed blocking Rev-erbα suppressed the longitudinal elongation of metatarsal bone and growth plate chondrogenesis via up-regulating MAPK/ERK1/2 pathway.
Materials and methods
Metatarsal bone extract and culture
The 2nd, 3rd, and 4th metatarsal bones were isolated from 0-day old C57/BL6 mice (GemPharmatech, Nanjing, China) in a dissecting microscope. Then metatarsal bones were randomly divided into each group (n = 8–10) and randomly cultured individually in 24-well plates per well in 0.5 ml of α-MEM with 0.05 mg/mL ascorbic acid (1043003, Merck, Darmstadt, Germany), 1 mM sodium glycerophosphate (G9422, Merck, Darmstadt, Germany), 0.2% bovine serum albumin, 100 unit’s/mL penicillin, and 100 μg/ml streptomycin. The medium was changed every other day. Metatarsal bones were cultured for 3 days in the absence or presence of Rev-erbα antagonist SR8278 (0–60 μM, S0502S, Selleck, Houston, USA), with or without 10 μM SCH772984 (S7101, Selleck, Houston, USA), a specific ERK1/2 inhibitor. SCH772984 were added to cultures 30 min before addition of SR8278 and were incubated for 3 days [Citation19,Citation20].
Animal care was in compliance with the guidelines of the Institutional Animal Ethics Committee for the Care and Use of Laboratory Animals.
Quantitative histology
To calculate the metatarsal growth rate, the image of metatarsal bones at the beginning and at the end of the 3-day respectively were obtained in microscope and the length of each metatarsal bones were measured using ImageJ software. After 3-day, metatarsal bones were fixed in 4% phosphate-buffered paraformaldehyde (PFA) for 48 h. 4-μm-thick sections were obtained from each metatarsal bone and stained with toluidine blue. We measured the height of the resting zone (RZ), proliferative zone (PZ) and hypertrophic zone (HZ) from each of the sections. All quantitative histology was performed by a single observer blinded to the treatment category [Citation20].
Immunofluorescence staining
Immunofluorescence staining was performed on 4 μm sections. Briefly, after deparaffinization and rehydration, the sections were incubated with antigen retrieval using 2.5 mg/mL trypsin in PBS for 1 hour at 37°C. Next, the sections were subjected to 5% BSA for 50 min at 37°C, and then incubated with primary antibody overnight at 4°C. Following PBS washing, the sections were incubated with Fluor FITC-labeled fluorescent secondary antibody (ab6785, Abcam, Cambridge, UK) at 37°C for 1.5 h. After washing with PBS, the nuclei were stained with 4, 6-diamidino-2-phenylindole (DAPI) for 10 min at room temperature. Images were obtained using a fluorescence microscope.
BrdU incorporation
The 10 mM 5-bromo- 2’-deoxyuridine (BrdU) (00–0103, Invitrogen, Massachusetts, USA) was added to the medium and then incubated for 4 h. At the end of the incubation, metatarsal bones were fixed in 4% PFA. The 4-μm-thick longitudinal paraffin sections were stained for BrdU by immunofluorescence methods. The labeling index was calculated as the number of labeled cells/total cells. The labeling index was determined separately for the resting zone and proliferative zone. All determinations were made by the same observer blinded to the treatment category.
TUNEL assay
The metatarsal bone was fixed in 4% PFA, embedded in paraffin, and cut into 4-μm-thick longitudinal sections. From each bone, apoptotic cells of the growth plate were detected by In Situ Cell Death Detection Kit (No.12156792910, Roche, Mannheim, Germany), according to the manufacturer’s instructions. Nuclei were counterstained with DAPI. TUNEL-labeled cells were expressed with red fluorescence. The percentage of TUNEL-positive cells was calculated as the number of labeled cells/total cells per high-magnification field. All determinations were made by the same observer blinded to the treatment category.
Von kossa assay
Von kossa staining was performed using Von kossa Kit (G3282, Solarbio, Beijing, China). Briefly, following deparaffinization and rehydration, the sections were incubated with von kossa solution exposed to UV light for 30 min. After PBS washing, the sections were stained with eosin solution for 5 min.
Antibodies
The following antibodies were used: anti-GAPDH (ab8245, Abcam, Cambridge, UK), anti-REV-ERBα (Santa Cruz, sc-393215), anti-MMP13 (abcam, ab39012), anti-Collagen X (ab58632, Abcam, Cambridge, UK) and anti-Collagen II (ab34712, Abcam, Cambridge, UK), anti-Phospho-ERK1/2 (28733-1-AP, Proteintech, Wuhan, China), ERK1/2 (16443-1-AP, Proteintech, Wuhan, China), anti-p38(14064-1-AP, Proteintech, Wuhan, China), Phospho-p38(28796-1-AP, Proteintech, Wuhan, China) and anti-Brdu (PA5-32256, Invitrogen, Massachusetts, USA).
Immunohistochemistry
Immunohistochemistry was performed using the DAB (Zhongshan Biotechnologies, Beijing, China) staining method as described previously. Briefly, after deparaffinized and rehydrated, antigen retrieval was carried out with 2.5 mg/mL trypsin for 40 minutes. The sections were then incubated in 3% H2O2 for 10 min. Then, after incubation with blocking serum for 1 h at 37°C, the sections were incubated overnight at 4°C with primary antibody (Rev-erbα, Collegan X and p-ERK1/2) (25). One of the sections was incubated with rabbit or mouse IgG server as negative controls. Subsequently, the corresponding secondary antibody with biotin was applied for 1 hour at 37°C. Then, the sections were incubated for 10 min with avidin and biotinylated horseradish peroxidase, and visualized with DAB and counterstained with hematoxylin solution.
Primary chondrocyte extract and culture
Rib cartilage was isolated from <3-day-old mice [Citation21]. Briefly, mice were euthanized, and then removed soft tissue and isolated rib cartilage from ribs. Subsequently, the cartilage was digested with 0.2% collagenase for 40 min at 37°C. After PBS washing, the cartilage was secondly digested with 0.25% collagenase for 2 h at 37°C. The chondrocyte suspension was filtered through a 70-μM cell strainer, counted and seeded in 6-well plates (10,000 cells/cm2) in DMEM with 10% fetal bovine serum, 100 units/ml penicillin and 100 μg/mL streptomycin and 50 μg/ml ascorbic acid. The only first and second passage cells were used for the experiments. Once 70–80% confluence was reached, chondrocytes were transfected with shRNA control and shRNA Rev-erbα plasmid using lipofectamine 3000 (L3000075, Invitrogen, Massachusetts, USA). Before the treatment of chondrocyte, the chondrocyte was synchronized by treatment of 200 μM dexamethasone for 2 hours. The sample was obtained at 48 hours after synchronization.
Chondrocyte micro-mass culture and alcian blue staining
The 20 μL primary chondrocytes suspension at a density of 5000 cells per well in DMEM medium was dropped into each well of 24-well plate. After 2 h, micro-masses were continually cultured in DMEM with 10% FBS for 6 days. After PBS washing and fixing, micro-masses were rinsed with HCl 0.1 N and then stained by 1% alcian blue (A5268, Merck, Darmstadt, Germany) for 30 min [Citation22].
Western blot
Protein lysates were solubilized with 1% SDS sample buffer and electrophoresed on a 10% SDS-PAGE gel (Bio-Rad). After transformation onto a nitrocellulose membrane, the lysates were immunoblotted with the indicated primary antibodies overnight at 4°C. Subsequently, the blots were incubated with the corresponding secondary antibodies for 60 min and visualized with enhanced chemiluminescence (GE Healthcare) detection system.
Real-time quantitative PCR analysis (RT-qPCR)
Total RNA was extracted from primary chondrocytes and metatarsal bone with Trizol reagent (9108Q, Takara, Tokyo, Japan) according to the manufacturer’s protocol. 1 μg total RNA was converted to cDNA using the High-Capacity cDNA Reverse Transcription Kit (R333, Vazyme, Nanjing, China). qPCR was carried out with SYBR qPCR Master Mix (Q712, Vazyme, Nanjing, China). Gene expression was normalized to GAPDH, and relative expression was calculated using the 2–(ΔΔCt) method. The following primer sequences were described in Supplemental table S1.
Statistics
All data are presented as the mean ± SD. Statistical significance was analyzed using SPSS 17.0 software with unpaired 2-tailed Student’s t test for the two groups and one-way analysis of variance (ANOVA) for more than two groups, and P value of less than 0.05 was considered statistically significant.
Results
Rev-erbα exhibited the spatiotemporal expression model in growth plate
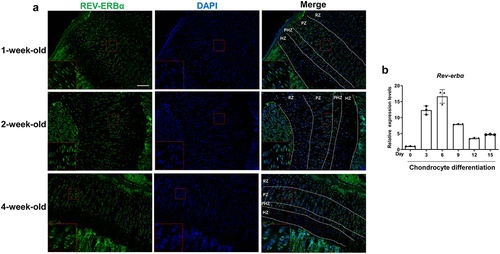
To understand the expression of Rev-erbα in growth plate, we first carried out immunofluorescence analysis to detect the expression model in growth plate from 1, 2, and 4-week-old mice. The results showed that REV-ERBα had mainly higher expression in resting zone, proliferative zone and prehypertrophic zone but lower expression in hypertrophic zone in growth plate from 1, 2, and 4-week old mice ()). And then, we further addressed the Rev-erbα expression during chondrocyte differentiation. Primary chondrocytes were extracted from rib cartilage of 1-day-old mice. The RNA was respectively extracted in chondrocyte induced by 0, 3, 6, 9, 12 and 15 days. As shown in ), RT-qPCR results revealed the higher expression of Rev-erbα on 3rd, 6th and 9th day after chondrocyte differentiation but lower expression on 0, 12th, and 15th day. These results indicated Rev-erbα exhibited the spatiotemporal expression model in growth plate.
Figure 1. The expression model of Rev-erbα in growth plate chondrocyte. (a) Immunofluorescence analysis of Rev-erbα in growth plate from 1, 2 and 4-week-old mice. Red boxed areas show higher magnification. Scale bars:100 μm. RZ: Resting zone, PZ: Proliferative zone, PHZ: Prehypertrophic zone, HZ: hypertrophic zone. (b) RT-qPCR analysis for the expression of Rev-erbα during primary chondrocyte differentiation (n = 3). Data are presented as mean ± SD (Student t test; *P < 0.05, **P < 0.01).
Blocking Rev-erbα inhibited longitudinal elongation of metatarsal bone
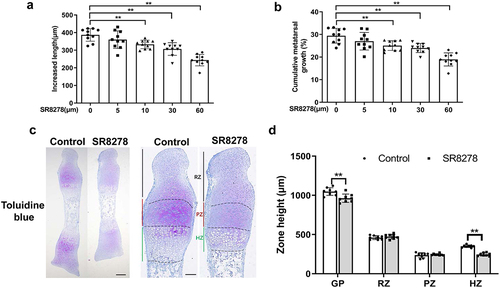
To study the direct effect of Rev-erbα on growth plate chondrogenesis, 1-day-old mice metatarsal bones were cultured for 3 days in serum-free medium containing SR8278 (0–60 μM), a Rev-erbα antagonist. After 3-day culture, the metatarsal longitudinal growth was significantly inhibited in the treatment of 10 μM SR8278 (the lowest inhibiting concentration) compared with 0 μM SR8278 ()). From now on, 10 μM as SR8278 treatment concentration was used in following all experiments. Next, toluidine blue staining was performed to assess the morphology of metatarsal bone. The results showed SR8278-induced metatarsal bone had reduced the height of growth plate compared to controls ()). We further detected each zone height of growth plate and found that the decreased height of total growth plate and hypertrophic zone in SR8278-induced metatarsal bone related to controls whereas no significant difference in resting zone and proliferative zone ()). These data suggested Rev-erbα inhibited metatarsal bone longitudinal growth and growth plate development.
Figure 2. Rev-erbα antagonist SR8278 inhibited longitudinal elongation of metatarsal bone. (a,b) Metatarsal bone was extracted from 0 day-old mice and cultured in serum-free MEM medium containing graded concentrations of Rev-erbα antagonist SR8278 (0–60 μM). Bone length was measured at the beginning and at the end of the 3-day culture using an eyepiece micrometer in a dissecting microscope (n = 10). (c) Toluidine blue staining of control and SR8278 metatarsal bone. Scale bars:100 μm. (d) The height of growth plate, resting zone, proliferative zone and hypertrophic zone from control and SR8278 metatarsal bone (n = 8). GP: Growth plate, RZ: Resting zone, PZ: Proliferative zone, HZ: hypertrophic zone. Data are presented as mean ± SD (Student t test; *P < 0.05, **P < 0.01).
Restraining Rev-erbα caused inhibited proliferation and accumulation of chondrocyte in growth plate
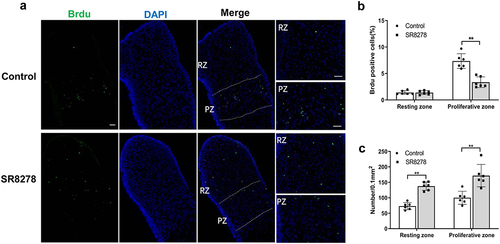
Given the SR8278-inhibited longitudinal growth and growth plate development, we further research the effect of SR8278 on chondrocyte proliferation in growth plate using Brdu incorporation experiment. Immunofluorescence analysis uncovered that SR8278 resulted in decreased number of Brdu-positive cells in proliferative zone of metatarsal bone compared with controls ()). However, resting zone showed no significant difference in the number of Brdu-positive cells in SR8278-treated and control metatarsal bones ()). Interestingly, we found the much more number of chondrocytes (DAPI-positive cells) both in resting zone and proliferative zone in SR8278-treated metatarsal bone than controls ()). These results indicated restraining Rev-erbα led to the decreased chondrocyte proliferation and increased chondrocyte accumulation in growth plate.
Figure 3. SR8278 resulted in inhibited proliferation and accumulation of chondrocyte in growth plate. After 3-day culture, Brdu was incorporated in the culture medium for 4 hours. (a) Immunofluorescence analysis of Brdu in growth plate from control and SR8278 metatarsal bone. Scale bars:100 μm. RZ: Resting zone, PZ: proliferative zone. (b) Quantification of Brdu-positive cells (green) in resting zone and proliferative zone of growth plate (n = 6). (c) Quantification of DAPI-positive cells (blue) in resting zone and proliferative zone of growth plate (n = 6). Data are presented as mean ± SD (Student t test; *P < 0.05, **P < 0.01).
Blocking Rev-erbα inhibited chondrocyte differentiation and mineralization in growth plate
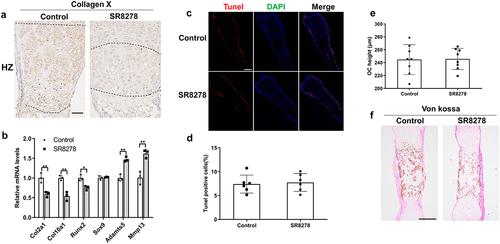
Considering SR8278-caused reduced hypertrophic zone in growth plate, we detected the expression of hypertrophic marker Collagen X in growth plate. Immunohistochemistry analysis revealed the lower expression and narrower region in hypertrophic zone in SR8278-induced metatarsal bone than controls ()). Next, we detected the mRNA expression of chondrocyte differentiation-related marker with the treatment of SR8278. RT-qPCR analysis revealed SR8278 resulted in the decreased expression of Col2a1, Col10a1 and Runx2 whereas the increased expression of Adamts5 and Mmp13 ()). Because chondrocyte terminal apoptosis has important contribution to endochondral ossification and bone growth [Citation3], chondrocyte apoptosis was detected using TUNEL assay. But there was no significant difference in the percent of Tunel-labeled cells in growth plate between SR8278 and control metatarsal bone ()). It’s well-known that the calcified cartilage in the growth plate is replaced by bone tissue during endochondral ossification [Citation3], so we next detected the height of ossification center in the metatarsal bone. As shown in ), there was no significant difference in the height of ossification center between SR8278 and control metatarsal bone. However, Von Kossa assay uncovered lower mineralization ability in ossification center of growth plate in SR8278 metatarsal bone than controls ()). These data indicated that Rev-erbα inhibition results in the decreased differentiation and mineralization of growth plate.
Figure 4. The effect of SR8278 on chondrocyte differentiation, apoptosis and mineralization in growth plate. (a) Immunohistochemistry analysis of Collagen X in hypertrophic zone of growth plate from control and SR8278 metatarsal bone. Scale bars:50 μm. (b). RNA was extracted from control and SR8278 metatarsal bone. And RT-qPCR analysis for the mRNA expression of Col2a1, Col10a1, Runx2, Sox9, Adamts5 and Mmp13 in control and SR8278 metatarsal bone (n = 3). (c) Immunofluorescence analysis of Tunel in growth plate from control and SR8278 metatarsal bone. Scale bars:200 μm. (d) Quantification of Tunel -positive cells (red) in growth plate from control and SR8278 metatarsal bone (n = 6). (e) The height of ossification center in the growth plate from control and SR8278 metatarsal bone (n = 8). (f) Von kossa for mineralization of ossification center in the growth plate from control and SR8278 metatarsal bone. Scale bars:100 μm. Data are presented as mean ± SD (Student t test; *P < 0.05, **P < 0.01).
Knock-down Rev-erbα restrained proliferation and differentiation of chondrocyte
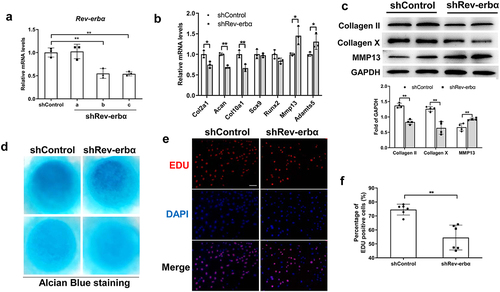
To confirm the effect of Rev-erbα antagonist SR8278 on proliferation and differentiation, we further studied the proliferation and differentiation in primary chondrocytes by knock-down Rev-erbα. The chondrocytes were transfected with shRev-erbα plasmid. RT-qPCR uncovered the lower mRNA expression of Rev-erbα with shRev-erbα (a and b) transfected chondrocyte than shControl ()) whereas no difference with shRev-erbα (a). All subsequent knock-down Rev-erbα experiments used the shRev-erbα (b) plasmid. As seen in ), the mRNA expression of Col2a1, Acan and Col10a1 was reduced but Mmp13 and Adamts5 were increased in shRev-erbα chondrocytes compared with shControl ()). Similarly, the protein expression of Collagen II and Collagen X was decreased but the expression of MMP13 was increased in shRev-erbα related to shControl ()). Further, chondrocytes differentiation was assessed by micro-mass culture for 6 days. The alcian blue staining exhibited knock-down Rev-erbα inhibited chondrocyte differentiation ()). And chondrocyte proliferation was assessed using Edu incorporation, the immunofluorescence showed reduced number of Edu-positive cells in shRev-erbα compared to shControl ()).
Figure 5. Knock-down Rev-erbα inhibited proliferation and differentiation of chondrocyte. (a) Primary chondrocyte was extracted from rib cartilage of <3-day-old mice. RT-qPCR analysis for the mRNA expression of Rev-erbα in primary chondrocyte infected with lentivirus-expressing control or shRNA Rev-erbα (n = 3). (b) RT-qPCR analysis for the mRNA expression of Col2a1, Col10a1, Runx2, Sox9, Adamts5 and Mmp13 in control and Rev-erbα shRNA chondrocyte (n = 3). (c) Western blot for the expression of Collagen II, Collagen X and MMP13 in control and Rev-erbα shRNA chondrocyte. Quantification is shown on the right using ImageJ software (n = 4). (d) Chondrocyte micro-masses were cultured in DMEM with 10% FBS for 6 days and were performed to alcian blue staining. The representative images of alcian blue of control and Rev-erbα shRNA micro-masses. (e) Edu was incorporated in the culture medium for 4 hours. Immunofluorescence analysis of Edu in control and Rev-erbα shRNA chondrocyte. Scale bars:100 μm. (f) Quantification of Edu-positive cells (red) in control and Rev-erbα shRNA chondrocyte (n = 6). Scale bars:100 μm. Data are presented as mean ± SD (Student t test; *P < 0.05, **P < 0.01).
Knock-down Rev-erbα promoted MAPK-ERK1/2 signaling pathway
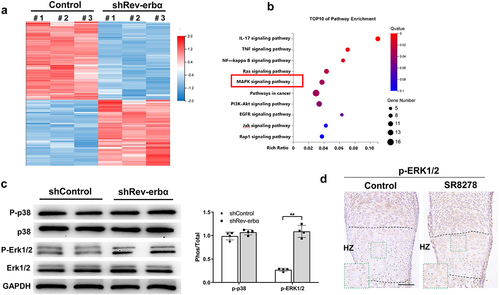
To further explore the potential molecular mechanisms involved in the effect of Rev-erbα on growth plate chondrogenesis, we performed RNA-sequencing analysis in shControl and shRev-erbα chondrocytes. The results showed 128 down-regulated genes and 108 up-regulated genes in the shRev-erbα chondrocyte compared with shControl ()). Kyoto Encyclopedia of Genes and Genomes (KEGG) analysis showed that the top 10 enrichment signaling pathways ()). Among these pathways, MAPK signaling pathway was reported that plays a vital role in in chondrogenesis and bone development ()). Firstly, we detected the expression of p-ERK1/2 and p-p38, the key factors in MAPK signaling pathway, in the shRev-erbα and shControl chondrocytes. As seen in ), Knock-down Rev-erbα resulted in increased expression of p-ERK1/2 than controls but no significantly different expression of p-p38. Similarly, immunohistochemical analysis revealed the higher expression level of p-ERK1/2 in growth plate from SR8278-induced metatarsals bones than control ()).
Figure 6. Knock-down Rev-erbα up-regulated MAPK-ERK1/2 signaling pathway. (a) Heatmap of RNA-seq analysis for differentially expressed genes between control and Rev-erbα shRNA chondrocyte. (b) Bar plot showing the top 10 enriched KEGG pathways in the differentially expressed genes between control and Rev-erbα shRNA chondrocyte. (c) Western blot for the protein expression of p-ERK1/2, ERK1/2, p-p38 and p38 in control and Rev-erbα shRNA chondrocyte. Quantification is shown on the right using ImageJ software (n = 4). (d) Immunohistochemistry analysis of p-ERK1/2 in hypertrophic zone of growth plate from control and SR8278 metatarsal bone. Green boxed areas show higher magnification in hypertrophic zone(HZ). Scale bars:100 μm. Data are presented as mean ± SD (Student t test; *P < 0.05, **P < 0.01).
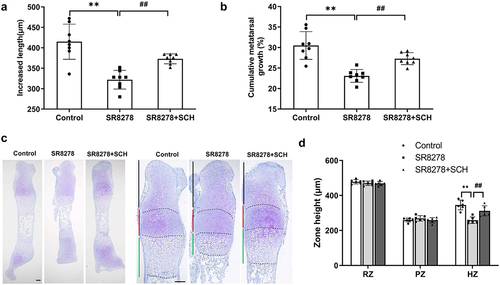
We then raised whether over-activated MAPK-ERK1/2 signaling triggered by Rev-erbα knockdown contributed to inhibited longitudinal elongation of metatarsal bone. To corroborate this hypothesis, the SR8278-induced metatarsals bones were treated with SCH772984, an inhibitor of MAPK-ERK1/2 signaling. The results showed SCH772984 reversed partially SR8278-induced inhibited longitudinal metatarsal bone growth (). And morphological analysis exhibited SCH772984 reversed partially SR8278-induced reduced height of hypertrophic zone ()). These data indicated Rev-erbα blocking-mediated inhibition metatarsals bones growth via activation of MAPK-ERK1/2 signaling pathway.
Figure 7. Restraint of MAPK-ERK1/2 abrogated SR8278-inhibited longitudinal elongation of metatarsal bone. Metatarsal bone was extracted from 0 day-old mice and cultured in serum-free MEM medium containing SR8278 or SCH772984 (SCH). (a,b) Bone length was measured at the beginning and at the end of the 3-day culture using an eyepiece micrometer in a dissecting microscope (n = 8). (c) Toluidine blue staining of control, SR8278 and SR8278+ SCH metatarsal bone. Scale bars:100 μm. (d) The height of resting zone, proliferative zone and hypertrophic zone from control, SR8278 and SR8278+ SCH metatarsal bone (n = 6). RZ: Resting zone, PZ: Proliferative zone, HZ: Hypertrophic zone. Data are presented as mean ± SD (One-way ANOVA; VS. control, *P < 0.05, **P < 0.01, VS. SR8278, #P < 0.05, ##P < 0.01).
Discussion
Although some research indicated Rev-erbα is involved in articular cartilage homeostasis, the regulation of Rev-erbα on growth plate chondrogenesis is unclear. In our study, we found inhibition of Rev-erbα restrained longitudinal elongation of metatarsal bone and chondrogenesis via up-regulating MAPK-ERK1/2 pathway.
It’s well-known that circadian clocks coordinate in behavioral, physiological, and metabolic processes with approximately 24 h from the organism to individual cells. And the circadian clock functions by transcriptional feedback loops consisted of several core clock components such as Bmal1, Clock and Rev-erbα [Citation23]. Increasing evidence indicate circadian clock plays a vital role in cartilage development and homeostasis. Some studies showed the chondrocyte proliferation mainly happened in the morning whereas cartilage mineralization mainly occurred in the evening [Citation6,Citation7]. And some reports revealed clock gene Bmal1 deficiency resulted in abnormal growth plate chondrogenesis and bone developmental retardation [Citation8,Citation9]. Similarly, our study exhibited the clock gene Rev-erbα inhibition lead to decreased longitudinal elongation of metatarsal bone ex vivo by using Rev-erbα antagonist SR8278. Further, we found blocking Rev-erbα resulted in reduced height of growth plate. In line with our results, Rev-erbα had decreased expression on aging and osteoarthritis articular cartilage and knockdown Rev-erbα inhibited the TGFβ pathway in chondrocyte [Citation17]. Likely, SR9009 treatment retarded articular cartilage degradation in meniscectomy-induced osteoarthritis [Citation24]. And also, Another evidence displayed Rev-erbα agonist SR9009 decelerated degradation of articular cartilage in collagen-induced arthritis mice [Citation25]. These data indicated clock gene Rev-erbα involved in growth plate cartilage development and articular cartilage homeostasis. However, Rev-erbα antagonist SR8278 and agonist SR9009 lack of tissue-specific function to growth plate chondrogenesis and articular cartilage homeostasis, further studies will be carried out using cartilage-specific deletion or over-expression Rev-erbα to lend further support for the regulation of Rev-erbα on growth plate cartilage development and maintenance of articular cartilage homeostasis.
Specifically, we found SR8278 inhibited chondrocyte proliferation although the height of proliferative zone had no significant difference. But the inhibiting Rev-erbα led to the accumulation of chondrocyte both in resting and proliferative zone. The contradiction is likely because of abnormal accumulation of chondrocyte in proliferative zone although the chondrocyte proliferation was inhibited in SR8278-induced growth plate. Moreover, our study uncovered the inhibiting Rev-erbα made the reduced height of hypertrophic zone and expression of Collagen X. The decreased height of hypertrophic zone is likely because of the reduced proliferation of chondrocyte or inhibited differentiation from proliferative chondrocytes to hypertrophic chondrocytes. Further study should be explored the effect of Rev-erbα on chondrocyte fate during growth plate chondrogenesis using chondrocyte-specific Rev-erbα deletion mice.
As we know that endochondral ossification is the process that cartilage is formed and then remodeled into bone. Our research revealed Rev-erbα antagonist inhibited the mineralization of growth plate although the height of ossification center had no significant difference. In line with our study, previous studies showed over-expressed Rev-erbα suppressed the proliferation and osteogenesis of bone mesenchymal stem cell via Wnt/β-catenin signaling [Citation26]. Moreover, Rev-erbα agonism ameliorated the bone loss in osteoporosis mice [Citation27]. These research indicate Rev-erbα has the important role in bone development and remodeling. Further studies will be required to explore the cell-specific function of Rev-erbα to bone metabolism using bone cell-specific Rev-erbα ablation mice.
Currently, many evidence have indicated the vital role of the MAPK-ERK pathways in growth plate chondrogenesis and bone development. In our research, RNA-seq analysis revealed knock-down Rev-erbα up-regulated MAPK-ERK pathways in growth plate chondrocyte. However, blockade of the MAPK-ERK signaling pathway partially ameliorated Rev-erbα antagonist-mediated the inhibition of longitudinal elongation of metatarsal bone and decreased height of hypertrophic zone in growth plate. Previous studies have reported constitutive activation of MEK1 mice had inhibited hypertrophic differentiation of chondrocytes and accumulation chondrocyte in proliferative zone of growth plate although there was no change in chondrocyte proliferation [Citation28]. Our studies also showed blocking Rev-erbα suppressed hypertrophic differentiation of chondrocytes and led to accumulation chondrocyte in proliferative zone of growth plate. In contrast, inactivated ERK1/2 in osteo-chondroprogenitor cells and chondrocyte led to the bone overgrowth of mice, widening of the zone of hypertrophic chondrocytes and chondrodysplasia [Citation29,Citation30]. The same studies also showed ERK1/2 deletion in hypertrophic chondrocyte resulted in expanded zone of hypertrophic chondrocytes of the growth plate and reduced the expression of MMP13 [Citation31]. Consistent with these contentions, our findings revealed the decreased expression of MMP13 in chondrocyte either treated with SR8278 or knock-down Rev-erbα. These findings suggest that Rev-erbα regulates growth plate chondrogenesis via MAPK-ERK signaling pathway.
In conclusion, our findings indicated that inhibition of Rev-erbα suppressed growth plate development and longitudinal elongation of metatarsal bone via up-regulating MAPK-ERK1/2 pathways. The study firstly provided mechanistic insights into a key role of Rev-erbα in growth plate chondrogenesis.
Supplemental Material
Download MS Word (32.5 KB)Disclosure statement
No potential conflict of interest was reported by the author(s).
Data availability statement
Data available within the article or its supplementary materials at https://doi.org/10.1080/15384101.2022.21091
Supplementary material
Supplemental data for this article can be accessed online at https://doi.org/10.1080/15384101.2022.2109106
Additional information
Funding
References
- Kronenberg HM. Developmental regulation of the growth plate. Nature. 2003;423:332–336.
- Kozhemyakina E, Lassar AB, Zelzer E. A pathway to bone: signaling molecules and transcription factors involved in chondrocyte development and maturation. Development. 2015;142:817–831.
- Xie Y, Zhou S, Chen H, et al. Recent research on the growth plate: advances in fibroblast growth factor signaling in growth plate development and disorders. J Mol Endocrinol. 2014;53:T11–34.
- Reppert SM, Weaver DR. Coordination of circadian timing in mammals. Nature. 2002;418:935–941.
- Reinke H, Asher G. Crosstalk between metabolism and circadian clocks. Nat Rev Mol Cell Biol. 2019;20:227–241.
- Stevenson S, Hunziker EB, Herrmann W, et al. Is longitudinal bone growth influenced by diurnal variation in the mitotic activity of chondrocytes of the growth plate? J Orthop Res. 1990;8:132–135.
- Simmons DJ, Arsenis C, Whitson SW, et al. Mineralization of rat epiphyseal cartilage: a circadian rhythm. Miner Electrolyte Metab. 1983;9:28–37.
- Takarada T, Kodama A, Hotta S, et al. Clock genes influence gene expression in growth plate and endochondral ossification in mice. J Biol Chem. 2012;287:36081–36095.
- Ma Z, Jin X, Qian Z, et al. Deletion of clock gene Bmal1 impaired the chondrocyte function due to disruption of the HIF1alpha-VEGF signaling pathway. Cell Cycle. 2019;18:1473–1489.
- Chang C, Loo CS, Zhao X, et al. The nuclear receptor REV-ERBalpha modulates Th17 cell-mediated autoimmune disease. Proc Natl Acad Sci U S A. 2019;116:18528–18536.
- Pariollaud M, Gibbs JE, Hopwood TW, et al. Circadian clock component REV-ERBalpha controls homeostatic regulation of pulmonary inflammation. J Clin Invest. 2018;128:2281–2296.
- Hunter AL, Pelekanou CE, and Barron NJ, et al. Adipocyte NR1D1 dictates adipose tissue expansion during obesity. eLife. 2021;10:e63324.
- Hunter AL, Pelekanou CE, Adamson A, et al. Nuclear receptor REVERBalpha is a state-dependent regulator of liver energy metabolism. Proc Natl Acad Sci U S A. 2020;117:25869–25879.
- Woldt E, Sebti Y, Solt LA, et al. Rev-erb-alpha modulates skeletal muscle oxidative capacity by regulating mitochondrial biogenesis and autophagy. Nat Med. 2013;19:1039–1046.
- Gerhart-Hines Z, Feng D, Emmett MJ, et al. The nuclear receptor Rev-erbalpha controls circadian thermogenic plasticity. Nature. 2013;503:410–413.
- Sulli G, Rommel A, Wang X, et al. Pharmacological activation of REV-ERBs is lethal in cancer and oncogene-induced senescence. Nature. 2018;553:351–355.
- Akagi R, Akatsu Y, Fisch KM, et al. Dysregulated circadian rhythm pathway in human osteoarthritis: NR1D1 and BMAL1 suppression alters TGF-beta signaling in chondrocytes. Osteoarthritis Cartilage. 2017;25:943–951.
- Krishnan Y, Grodzinsky AJ. Cartilage diseases. Matrix Biol. 2018;71-72:51–69.
- Song W, Fhu CW, Ang KH, et al. The fetal mouse metatarsal bone explant as a model of angiogenesis. Nat Protoc. 2015;10:1459–1473.
- Kang X, Yang W, Wang R, et al. Sirtuin-1 (SIRT1) stimulates growth-plate chondrogenesis by attenuating the PERK-eIF-2alpha-CHOP pathway in the unfolded protein response. J Biol Chem. 2018;293:8614–8625.
- Gosset M, Berenbaum F, Thirion S, et al. Primary culture and phenotyping of murine chondrocytes. Nat Protoc. 2008;3:1253–1260.
- Atsuta Y, Tomizawa RR, Levin M, et al. L-type voltage-gated Ca(2+) channel CaV1.2 regulates chondrogenesis during limb development. Proc Natl Acad Sci U S A. 2019;116:21592–21601.
- Sinturel F, Petrenko V, Dibner C. Circadian clocks make metabolism run. J Mol Biol. 2020;432:3680–3699.
- Das V, Kc R, Li X, et al. Pharmacological targeting of the mammalian clock reveals a novel analgesic for osteoarthritis-induced pain. Gene. 2018;655:1–12.
- Liu H, Zhu Y, Gao Y, et al. NR1D1 modulates synovial inflammation and bone destruction in rheumatoid arthritis. Cell Death Dis. 2020;11:129.
- He Y, Lin F, Chen Y, et al. Overexpression of the circadian clock gene rev-erbalpha affects murine bone mesenchymal stem cell proliferation and osteogenesis. Stem Cells Dev. 2015;24:1194–1204.
- Song C, Tan P, Zhang Z, et al. REV-ERB agonism suppresses osteoclastogenesis and prevents ovariectomy-induced bone loss partially via FABP4 upregulation. FASEB J. 2018;32:3215–3228.
- Murakami S, Balmes G, McKinney S, et al. Constitutive activation of MEK1 in chondrocytes causes Stat1-independent achondroplasia-like dwarfism and rescues the Fgfr3-deficient mouse phenotype. Genes Dev. 2004;18:290–305.
- Matsushita T, Chan YY, Kawanami A, et al. Extracellular signal-regulated kinase 1 (ERK1) and ERK2 play essential roles in osteoblast differentiation and in supporting osteoclastogenesis. Mol Cell Biol. 2009;29:5843–5857.
- Sebastian A, Matsushita T, Kawanami A, et al. Genetic inactivation of ERK1 and ERK2 in chondrocytes promotes bone growth and enlarges the spinal canal. J Orthop Res. 2011;29:375–379.
- Chen Z, Yue SX, Zhou G, et al. ERK1 and ERK2 regulate chondrocyte terminal differentiation during endochondral bone formation. J Bone Miner Res. 2015;30:765–774.