
ABSTRACT
Colorectal cancer (CRC) is a common malignant tumor with strong invasiveness. Given the reported involvement of DEP domain-containing protein 1B (DEPDC1B) in the progression of some cancers, its role in CRC was explored in this study. DEPDC1B expression in CRC was assessed based on database and tissue microarray (TMA). In addition, the knockdown and overexpression of DEPDC1B in CRC cell lines were constructed using small hairpin RNA (shRNA) interference. The biological function of DEPDC1B in CRC was evaluated in vitro and in vivo through loss/gain-of-function assays. The results demonstrated that DEPDC1B was highly expressed in CRC. Furthermore, DEPDC1B had the ability to promote CRC proliferation and migration coupled by cell apoptosis. In vivo results showed that DEPDC1B knockdown significantly inhibited the growth of xenograft tumors. Additionally, the results of antibody array indicated increased apoptosis-promoting proteins and decreased apoptosis-inhibiting proteins in DEPDC1B-knockdown CRC cells. In conclusion, DEPDC1B played a key driver role in CRC progression, and inhibition of its expression may be a potential target for precision medicine in CRC.
Introduction
Colorectal cancer (CRC) is one of the most common primary intestinal malignancies in the world, with the fourth highest fatality [Citation1]. Due to the gradual increase in morbidity and mortality, CRC has been summarized as a major threat to human health [Citation2]. In the past few years, the clinical management of CRC includes a combination of surgery, radiotherapy and chemotherapy, molecular targeted drugs, biological therapy, and immunotherapy. Despite development in treatment strategies, the survival rate of patients with advanced CRC has not improved significantly [Citation3,Citation4]. The latest view is that tumorigenesis is mainly due to the interaction of internal genetic susceptibility and external environmental factors [Citation5]. Therefore, exploring the critical molecules that lead to the malignant progression of CRC is of great importance for the development of new effective treatments for CRC [Citation6]. Along with the development of CRC therapies, several oncogenes such as VEGFR, EGFR, NTRK, KRAS, NRAS and BRAF have been identified [Citation7–10], which has facilitated the application of novel antineoplastic drugs such as bevacizumab, cetuximab and panitumumab [Citation11–13]. Despite all this progress, the prognosis of advanced CRC patients remains dismal. Thus, it is still imperative to elucidate more novel and effective molecular targets for better diagnostic and therapeutic management of CRC.
DEP domain-containing protein 1B (DEPDC1B) is a novel protein located in chromosome 5 region. DEPDC1B has two specific major domains, including one related to Rho GTPase transduction [Citation14–16] and a spherical domain consisting of ninety amino acids [Citation17–19]. In function, the domain of DEP was suggested to participate in localization of cell membrane and a spectrum of biological functions, such as cell polarity determination and photoreceptors of the retina associated specialized signal [Citation20]. Moreover, the exiting of DEP facilitates the interaction of GPCR between GPCR and membrane phospholipids, and contributes to the regulation of GPCR signal transduction [Citation15,Citation21]. On the other hand, DEPDC1B was considered to be associated with cancer progression, migration, apoptosis and cell cycle regulation [Citation16]. However, the precise molecular mechanisms and functions of DEPDC1B in cancer remain poorly understood. Furthermore, subsequent studies identified DEPDC1B as a cancer driver in some malignancies, including breast cancer (BC) [Citation22], oral cancer (OC) [Citation23], NSCLC [Citation24] and prostate cancer (PC) [Citation25]. Nevertheless, the potential role of DEPDC1B in CRC progression remains largely unclear. Thus, the expectation of our study is to uncover the specific function and underlying mechanism of DEPDC1B in CRC.
Materials and methods
Patients and samples
For immunohistochemical analysis, 99 CRC samples and 81 adjacent normal tissues constituted a tissue microarray (TMA). Patients who had received radiotherapy and chemotherapy before the operation were excluded from the experiment. All CRC patients were closely followed up at least for 12 months. Collection of samples with informed consent from patients. The approval of this study was confirmed by the Ethics Committee of Union Hospital, Tongji Medical College, Huazhong University of Science and Technology (Hubei, China).
Immunohistochemical (IHC) staining
Fresh TMA was processed with neutral buffer formalin (10%) for 12 hours at room temperature, and then embedded in paraffin, sliced 4 μm, dewaxed and rehydrated (×ylene) ethanol (100%) soaked for 10 min, ethanol (95%) soaked in ethanol (95%) for 5 min, ethanol (80%) soaked for 5 min, and finally 70% ethanol soaked in 5 min to inhibit the activity of endogenous peroxidase. TMA slides were incubated with first antibody DEPDC1B (# ab124182, Abcam, Cambridge, Massachusetts, USA) at 4°C. In the last step, with NovolinkTM Polymer Detection System (DAB) coupled with subsequent hematoxylin the sections were simultaneously stained. The obtained images were saved and analyzed by automatic optical microscope system.
Cell culture
Human CRC cell line HCT 116 and RKO (American Type Culture Collection, ATCC, Manassas, USA) were cultured with Dulbecco’s Modified Eagle Medium (DMEM, Invitrogen, CA, USA) supplemented with 10% FBS (HyClone, Logan) and 1% antibiotic (penicillin and streptomycin, Invitrogen, CA, USA) in six-well plates at 37°C and 5% concentration of carbon dioxide.
Lentiviral vector preparation of DEPDC1B interference
The lentiviral vector-based small hairpin RNA (shRNA) was used to DEPDC1B (Gene ID: 55789) knockdown/overexpression [Citation26]. The target gene DEPDC1B sequence was shown as follows: 5’- GCTGCTAGATTGGTAACGTTT-3’. The scramble vector was utilized as negative control. According to the instruction, a 20 μL reaction system was prepared and the dsDNA oligonucleotides are connected to a specific linearized vector by a ligation operation. Then the reaction product was transformed into the competent cells (TOP10 E. coli, #CB104–03, TIANGEN, Beijing, China) with 500 μL LB liquid (antibiotic-free) and collected at 37°C for 1 h. A 20 μL polymerase chain reaction system was prepared by smearing 150 μL solution on pound liquid medium containing AMP, incubated at 37°C overnight. In order to count the number of clones, a single colony was adopted as the template of the PCR reaction product. The PCR reaction conditions are as follows: 1) reaction at 94°C for 3 min, 2) reaction at 94°C for 30 min, 3) reaction at 55°C for 30 min, 4) reaction at 72°C for 30 s, a total of 22 cycles, and 5) reaction at 72°C for 5 min. TH was incubated with pound liquid medium containing AMP, incubated overnight at 37°C. Moreover, the plasmid was purified according to the instructions of endotoxin-free Maxi plasmid kit (# DP117, Beijing, China). Finally, the qualified plasmids were selected for further virus packaging. The lentivirus expressing shDEPDC1B and DEPDC1B overexpression were constructed by Shanghai Bioscience Co., Ltd. The efficiency of lentivirus infection was evaluated by fluorescence intensity detection. Notably, the knockdown and overexpression lentiviral vectors were BR-V108 and LV-004, respectively. Here, shDEPDC1B referred to knockdown of DEPDC1B in CRC cell lines and shCtrl was recognized as a control. In addition, DEPDC1B referred to overexpression of DEPDC1B in CRC cell lines and Control was recognized as a negative control.
Quantitative real-time polymerase chain reaction (qRT-PCR)
The relative mRNA level of DEPDC1B in HCT 116 and RKO cells were investigated via qRT-PCR. First, according to the manufacturer’s instruction, total RNA was collected from CRC cells through total RNA kit (Invitrogen, Carlsbad, CA, USA) and the RNA quality was analyzed using Nanodrop 2000/2000C spectrophotometric. Second, Reverse Transcription Kit (Takara, Dalian, China) was selected to produce cDNAs from mRNA. The real-time PCR reaction was performed via Power SYBR Green (Takara, Dalian, China). GAPDH was recognized as an experimental control. The primers for PCR were as follows: DEPDC1B forward, 5’-CTGAAGTGACCCGCAAACAAA-3’ and reverse, 5’-CTGGTGGGAGATCATTCCATTC-3’, GAPDH forward,5’- TGACTTCAACAGCGACACCCA-3’ and reverse,5’-CACCCTGTTGCTGTAGCCAAA-3’.
Western blot
First, HCT 116 and RKO cells were collected and broke them up in RIPA Buffer Reagent (Cell Signal Technology, Danvers, USA) to extract protein. The protein was identified by BCA Assay Kit (# 23225, HyClone, USA), followed by separated using protein electrophoresis. All proteins containing the target protein were transferred to the PVDF membrane and blocked by bovine serum albumin with 0.5% Tween 20 for 1 h under room temperature. The solution containing the target protein and the first antibody were incubated overnight at 4°C, the antibodies used are as follows: anti-DEPDC1B antibody (#ab124182, Abcam, USA), anti-GAPDH antibody (#AP0063, Bioworld, St, USA). After 3 times of washing in TBST for 5 min, then the binding protein was with IgG antibody coupled with HRP (#A0208, Beyotime, China) for 1 h. At last, all proteins were quantified via ECL Detection reagent (Amersham, Chalfont, UK, # RPN2232).
MTT assay
MTT assay was utilized to detect viability of CRC cell lines. First, HCT 116 and RKO cells were divided into a 96-well (100 μL/well) overnight in triplicate. Each well was added with twenty microliters of MTT (#JT343, Genview, China) and incubated for 4 h. Moreover, after 100 μL DMSO was added, the value of absorbance at 490 nm wavelength was evaluated via enzyme-connected immune-detector. The cell viability evaluation was conducted with the following formula: the degree of cell viability (%) = value of absorbance (experiment)/value of absorbance (control) × 100%.
Colony formation assay
HCT 116 and RKO cells were digested by trypsin and cell suspension was inoculated in 6-well plate at 400–1000 cells/well for 14 d. Then, the cells were carefully washed upon PBS, processed in paraformaldehyde for 1 h and Giemsa staining for 20 min, which was finally washed for three times, and taken pictures with a fluorescence microscopy system. The number of colonies above 50 cells per colony were observed using fluorescence microscopy system (Olympus, Japan). All experiments are repeated 3 times.
Cell apoptosis assays
HCT 116 and RKO cells were inoculated in a petri dish, digested with trypsin and suspended, and 10 μL Annexin V-APC was added to stain 15 min. Then, the apoptosis rate was detected by FACScan (Darmstadt, USA, Milipole, Germany). At the same time, lentivirus labeled green fluorescent protein (GFP) was detected as shown in Y axis.
Wound healing assay
HCT 116 and RKO cells were cultured in 96-well plates at 2 × 10³/well and substituted with serum-free DMEM medium. Next, the tip of a 200 μL pipette was scratched across the surface of the culture plate. Cellomics (Thermo) was performed to scan the 96-well plate at pre-set time points (0 h, 24 h, 30 h, and 48 h). Finally, the area of cell scratches was photographed using Zeiss microscope (model Axiovert 200).
Cell migration assay
The Transwell chamber kit (3422 corning) consisted of an upper layer and a lower layer, and the lower layer was a 600 μl DMEM containing 30% FBS. Then, HCT 116 and RKO cells were cultured with serum-free DMEM in the upper layer and enclosed with a specific polycarbonate membrane. The Transwell cell was conducted for 24 h at 37°C in order to make the cells migrate to the bottom chamber through the membrane as much as possible. The upper chamber was soaked in 400 μl of 0.1% crystal violet for 5 min and stained for migratory cells on polycarbonate membranes. Subsequently, the cells were photographed and counted under the microscope field of view at 200×.
Animal xenograft experiments
All animal experiments were confirmed and approved by the Ethics and Institutional Animal Care Use Committee of Union Hospital, Tongji Medical College, Huazhong University of Science and Technology (HUST). In addition, the animal experiments were in line with the Guide for Care and Use of Laboratory animals (NIH publication number 85–23, revised at 1996). The 12 6-wk-old nude mice (BALB/c, male) were obtained from Jiesijie Co., Ltd (Shanghai, China) and randomly divided into two groups, shCtrl (n = 6) and shDEPDC1B (n = 6). Then, HCT 116 cells (5 × 10⁶) were transferred into mice subcutaneously and tumor growth was monitored in vivo animal imaging (Perkin Elmer, Luminal LT) on the specified date (22, 25, 29, 32, 36, 40, 41, 47 d). After 47 d, mice were killed and tumor weight was excised. The steps of biological imaging were as follows: first, 10 μL/g D-fluorescein (15 mg/mL) was injected into the abdominal cavity of mice, and then about 15–20 min was observed. A few minutes after anesthesia, the mice were placed under the preclinical living imaging system (Parkin Elmer, LuminaLT, USA). The imaging software included in the imager was used for imaging, the imaging parameters were set, the fluorescence expression in vivo or subcutaneous was observed after adjusting the focal length, and the data were saved and analyzed. In addition, the tumor tissue of mouse transplanted tumor model was stained with Ki67. Ki67 staining was performed routinely.
Analysis of apoptosis-related antibody array
Analysis of apoptosis-related antibody array was quantified through the Human Apoptosis Antibody Array kit (#ab134001, Abcam, USA) in HCT 116 cells.
Statistical analysis
All the statistical analysis processes were conducted via the SPSS software (version 22.0, IBM Corp., Armonk, NY, USA) or GraphPad Prism software (version 8.0, GraphPad Inc., CA, USA) using independent Two-tailed Student’s t-test or one-way analysis of variance. All data from the experiments are presented as mean ± SD. When P < 0.05, the difference was statistically significant.
Results
DEPDC1B is upregulated in CRC
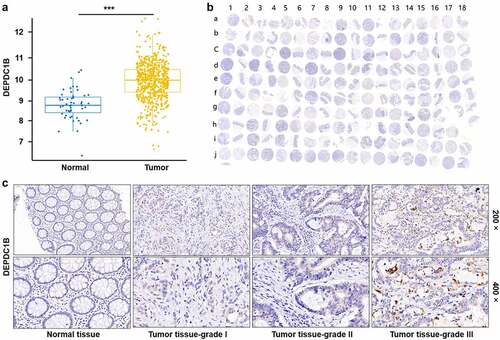
The expression profile of DEPDC1B in CRC was analyzed based on 635 tumor and 51 normal samples in The Cancer Genome Atlas (TCGA) database, founding that DEPDC1B expression in tumor was significantly higher than that in normal (). Furthermore, the expression level of DEPDC1B was explored by the tissue microarray (TMA) with 180 samples, including 99 CRC and normal adjacent control tissue (). Consistently, the results of IHC indicated that the staining intensity of DEPDC1B in tumor tissue was stronger than that in normal adjacent tissue. As a consequence, the expression level of DEPDC1B was higher in tumor tissues relative to normal adjacent tissues (). These data indicated that DEPDC1B was upregulated in CRC samples. Furthermore, the biological function of DEPDC1B in CRC cell lines was assessed in vitro and in vivo.
Figure 1. DEPDC1B is highly expressed in CRC. (a) The expression profile of DEPDC1B was analyzed based on 635 tumor and 51 normal samples in The Cancer Genome Atlas (TCGA) database. (b) 99 CRC samples and 81 adjacent normal tissues constituted a tissue microarray (TMA). The whole scanned image of the TMA by IHC of DEPDC1B in CRC and compared normal colorectal tissue. Scale bar, 1 mm. The odd column corresponds to the tumor tissue, and the even column corresponds to the normal tissue adjacent to the cancer. The row of letter J and I15–18 correspond to tumor tissue. (c) Representative images of IHC staining of DEPDC1B in normal tissue and tumor tissue of CRC patients.
Construction of DEPDC1B knockdown and overexpression CRC cell models
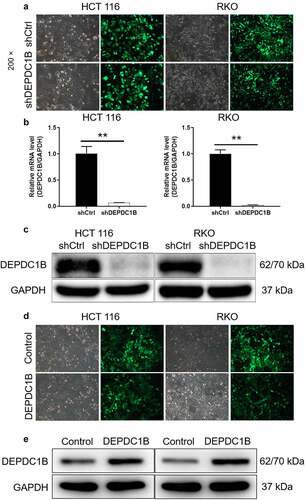
The knockdown and overexpression of DEPDC1B in CRC cell lines were constructed using small hairpin RNA (shRNA) interference. Here, shDEPDC1B referred to knockdown of DEPDC1B in CRC cell lines and shCtrl was recognized as a control. The pictures under the microscope field showed that the high proportion of cells with GFP indicated that the lentivirus was successfully transfected (). Meanwhile, the mRNA and protein expression of DEPDC1B in lentivirus transfected CRC cells were separately measured by PCR and western blot. Compared with shCtrl, the relative mRNA expression of DEPDC1B in HCT 116 and RKO cells of shDEPDC1B group was decreased by 97.6% and 93.2%, respectively (). Moreover, the protein expression of DEPDC1B was downregulated in HCT 116 and RKO cells after shDEPDC1B transfection (). Similarly, we constructed HCT 116 and RKO cells with DEPDC1B overexpression. As shown in , GFP was present in most cells indicating successful lentiviral transfection. Moreover, WB results showed that the protein overexpression in DEPDC1B group was significantly higher than that in the control group, indicating that the cell overexpression was well established (). Collectively, the above results suggested that knockdown and overexpression of DEPDC1B in HCT 116 and RKO cells were successfully constructed, respectively.
Figure 2. Construction of CRC cell model with DEPDC1B knockdown and overexpression. (a) After 72 h post-infection, infection efficiency was detected by green fluorescent protein (GFP). (b-c) The specificity and effectiveness of LV-regulated DEPDC1B knockdown was confirmed by qRT-PCR (b) and Western blot (c). (d) After lentivirus DEPDC1B infected cells for 72 h, the infection efficiency was detected by GFP. (e) The specificity and effectiveness of LV-regulated DEPDC1B overexpression was confirmed by Western blot. The results are available in terms of mean ±standard deviation (SD). P < 0.05 was statistically significant, the meaning of the symbol as follows: ** P < 0.01.
DEPDC1B promotes CRC proliferation and colony activity
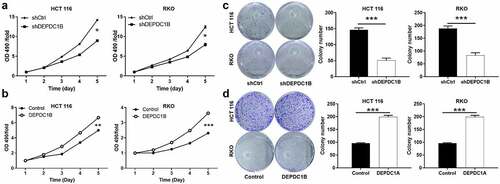
Loss/gain assays in vitro were performed to clarify the biological function of DEPDC1B in CRC cell lines. As we all know, cell viability and clone ability were important features of malignant tumor. Here, MTT assay and Colony formation assay were performed to evaluate the effect of DEPDC1B on CRC cell proliferation. The results of MTT revealed that DEPDC1B significantly inhibited cell proliferation after DEPDC1B knockdown in RKO and HCT 116 cells (). In contrast, DEPDC1B overexpression promoted the proliferation of CRC cells (). Moreover, silencing of DEPDC1B significantly dampened the ability of clone formation of CRC cells (). As expected, HCT 116 and RKO cells with DEPDC1B overexpression produced more and larger cell clones (). As a result, our data suggested that DEPDC1B as a potential oncogene may occupy a vital position in the initiation of CRC.
Figure 3. DEPDC1B promotes CRC proliferation and colony activity. (a-b) MTT assay was conducted to measure the effect of DEPDC1B expression on CRC cell proliferation. (c-d) Colony-forming ability was examined in DEPDC1B knockdown and overexpressing HCT 116 and RKO cells. The data were presented in terms of mean ± SD. P < 0.05 was statistically significant, the meaning of the symbol as follows: * P < 0.05, ** P < 0.01, *** P < 0.001.
DEPDC1B attenuates apoptosis sensitivity of CRC cells
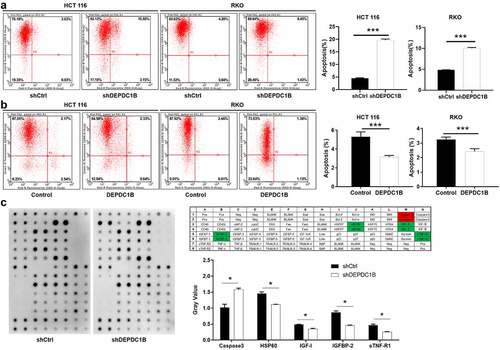
Flow cytometry assay was conducted to measure the effect of alteration in the expression level of DEPDC1B on the apoptotic rate of CRC cells. As shown in , DEPDC1B knockdown significantly increased the level of apoptosis in CRC cells compared with shCtrl. Conversely, the apoptosis sensitivity of HCT 116 and RKO cells decreased significantly after the expression of DEPDC1B was elevated (). Subsequently, the effect of DEPDC1B knockdown in HCT 116 cells on the expression of apoptosis-related proteins was detected by a human apoptosis antibody chip. As shown in , decreased DEPDC1B in CRC cells noticeably elevated the pro-apoptotic protein expression, such as Caspase-3, and strikingly decreased the anti-apoptotic protein expression, such as HSP60, IGFBP-2, IGF-1 and sTNF-R1. To sum up, our results showed that DEPDC1B knockdown significantly elevated the CRC cell apoptosis.
Figure 4. DEPDC1B decreases cell apoptosis of CRC cells. (a-b) Annexin V-APC staining and flow cytometry were used to detect the effect of DEPDC1B expression on the percentage of early apoptosis in RKO and HCT 116 cells. The X-axis indicates apoptosis and the Y-axis represents intensity of the green fluorescence (shDEPDC1B vs shCtrl, DEPDC1B vs Control). (c) Human apoptotic related antibody array analysis was conducted with or without DEPDC1B knockdown in HCT 116 cells. Density analysis showed the gray value of differentially expressed proteins. The data were present as mean ± SD. P < 0.05 was statistically significant, the meaning of the symbol as follows: * P < 0.05, ** P < 0.01, *** P < 0.001.
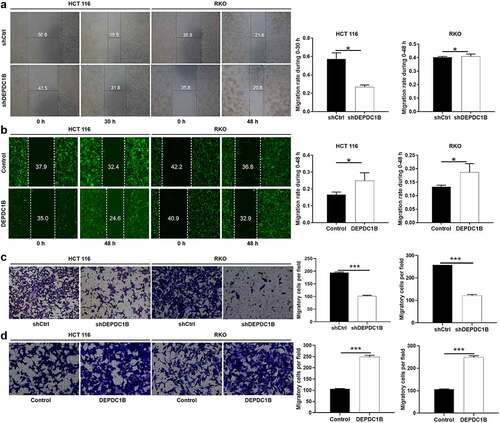
DEPDC1B induces CRC cells migration
In the cell scratch experiment, we found that HCT 116 cells without DEPDC1B knockdown (shCtrl) migrated more faster from the edge of the wound compared with the HCT 116 cells with DEPDC1B knockdown (shDEPDC1B). However, there was no difference between RKO cells with or without DEPDC1B knockdown in wound healing assays (). HCT 116 and RKO cells with increased DEPDC1B expression showed significantly enhanced mobility (). In line with the above results, Transwell assays indicated that DEPDC1B knockdown led to dampened cell migration (). In addition, the migration ability of the cells in the DEPDC1B overexpression group was significantly higher than that in the control group (). Collectively, these results demonstrated a positive role of DEPDC1B in promoting CRC migration.
Figure 5. DEPDC1B facilitates CRC migration in vitro. (a-b) Representative images of wound healing test showed that the cells migrate to the wound. (c-d) Representative images of Transwell analysis. The data were present as mean ± SD. P < 0.05 was statistically significant, the meaning of the symbol as follows: * P < 0.05, ** P < 0.01, *** P < 0.001.
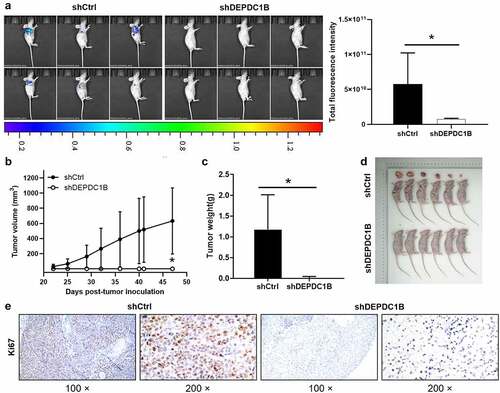
Knockdown of DEPDC1B impaired CRC tumorigenesis in vivo
The above results suggested that DEPDC1B knockdown can mitigate the proliferation of CRC cells and promote apoptosis in vitro. On the basis of the in vitro experiments, we further used the in vivo experiment, and subcutaneously injected HCT 116 cells into nude mice. The tumor growth was detected on the 22, 25, 29, 32, 36, 40, 41, 47 d after injection, and the xenograft tumor model in nude mice was established. The mice were anesthetized 47 d after injection and underwent in vivo imaging. The bioluminescence imaging suggested that tumor growth in shDEPDC1B group was slower than that in shCtrl group (). Moreover, the results revealed that the tumor growth rate of shCtrl was significantly faster than that of shDEPDC1B group (). The average tumor weight in the shDEPDC1B group was lower than that in the shCtrl group (). In addition, the Ki67 intensity in shCtrl group was appreciably higher than that of shDEPDC1B group (). To sum up, the above results revealed that DEPDC1B has a tumor-promoting effect on the development of CRC in vivo, which is in line with the in vitro experimental results.
Figure 6. DEPDC1B knockdown inhibits CRC tumorigenesis in xenograft mice models. (a) The total fluorescence intensity of mice tumors on d 47 was detected in the shCtrl and shDEPDC1B groups. (b) The volume of tumors in shCtrl group and shDEPDC1B group was measured post-injection at 22, 25, 29, 32, 36, 40, 41, 47 d. (c) The average weight of tumors in shCtrl group and shDEPDC1B group and (d) tumor image. (e) Positive Ki67 staining in CRC was observed in the cytoplasm. Scale bars, 100 µm. The data were present as mean ± SD. P < 0.05 was statistically significant, the meaning of the symbol as follows: * P < 0.05.
Discussion
CRC is recognized to be the third most common malignant cancer all over the world, and its morbidity and mortality has risen rapidly in recent years in the Chinese population [Citation26]. The initiation and progression of CRC are complex process of multi-step development, which is the result of the accumulation of several genetic changes [Citation27]. It has been confirmed that the activation of multiple signal pathways contributes to cancer progression, including cell proliferation, invasion, apoptosis, and angiogenesis [Citation28]. Therefore, several novel targeted drugs are developed and utilized to extend OS and DFS for advanced tumor patients [Citation29]. For instance, specific antibodies targeting epidermal growth factor receptor (EGFR) have been widely developed in the clinical treatment of CRC patients [Citation30]. Although the development of specific targeted drugs has prolonged the survival time of patients with CRC, it is still not satisfactory for patients with advanced CRC. Therefore, it is still meaningful to explore novel and effective targeted gene to improve diagnostic and therapeutic management of CRC.
DEPDC1B, as a novel gene, localized at human chromosome 5q12.1 region, and initially identified by mRNA sequence profiling in human breast cancer cells [Citation22]. It is reported that DEPDC1B is highly expressed in placenta and testis, but less in heart and small intestine [Citation22]. Recently, Figeac et al. reported that DEPDC1B was a key regulator of myoblast proliferation in mice and humans [Citation23]. In addition, DEPDC1B is overexpressed in several human cancers, including breast cancer and lung cancer, and also regulates key biological cellular functions, such as proliferation, migration and invasion [Citation24,Citation25,Citation31,Citation32]. For example, Lai et al. demonstrated that DEPDC1B promoted tumor formation in bladder cancer [Citation33]. Moreover, DEPDC1B was involved in the development and progression of glioblastoma, which may be a potential therapeutic target and bring a breakthrough in the treatment [Citation31]. Furthermore, DEPDC1B may serve as an oncogene that contributes to pancreatic ductal adenocarcinoma cell migration and invasion by inducing EMT via Akt/GSK3β/Snail pathway activation [Citation34]. However, based on the available documents, there is insufficiency on the research of the association between DEPDC1B and CRC. Thus, as far as we know, this present study is the first time to elucidate the function of DEPDC1B in the CRC development.
In this study, DEPDC1B expression in CRC was assessed based on database and TMA, founding that the level of DEPDC1B in CRC was higher than that in para-cancerous counterparts. However, due to the lack of detailed follow-up information of clinical CRC patients, the analysis of the correlation between DEPDC1B expression level and prognosis of CRC patients was not clear yet, which resulted in the limitations of this study. Therefore, we will pay attention to obtaining more and more detailed clinical samples in the future to determine the relationship. Of course, high expression of DEPDC1B in CRC suggested that DEPDC1B may play an important role in CRC, which required to be verified by further experiments. As a consequence, loss/gain assays in vitro were performed to clarify the biological function of DEPDC1B in CRC cell lines.
As we all know, dysregulation of cell proliferation and migration is a typical feature of cancer cells. Accordingly, knockdown and overexpression of DEPDC1B were performed in CRC cell lines to assess the effects on proliferation, apoptosis and migration. As expected, our data revealed that DEPDC1B was involved in the promotion of CRC progression by driving proliferation, migration, tumor formation and inhibition of apoptosis. In addition, decreased DEPDC1B in CRC cells noticeably elevated the pro-apoptotic protein expression, such as Caspase-3, and strikingly decreased the anti-apoptotic protein expression, such as HSP60, IGFBP-2, IGF-1 and sTNF-R1. However, the specific molecular mechanism by which DEPDC1B regulated apoptosis-related proteins in CRC cells had not been elucidated. Therefore, we will focus on exploring the molecular mechanism of DEPDC1B regulating the progression of CRC to verify the results of this study.
To sum up, this study provided convincing evidence for the first time that DEPDC1B protein was highly expressed in CRC and exhibited a role as an oncogene in the progression of CRC. Thus, DEPDC1B could be a promising clinical target for identifying potential therapeutic treatment for CRC.
Author contributions
The subject design was completed by Zhaohui Yang and Jun Liu. The operation of the experiment was carried out by Fei Han, Chao Cheng, Qianqian Xu, and Zhaohui Yang. Data analysis by Jisong Chen. Article written by Fei Han completed. The final data review and article review by Zhaohui Yang and Jun Liu.
Disclosure statement
No potential conflict of interest was reported by the author(s).
Data availability statement
The data used and analyzed during the current study are available from the corresponding author on reasonable request.
Additional information
Funding
References
- Navarro M, Nicolas A, Ferrandez A, et al. Colorectal cancer population screening programs worldwide in 2016: an update. World J Gastroenterol. 2017;23(20):3632–3642.
- Bultman SJ. Interplay between diet, gut microbiota, epigenetic events, and colorectal cancer. Mol Nutr Food Res. 2017;61(1):1–12.
- Meester RG, Doubeni CA, Lansdorp-Vogelaar I, et al. Colorectal cancer deaths attributable to nonuse of screening in the United States. Ann Epidemiol. 2015;25(3):208–213 e201. DOI:10.1016/j.annepidem.2014.11.011
- Chittleborough TJ, Kong JC, Guerra GR, et al. Colonoscopic surveillance: quality, guidelines and effectiveness. ANZ J Surg. 2018;88(1–2):32–38.
- Cancer Genome Atlas Network. Comprehensive molecular characterization of human colon and rectal cancer. Nature. 2012;487:330–337.
- Novellasdemunt L, Antas P, Li VS. Targeting Wnt signaling in colorectal cancer. A review in the theme: cell signaling: proteins, pathways and mechanisms. Am J Physiol Cell Physiol. 2015;309:C511–C521. DOI:10.1152/ajpcell.00117.2015
- De Roock W, Claes B, Bernasconi D, et al. Effects of KRAS, BRAF, NRAS, and PIK3CA mutations on the efficacy of cetuximab plus chemotherapy in chemotherapy-refractory metastatic colorectal cancer: a retrospective consortium analysis. Lancet Oncol. 2010;11(8):753–762. DOI:10.1016/S1470-2045(10)70130-3
- Seligmann J. Exploring the poor outcomes of BRAF mutant (BRAF mut) advanced colorectal cancer (aCRC): analysis from 2,530 patients (pts) in randomized clinical trials (RCTs). J Clin Oncol. 2015;33(Suppl):abstr 3509.
- Corcoran RB, Atreya CE, Falchook GS, et al. Combined BRAF and MEK inhibition with dabrafenib and trametinib in BRAF V600–mutant colorectal cancer. J Clin Oncol. 2015;33(34):4023–4031. DOI:10.1200/JCO.2015.63.2471
- Taieb J, Zaanan A, Le Malicot K, et al. Prognostic effect of BRAF and KRAS mutations in patients with stage iii colon cancer treated with leucovorin, fluorouracil, and oxaliplatin with or without cetuximab: a post hoc analysis of the PETACC-8 trial. JAMA Oncol. 2016;2(5):643–653. DOI:10.1001/jamaoncol.2015.5225
- Douillard JY, Oliner KS, Siena S, et al. Panitumumab–folfox4 treatment and RAS mutations in colorectal cancer. N Engl J Med. 2013;369(11):1023–1034. DOI:10.1056/NEJMoa1305275
- Heinemann V, von Weikersthal LF, Decker T, et al. FOLFIRI plus cetuximab versus FOLFIRI plus bevacizumab as first-line treatment for patients with metastatic colorectal cancer (FIRE-3): a randomised, open-label, phase 3 trial. Lancet Oncol. 2014;15(10):1065–1075. DOI:10.1016/S1470-2045(14)70330-4
- Cremolini C, Loupakis F, Antoniotti C, et al. FOLFOXIRI plus bevacizumab versus FOLFIRI plus bevacizumab as first-line treatment of patients with metastatic colorectal cancer: updated overall survival and molecular subgroup analyses of the open-label, phase 3 TRIBE study. Lancet Oncol. 2015;16(13):1306–1315. DOI:10.1016/S1470-2045(15)00122-9
- Sokol S. A role for Wnts in morpho-genesis and tissue polarity. Nat Cell Biol. 2000;2(7):E124–E125.
- Ballon DR, Flanary PL, Gladue DP, et al. DEP-Domain-Mediated regulation of GPCR signaling responses. Cell. 2006;126(6):1079–1093.
- Peck J, Douglas G IV, Wu CH, et al. Human RhoGAP domain-containing proteins: structure, function and evolutionary relationships. FEBS Lett. 2002;528:27–34.
- Burchett SA. Regulators of G protein signaling. J Neurochem. 2000;75(4):1335–1351.
- Wharton KA Jr. Runnin’ with the Dvl: proteins that associate with Dsh/Dvl and their significance to Wnt signal transduction. Dev Biol. 2003;253:1–17.
- Wong HC, Mao J, Nguyen JT, et al. Structural basis of the recognition of the dishevelled DEP domain in the Wnt signaling pathway. Nat Struct Mol Biol. 2000;7:1178–1184.
- Consonni SV, Gloerich M, Spanjaard E, et al. cAMP regulates DEP domain-mediated binding of the guanine nucleotide exchange factor Epac1 to phosphatidic acid at the plasma membrane. Proc Natl Acad Sci. 2012;109:3814–3819.
- Chen S, Hamm HE. DEP domains: More than just membrane anchors. Dev Cell. 2006;11:436–438. DOI:10.1016/j.devcel.2006.09.011
- Boudreau HE, Broustas CG, Gokhale PC, et al. Expression of BRCC3, a novel cell cycle regulated molecule, is associated with increased phospho-ERK and cell proliferation. Int J Mol Med. 2007;19:29–39.
- Figeac N, Pruller J, Hofer I, et al. DEPDC1B is a key regulator of myoblast proliferation in mouse and man. Cell Prolif. 2020 Jan;53(1):e12717.
- Su YF, Liang CY, Huang CY, et al. A putative novel protein, DEPDC1B, is overexpressed in oral cancer patients, and enhanced anchorage-independent growth in oral cancer cells that is mediated by Rac1 and ERK. J Biomed Sci. 2014;21:67.
- Shoumin B, Chen T, Du T, et al. High levels of DEPDC1B predict shorter biochemical recurrence‑free survival of patients with prostate cancer. Oncol Lett. 2017;14:6801–6808.
- Zheng ZX, Zheng RS, Zhang SW, et al. Colorectal cancer incidence and mortality in china, 2010. Asian Pac J Cancer Prev. 2014;15:8455–8460.
- Engelman JA. Targeting PI3K signalling in cancer: opportunities, challenges and limitations. Nat Rev Cancer. 2009;9:550–562.
- Samuels Y, et al. Mutant PIK3CA promotes cell growth and invasion of human cancer cells. Cancer Cell. 2005;7:561–573. DOI:10.1016/j.ccr.2005.05.014
- Bisht S, Ahmad F, Sawaimoon S, et al. Molecular spectrum of KRAS, BRAF and PIK3CA gene mutation: determination of frequency, distribution pattern in Indian colorectal carcinoma. Med Oncol. 2014;31:124.
- Smith CG, Fisher D, Claes B, et al. Somatic profiling of the epidermal growth factor receptor pathway in tumors from patients with advanced colorectal cancer treated with chemotherapy ± cetuximab. Clin Cancer Res. 2013;19:4104–4113. DOI:10.1158/1078-0432.CCR-12-2581
- Chen X, Guo ZQ, Cao D, et al. Knockdown of DEPDC1B inhibits the development of glioblastoma. Cancer Cell Int. 2020 Jul 15;20:310. DOI:10.1186/s12935-020-01404-7
- Yang Y, Liu L, Cai J, et al. DEPDC1B enhances migration and invasion of non-small cell lung cancer cells via activating Wnt/β-catenin signaling. Biochem Biophys Res Commun. 2014;450:899–905.
- Lai CH, Xu K, Zhou J, et al. DEPDC1B is a tumor promotor in development of bladder cancer through targeting SHC1. Cell Death Dis. 2020 Nov 17;11(11):986.
- Liu X, Li T, Huang X, et al. DEPDC1B promotes migration and invasion in pancreatic ductal adenocarcinoma by activating the Akt/GSK3β/Snail pathway. Oncol Lett. 2020 Nov;20(5):146.