
ABSTRACT
Lung cancer has been recognized as the most common malignant neoplasm of the respiratory system with extremely high morbidity, among which non-small cell lung cancer (NSCLC) accounts for the majority. Many published literatures have revealed the roles of GSG2 in the progression of ovarian cancer, bladder cancer and breast cancer. However, there were no reports on the relationship between GSG2 and NSCLC. Herein, GSG2 was identified as a potential tumor promoter in NSCLC development, whose abundant expression was observed in NSCLC tissues compared with adjacent nonmalignant tissues and statistically correlated with more advanced tumor stage, more malignant grade and higher risk of lymphatic metastasis. Subsequent in vitro loss-of-function experiments indicated that GSG2 depletion could arrest cell cycle and suppress cell proliferation and migration while enhancing cell apoptosis. At the same time, the suppressive effects of GSG2 depletion on NSCLC development were verified by in vivo experiments. In conclusion, the current study identified GSG2 as a tumor promoter in development and progression of NSCLC, which could work as a novel therapeutic target for NSCLC.
Introduction
Lung cancer includes small cell lung cancer (SCLC) and non-small cell lung cancer (NSCLC) based on pathological classification, among which NSCLC accounts for approximately 85% of all lung cancer cases. [Citation1]. Over the past decade, the diagnosis and treatment of lung cancer have made epoch-making progress. In addition to the three classical treatments (surgery, radiotherapy and chemotherapy), targeted therapy and immunotherapy have also yielded significant clinical outcomes [Citation2]. Targeted drugs such as Gefitinib, Erlotinib and AZD9291 have greatly improved NSCLC patients’ survival rate. Detection of specific driving gene mutation and acceptance of corresponding molecular targeted therapy make the remission rate of patients with advanced lung cancer as high as 72%, which simultaneously improves patients’ overall survival [Citation3]. However, previous studies suggested that targeted therapies, such as EGFR-TKI approaches, often develop resistance after 8–11 months of treatment [Citation4]. Therefore, continuing to search for the underlying pathogenesis of lung cancer and appropriate therapeutic targets is of great significance for the diagnosis and treatment of NSCLC.
GSG2, also known as Haspin, is the abbreviation of haploid spermatocyte-specific nuclear protein kinase or spermatocyte-specific gene-2. It was initially discovered in mouse testis gene [Citation5]. The C-terminus of GSG2-encoded protein contains a kinase domain different from those of other kinases, thus constituting a new protein kinases family in eukaryotic cells [Citation6]. The N-terminal structure of GSG2 is less conserved in different species and has no definite homology in known domains [Citation7]. GSG2 belongs to serine/threonine kinase, which can specifically phosphorylate H3T3 on nucleosomes during the cell cycle of eukaryotic cells [Citation8]. In mitosis, H3T3 phosphorylated by GSG2 can locate Aurora B at the centromere. Then, Aurora B is activated by recognizing H3T3ph, which facilitates the mid-term arrangement of chromosomes and promotes cell cycle [Citation9]. Recent studies have correlated the expression of GSG2 with tumorigenesis in several cancers, and its small-molecule inhibitor CHR-6494 has shown promising efficacy in breast, colon and cervical cancer [Citation10,Citation11]. Based on the understanding of the mechanism of GSG2’s action in eukaryotic cells and the antitumor mechanism of GSG2 kinase inhibitors, we speculated that GSG2 may also play an important role in the occurrence and development of lung cancer.
This study shed light on the significant relationship between GSG2 expression and NSCLC patients’ pathological parameters including tumor stage, malignant grade and lymphatic metastasis. In addition, short hairpin RNA (shRNA) interference method was employed to silence GSG2 expression in order to evaluate the biological function of GSG2 in NSCLC in vitro and in vivo. Finally, we validated that GSG2 depletion inhibits NSCLC development by regulating PI3K-Akt signaling pathway.
Materials and methods
Tissue collection and ethics statement
All the experimental procedures were performed in accordance with the relevant guidelines and regulations. Human NSCLC tumor tissue and their adjacent nonmalignant tissue microarrays from 538 primary NSCLC patients were provided by Xi’an Alenabio Co., Ltd. (×i’an, Shanxi, China). These patients only underwent tumor resection and no one received any chemotherapy or radiotherapy, and they provided written informed consent before collecting samples. The ethical approval was obtained from the Ethics Committee of Chinese Academy of Medical Sciences and Peking Union Medical College. Detailed clinicopathological data including tumor grade, lymph node metastasis, T Infiltrate and pathological staging were obtained and summarized. The TNM stage was determined with reference to the 8th edition of TNM classification of the Union for International Cancer Control (UICC).
Immunohistochemistry
The tissue was embedded with paraffin and then was baked at 60°C for 30 min. After being dehydrated and rehydrated, citric acid buffer was added for antigen retrieval (120°C for 20 min). The endogenous peroxidase was blocked with 3% H2O2 for 10 min, then all slices were incubated with GSG2 (1:100, bioss, # bs -15,413 R) or Ki-67 (1:200, Abcam, Ab16667) at 4°C overnight. After that, the secondary antibody was added and incubated for 2 h at room temperature. The slides were stained with DAB for 5 min and then dyed again with hematoxylin (Baso DiagnosticsInc., Zhuhai, China) for 10–15 s. Finally, the slides were captured with microscopic and viewed with ImageScope and CaseViewer. All slides were randomly assessed by three independent pathologists. Staining scores were divided into: 1 (1%–24%), 2 (25%–49%), 3 (50%–74%) and 4 (75%–100%). The staining intensity was scored from 0 (no signal color) to 3 (light yellow, brown, and dark brown). IHC results were defined based on staining scores and intensity scores, which specifically include negative (0), positive (1–4), ++ positive (5–8) and +++ positive (9–12).
Construction of plasmid
Knockdown sequences of GSG2, 5′-CCACAGGACAATGCTGAACTT-3′, 5′- AAGGAAACTGGTGGTGGGAAA-3′, 5′-AGGGATTGACTTAGAGCAAAT-3′, were designed by Shanghai Bioscienceres (Shanghai, China). These sequences were inserted into BR-V-108 vector and DNA sequencing analysis was used to confirm the vector expression. EndoFree maxi plasmid kit (Tiangen, Beijing, China) was used for plasmid extraction. 293T cells were infected with the shRNA expression vector and packaging vector using Lipofectamine 2000 transfection reagent (Thermo Fisher Scientific, Waltham, MA, USA).
Cell culture and lentiviral infection
Human lung cancer cell lines A549 and NCI-H1299 were purchased from Cell Resource Center, Shanghai Academy of Life Sciences, Chinese Academy of Sciences (Shanghai, China) in October 2019. At the beginning of the experiment, we performed cell-line authentication by STR analysis. We repeated the identification of cell lines every two months, and before the cells were cryopreserved and after the first week of cell culture, the cells were individually identified. Also, the last time the cell line was tested was in December 2020. F12K medium and 1640 medium both supplemented with 10% fetal bovine serum (FBS) were used for culturing A549 and NCI-H1299 cells in a 37°C 5% CO2 incubator, respectively. After the construction of lentivirus, the lentivirus supernatant was collected to infect A549 and NCI-H1299 cells, followed by culturing for continuous 6 d in the corresponding medium.
RNA extraction and real-time quantitative PCR (RT-qPCR)
After extracting the total RNA according to the manufacturer’s instructions using TRIzol reagent (Sigma, St. Louis, MO, USA), its concentration and purity were evaluated using the OD260 and OD260/OD280 ratio, respectively, and then cDNA was synthesized with M-MLV RT (Promega, United States). RT-qPCR analysis was carried out using a SYBR premix ex taq (Vazyme, Nanjing, Jiangsu, China) on the Biosystems 7500 Sequence Detection system. The sequences of the primers were as follows (5′-3′): The forward and reverse primers of GSG2 were GGAAGGGGTGTTTGGCGAAGT and TGAGGAGCAAGGGAGGGTAAG, those of GAPDH were TGACTTCAACAGCGACACCCA and CACCCTGTTGCTGTAGCCAAA. GAPDH was used as the internal control to calculate GSG2 mRNA levels according to 2−∆∆Ct method.
Western blotting assay
A549 and NCI-H1299 cells were lysed in 1× Lysis Buffer (1 M Tris-HCL (pH 6.8) 50 Mm, 1% mercaptoethanol, 10% Glycerol, 2% SDS and 0.01% bromophenol blue). After electrophoresis, the proteins were transferred to polyvinylidene fluoride (PVDF) membranes (IPVH10010; EMD Millipore, Billerica, MA, USA). The SDS-PAGE electrophoresis system and Western blotting system (cat. no. VE-180 and VE-186; Shanghai Tianneng, Shanghai, China) were used for the subsequent operations. The membrane was immersed with 5% nonfat milk for 1 h with shaking at room temperature to prevent non‑specific binding. Primary antibodies were added overnight at 4°C. The details of all the antibodies were listed in Table S1. Signals were visualized using an ECL-plus/kit system (cat. no. RPN2232; Amersham, Inc., UK). Protein band intensity was measured and normalized to GAPDH by ImageJ software.
Cell proliferation assay
After being smoothly infected with indicated lentivirus, 200 μL A549 and NCI-H1299 cell suspension was seeded into 96-well plates at a density of 2 × 10³ cells/well, dividing into shGSG2 and shCtrl groups. After incubation for another 5 d, 20 μL MTT reagent (cat. no. JT343; Genview, Florida, USA) was added into each well for 1 h to measure the absorbance at 490 nm on a spectrophotometer.
Cell migration assay
The ability of NSCLC cell migration was analyzed using scratch test in vitro. A549 and NCI-H1299 infected with indicated lentivirus were inoculated into 96-well plates. For each of the 96-well plates, images (×50) were obtained after scratches for 0 h, 8 h and 24 h through Cellomics scanner (cat. no. ArrayScan VT1; Thermo Fisher, USA). Mobility is defined as the ratio of cell migration distance at different observation points to the width of the scratch area at “0 h”.
Transwell assay was also used to evaluate the migration levels of NSCLC cells. The specific operation was as follows: A549 and NCI-H1299 cells infected with shGSG2 and shCtrl were cultured in serum-free DMEM medium and then were loaded into the upper chamber. DMEM medium supplemented with 30% FBS was added to the lower chamber as the chemoattractant. The cells in the upper chamber were removed after 24 h of incubation. An inverted microscope (Olympus, Tokyo, Japan) helped to count the five random fields in each chamber after the staining of Giemsa to evaluate the numbers of migrated cells.
Flow cytometry detection of the cell cycle
A549 and NCI-H1299 cell lines after being smoothly infected with shGSG2 and shCtrl were seeded into 6-well plates at a level of 2 × 10⁵ cells/well. Grouping includes shGSG2 and shCtrl. The cells were digested using 0.25% trypsin and centrifuged at 1000 rpm for 5 min to obtain precipitate. Then, 700 μL anhydrous ethanol was added, and the cells were placed in a − 20°C refrigerator for at least 24 h for fixing. Flow cytometry (FACSCalibur; BD Corp., USA) was performed to quantify the percentage of cells in each phase of the cell cycle.
Cell apoptosis analysis
Flow cytometry and Human Apoptosis Antibody Array were used to evaluate cell apoptosis status and mechanism. Stably infected shGSG2 and shCtrl lentiviruses A549 and NCI-H1299 cells were washed twice with cold D-Hanks buffer. Cells were then stained using the Annexin-V-FITC/propidium iodide apoptosis kit (Southern Biotech, Inc., Birmingham, Alabama, USA) referring to the manufacturer’s instructions. Stained cells were detected using Becton-Dickinson FACSCalibur (BD Biosciences). The data were analyzed using FACSCalibur (BD Biosciences, San Jose, CA, USA). Human Apoptosis Antibody Array (cat. no. ab134001; Abcam, Cambridge, UK) was conducted in NCI-H1299 cells. The specific steps were carried out according to the array kit instructions. Signals were visualized using ECL-plus/kit system.
In vivo tumor growth
All animal studies complied with the European Parliament Directive (2010/63/EU) and the ARRIVE guidelines 2.0 (Animal Research: Reporting of In Vivo Experiments), as well as were approved by the Ethics Committee of Chinese Academy of Medical Sciences and Peking Union Medical College. Five mice were assigned to each group. About 4 × 10⁶ NCI-H1299 cells infected with shGSG2 and shCtrl were digested with 0.25% trypsin, and 0.2 mL cell solution was subcutaneously injected into each mouse. Thirty-two days later, we observed obvious tumor and measured the growth indicators of the tumors. Mice were imaged in vivo before being executed: 0.7% pentobarbital sodium (10 μL/g) was intraperitoneally injected into mice for anesthesia. Live fluorescence imaging device (IVIS Spectrum, Perkin Elmer) was performed to observe fluorescence and save data. All nude mice were sacrificed through cervical dislocation on the 46th day to collect tumors.
Statistical analysis
Statistical analyses were carried out using SPSS version 24.0. The association between GSG2 expression and patients’ clinicopathological characteristics was tested using Mann-Whitney U-test and Spearman correlation analysis. Comparisons of continuous data between two groups were carried out using Student’s t test. All values were presented as the mean ± SD from at least three independent experiments or replicates. P < 0.05 was considered statistically significant.
Results
Elevated expression of GSG2 is associated with clinicopathological characteristics of NSCLC patients
GSG2 expression in tumor and adjacent non-tumor tissues was detected by immunohistochemical (IHC) analysis, representing obviously upregulated expression of GSG2 in tumor tissues, as shown in , and GSG2 was mainly expressed in the cytoplasm. The proportion of GSG2 high expression was significantly different between cancerous and adjacent tissues (P < 0.001). In detail, the rate of GSG2 high expression in NSCLC tissues was 53% (285/538), and zero in the para-carcinoma tissues (). According to the data of , the relationship between GSG2 expression and detailed clinicopathological information was analyzed. GSG2 expression was significantly correlated with tumor grade (P < 0.05), lymph node metastasis (P < 0.001), T Infiltrate (P < 0.001) and pathological staging (P < 0.001), which was further confirmed by Spearman rank correlation analysis (). These results indicated that GSG2 was upregulated in NSCLC, and its abundant expression was accompanied by tumor malignancy.
Figure 1. Elevated GSG2 was detected in NSCLC tumor tissues relative to para-carcinoma tissues by immunohistochemical staining analysis.
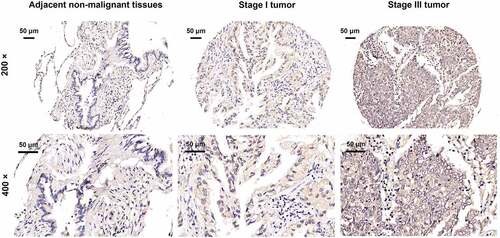
Table 1. Expression patterns of GSG2 in lung cancer tissues and para-carcinoma tissues revealed in immunohistochemistry analysis.
Table 2. Relationship between GSG2 expression and tumor characteristics in patients with lung cancer.
Table 3. Relationship between GSG2 expression and tumor characteristics in patients with lung cancer.
NSCLC cells with downregulated expression of GSG2 were constructed
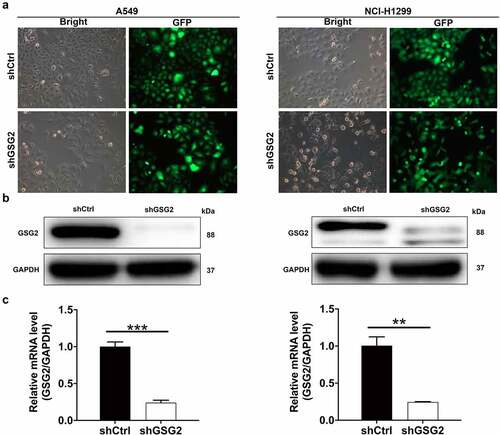
Given that GSG2 expression was upregulated in NSCLC tissues, we then performed shRNA interference to knock down GSG2 in A549 and NCI-H1299 cell lines. Fluorescence of cells demonstrated >80% efficiencies of infection in both A549 and NCI-H1299 cells (). The interference efficiency of shGSG2 was also measured by qRT-PCR and Western blot. Evident downregulation of GSG2 protein expression was detected by Western blot (). Additionally, compared with the negative control cells (shCtrl), GSG2 mRNA levels were significantly reduced by 76% in A549 cells (P < 0.001) and 75.6% in NCI-H1299 cells (P < 0.01) after shGSG2 infection (). As such, A549 and NCI-H1299 cell models with GSG2 depletion were constructed smoothly and used in the following experiments.
Figure 2. NSCLC cell models were established through infecting shGSG2 and shCtrl lentiviruses. (a) The fluorescence levels in A549 and NCI-H1299 cells were measured after 72 h-infection. Magnificationtimes: 200 ×. (b, c) The expression of GSG2 protein and mRNA in A549 and NCI-H1299 cell lines after infection was detected by western blot (b) and qRT-PCR (c). Results were presented as mean ± SD. ** P < 0.01, ***P < 0.001.
Role of GSG2 in proliferation, migration and invasion of NSCLC cells
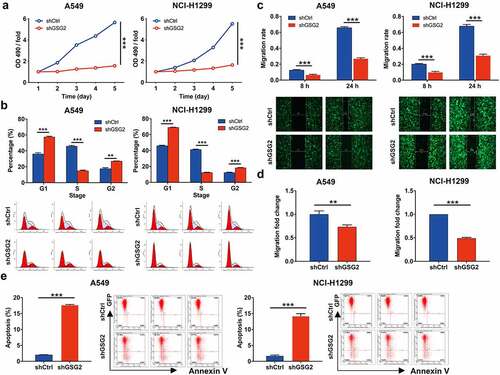
In view of the relationship between GSG2 high expression and tumor malignancy, we speculated that GSG2 may contribute to NSCLC cell proliferation, migration and apoptosis. As expected, the results of MTT assay showed that, compared with shCtrl group, the cells in shGSG2 group exhibited lower proliferation rate (P < 0.001, ). Further cell cycle was detected by flow cytometry, and the percentage of cells in G1 and G2/M phase increased in shGSG2 group of A549 and NCI-H1299 cells, while that in S phase decreased (all P < 0.01, ), which implied that shGSG2 cell division was suppressed. We then explored the effects of GSG2 knockdown on cell migration. The wound-healing assay showed slower cell migration in GSG2-silenced cell lines (). Specifically, the migration rate of cells in shGSG2 group (24 h) was decreased by 59% (P < 0.001) and 55% (P < 0.001) in A549 and NCI-H1299 cells, respectively. Similarly, the transwell assay showed that GSG2 knockdown significantly weakened the migration capacity of A549 and NCI-H1299 cells in vitro, as evidenced by a significant reduction in the average number of cells migrating from the Matrigel-coated membrane (). Furthermore, we operated flow cytometry to assess GSG2-knockdown NSCLC cells’ apoptosis status. The results suggested that the apoptosis level in shGSG2 group was significantly higher than that from shCtrl group in A549 and NCI-H1299 cells (all P < 0.01, ). Overall, GSG2 depletion could arrest cell division and suppress cell proliferation and migration while facilitating cell apoptosis.
Figure 3. GSG2 knockdown inhibited cell proliferation, migration and arrested cell cycle. (a) The cell proliferation level was evaluated in A549 and NCI-H1299 cell lines after infection by MTT assay. (b) The effects of GSG2 knockdown on A549 and NCI-H1299 cell cycle were assessed by flow cytometry. (c, d) The migration rate of cells was detected in NSCLC cell lines after infection by wound-healing assay (c) and transwell assay (d). (e) The effects of GSG2 knockdown on cell apoptosis of A549 and NCI-H1299 cells were examined by flow cytometry. The red-R-fluorescence on the X-axis represented the percentage of apoptotic cells. The Y-axis being marked Green-B fluorescence represented the fluorescence signal of the GFP label on the lentivirus used to infect A549 and NCI-H1299 cells. Results were presented as mean ± SD. ** P < 0.01, ***P < 0.001.
GSG2 promotes tumor growth in vivo
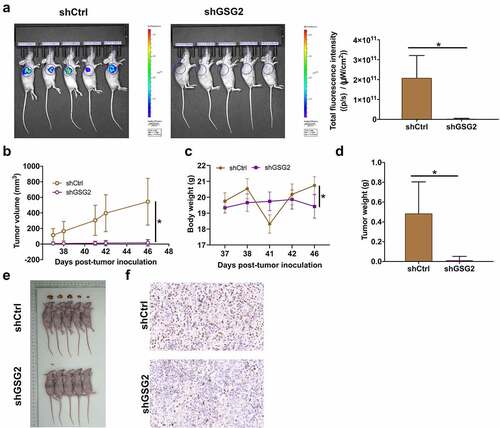
Aiming to further verify the tumor suppression effects of GSG2 knockdown in vivo, both shCtrl and shGSG2 NCI-H1299 cells were subcutaneously injected into mice to establish xenograft models. The total fluorescence expression in shCtrl group and shGSG2 group was 2.08 × 10¹¹ and 0.0429 × 10¹¹ ([p/s]/[μW/cm2]), respectively, and the difference between the two groups was statistically significant (P < 0.05, ). Besides, unlike the rapid increase in tumor volume and body weight in the shCtrl group, the mice in the shGSG2 group did not develop obvious tumors, and the mice were lighter in body weight (). At day 46 post injection, xenografts were removed and weighted, again revealing no observable tumors in shGSG2 group (P < 0.01, ). In addition, Ki-67 levels in tumor tissues were decreased in shGSG2 group as well (). The data of in vivo experiments verified that xenograft growth of NCI-H1299 cells was significantly blocked by silencing GSG2 expression.
Figure 4. GSG2 knockdown suppressed NSCLC tumor growth in vivo. (a) A nude mice model of GSG2 knockdown was constructed. Before sacrificing the mice, the fluorescence intensity was obtained by injecting D-luciferase. (b, c) The tumor volume (b) and body weight (c) were monitored throughout the feeding period until the mice were sacrificed. (d, e) After removing tumors, the tumors were weighed (d) and photographed (e). (f) The expression levels of Ki-67 in tumor sections were detected by IHC. Magnification times: 200×. Results were presented as mean ± SD. * P < 0.05.
GSG2 facilitates NSCLC by regulating PI3K-Akt signaling pathway
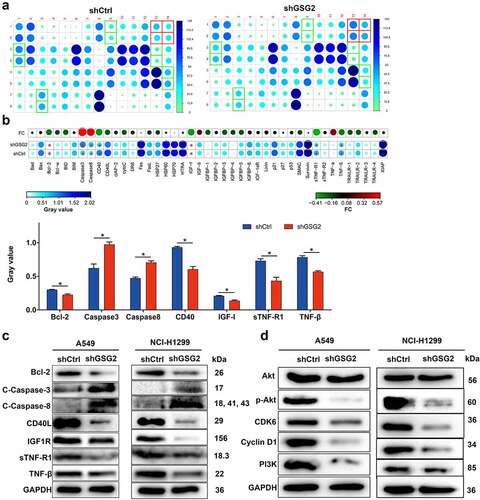
To further investigate the mechanism of GSG2 regulating NSCLC cell phenotypes, we first investigated apoptotic pathway-related targets in NCI-H1299 cells by Human Apoptosis Antibody Array (). The results demonstrated that the expression levels of apoptotic pathway activating proteins including Caspase 3 and Caspase 8 were significantly up-regulated in shGSG2 group, while the expression levels of apoptotic inhibitory proteins (Bcl-2, CD40, IGF-I, sTNF-R1, TNF-β) were significantly down-regulated (). Subsequently, we detected the protein levels of these elements in A549 and NCI-H1299 cells through western blot assay. The data indicated that knocking down GSG2 increased the levels of pro-apoptosis factors C-caspase 3/8 and decreased the expression of anti-apoptosis elements Bcl-2, CD40, IGF-I, sTNF-R1 and TNF-β (). These results were consistent with the apoptotic status of NSCLC cells detected by flow cytometry.
Figure 5. The mechanism of GSG2 regulating NSCLC was investigated. (a) The expression of apoptosis-related proteins in NCI-H1299 cells infected with shGSG2 and shCtrl was measured by ECL with Human Apoptosis Antibody Array. The results circled in red represented that the protein expression was up-regulated and P < 0.05. (b) The expression levels of apoptosis-related proteins were presented in grayscale and visualized by R studio. (c) The levels of apoptosis-associated protein were detected by western blot. (d) The expression of cancer-associated elements, Akt, P-Akt, Cyclin D1, PI3K and CDK6, was detected by western blot. Results were presented as mean ± SD. Results were presented as mean ± SD. * P < 0.05.
As we all know that PI3K-Akt signaling pathway is involved in multiple tumor development [Citation12] and is engaged in cell proliferation, apoptosis and cell cycle regulation [Citation13]. Thus, the levels of Akt, p-Akt, CDK6, cyclinD1 and PI3K were evaluated in both A549 and NCI-H1299 cells after being infected with shGSG2 and shCtrl, illustrating that silencing GSG2 did not obviously alter the total protein level of Akt but diminished the levels of apoptotic pathway-related factors (p-Akt and PI3K) and cell cycle-related elements (cyclinD1 and CDK6) (). Taken together, we concluded that GSG2 could promote NSCLC by regulating the PI3K-Akt signaling pathway.
Discussion
GSG2 was found to be a new potential anti-tumor target and significantly increased in lung carcinoma tissues. The present study indicated that downregulation of GSG2 expression suppressed NSCLC cell proliferation and migration. We then observed similar results in vivo, which demonstrated that GSG2 promotes the development of NSCLC as an oncogene. In addition, we validated that GSG2 mediates NSCLC development by regulating PI3K-Akt signaling pathway. Thus, GSG2 may help develop new treatment strategies for NSCLC patients.
With the exploration of molecular mechanism of cancer, targeted therapy has made tremendous achievements in clinical practice. Targeted therapy is highly recommended due to the increased overall survival rate of cancer patients. Till this moment, the most prominent targeted reagent for NSCLC treatment is TKI kinase inhibitor [Citation14], which appeared powerful therapeutic effects on NSCLC patients via activating EGFR mutation [Citation15,Citation16]. Besides, the representative drugs are gefitinib and oxitinib, which are approved by the Food and Drug Administration (FDA) of the United States as first-line treatment for advanced lung cancer patients with EGFR mutations because of their definite efficacy on patients with lung cancer [Citation17]. On the other hand, recent studies revealed that Haspin (GSG2) kinase is also an important kinase in mitosis, which led to further studies on Haspin kinase inhibition [Citation18]. CHR-6494 has been proved to be a specific and effective inhibitor of Haspin kinase in several types of cancer cells [Citation10,Citation11]. Considering that CHR-6494 might be also an effective inhibitor in NSCLC, we first studied the expression levels of GSG2 and the effects of GSG2 on the apoptosis, proliferation, migration and cycle distribution of NSCLC cells.
In the present study, GSG2 was found to be upregulated in pulmonary carcinoma tissues. Besides, GSG2 expression was related to tumor grade, T stage, lymphatic metastasis and pathologic stage. Thus, GSG2 may serve as a biomarker for NSCLC diagnosis. Based on previous studies, GSG2 depletion in normal human cell lines promotes the premature loss of centromeric cohesion from chromosomes during mitosis and the failure of metaphase chromosome alignment, leading to the activation of spindle assembly checkpoints and the arrest of mitosis. [Citation19]. In mammals, GSG2 is only highly expressed in round spermatids of testis. Overexpression of GSG2 in normal cells prolongs cell entry into metaphase [Citation20]. However, in NSCLC cells, the biological function of GSG2 appears to be different from that in human normal cells. We selected A549 and NCI-H1299 cells for shRNA interference and functional studies. Silencing GSG2 arrested cell cycle and inhibited cell proliferation and migration, while significantly increasing apoptosis percentage.
Each process of cell cycle is regulated by a series of protein kinases. At present, Aurora kinase [Citation21], polo-like kinase (PLK) [Citation22], CDK kinase [Citation23] and Haspin kinase have been found to play an important role in mitosis. Aurora A is associated with the formation of spindles in mitosis, and Aurora B plays a key role in the configuration of chromosomes in metaphase and the separation of sister chromatids in anaphase [Citation24]. PLK1 regulates cell reentry into cell cycle after passing DNA damage checkpoint. In human malignant melanocytoma, PLK-1 is overexpressed and has become one of the targets for the treatment of melanoma [Citation25]. Just as mitotic kinases PLK1 and Aurora A/B, GSG2 activity in cells must be maintained within a certain level. However, the mechanism by which GSG2 regulates NSCLC cell cycle is unknown. Since histone H3 is the only physiological substrate of Haspin/GSG2 kinase identified so far [Citation9], we speculate that knockdown of GSG2 may cause a reduction in H3T3ph level and a series of disasters during mitosis, eventually arresting cells in G2 phase.
Here, we found that GSG2 might induce NSCLC development by activating PI3K/Akt signaling pathway. AKT, also known as PKB, is a serine/threonine protein kinase in the PI3K-Akt signaling pathway. When activated by PI3K, AKT has anti-apoptosis effects and promotes invasion and metastasis of tumors [Citation26]. PI3K, which consists of regulatory subunit p85 and catalytic subunit p110, is an intracellular phosphatidylinositol kinase [Citation27]. Our study showed that the expression of PI3K and p-Akt was downregulated by knockdown of GSG2. From these data, we hypothesized that GSG2 depletion might inhibit malignant progression of NSCLC through the regulation of PI3K-Akt signaling pathway.
Based on previous studies and our results, GSG2 is not only a biomarker but also may be a potential target in NSCLC. Based on the structural and functional characteristics of haspin kinase, the inhibitor of haspin kinase, CHR-6494, was obtained by high throughput screening, which can specifically target haspin kinase [Citation28]. At the cellular level, this haspin-specific small-molecule inhibitor makes cells stagnate in G2/M phase and then induces cell apoptosis. Experiments in vivo also showed its anti-tumor potential, and there was no obvious toxicity to normal tissues [Citation11,Citation29]. However, there are currently no studies on CHR-6494 in lung cancer. Further experiments are required to confirm whether the inhibitor of haspin/GSG2 kinase mentioned above is useful in NSCLC.
Finally, although our current research provides important and constructive findings, the exact mechanism of GSG2 overexpression in NSCLC cells remains unknown. In addition, we have not yet determined the relationship between GSG2 expression and the prognosis of NSCLC patients. In addition, more studies are needed to support the promotion role of GSG2 in NSCLC. These knowledge will, in turn, provide a theoretical basis for new strategies for the diagnosis and treatment of NSCLC.
Author contributions
Bin Qiu, Shugeng Gao and Jie He designed this research. Hao Zhang and Peng Song operated the cell and animal experiments. Nan Sun, Lixia Yin and Yibo Gao conducted the data processing and analysis. Fan Zhang and Ying Ji completed the manuscript which was reviewed by Liang Zhao, Fang Lv and Qi Xue. All the authors have confirmed the submission of this manuscript.
Supplemental Material
Download Zip (26 KB)Acknowledgement
This work was financially supported by CAMS Initiative for Innovative Medicine (CAMS-I2M) [2017-I2M-003] and Beijing Hope Run Special Fund of Cancer Foundation of China LC2017B20.
Disclosure statement
No potential conflict of interest was reported by the author(s).
Supplementary material
Supplemental data for this article can be accessed online at https://doi.org/10.1080/15384101.2022.2110441
Additional information
Funding
Related Research Data
References
- Siegel RL, Miller KD. Cancer statistics, 2019. A cancer journal for clinicians. 2019;69:7–34.
- Naylor EC, Desani JK, Chung PK. Targeted therapy and immunotherapy for lung cancer. Surg Oncol Clin N Am. 2016;25:601–609.
- Tessmer A, Kollmeier J. Treatment of advanced non-small-cell lung cancer with driver mutations. Deutsche Medizinische Wochenschrift 1946. 2015;140(5):140.
- Ko JL, Lin CH, Chen HC, et al. Effects and mechanisms of betulinic acid on improving EGFR TKI-resistance of lung cancer cells. Environmental toxicology. 2018;33:1153–1159.
- Tanaka H, Yoshimura Y, Nozaki M, et al. Identification and characterization of a haploid germ cell-specific nuclear protein kinase (Haspin) in spermatid nuclei and its effects on somatic cells. J Biol Chem. 1999;274(24):17049–17057.
- Higgins JM. The Haspin gene: Location in an intron of the integrin αE gene, associated transcription of an integrin αE-derived RNA and expression in diploid as well as haploid cells. Gene. 2001;267(1):55–69.
- Yoshimura Y, Tanaka H, Nozaki M, et al. Nested genomic structure of haploid germ cell specific haspin gene. Gene. 2001;267:49–54.
- Dai J, Sultan S, Taylor SS, et al. The kinase haspin is required for mitotic histone H3 Thr 3 phosphorylation and normal metaphase chromosome alignment. Genes Dev. 2005;19(4):472–488.
- Wang F, Dai J, Daum JR, et al. Histone H3 Thr-3 phosphorylation by Haspin positions Aurora B at centromeres in mitosis. Science. 2010;330(6001):330.
- Amoussou NG, Bigot A, Roussakis C, et al. Haspin: a promising target for the design of inhibitors as potent anticancer drugs. Drug Discov Today. 2018;23(2):409–415.
- Huertas D, Soler M, Moreto J, et al. Antitumor activity of a small-molecule inhibitor of the histone kinase Haspin. Oncogene. 2012;31:1408–1418.
- Martini M, De Santis MC, Braccini L, et al. PI3K/AKT signaling pathway and cancer: an updated review. Ann Med. 2014;46(6):372–383.
- Jafari M, Ghadami E, Dadkhah T, et al. Pi3k/akt signaling pathway: erythropoiesis and beyond. J Cell Physiol. 2019;234(3):2373–2385.
- Wu YL, Zhou C, Hu CP, et al. Afatinib versus cisplatin plus gemcitabine for first-line treatment of Asian patients with advanced non-small-cell lung cancer harbouring EGFR mutations (LUX-Lung 6): an open-label, randomised phase 3 trial. Lancet Oncol. 2014;15(2):213–222.
- Wang B, Jiang H, Wang L, et al. Increased MIR31HG lncRNA expression increases gefitinib resistance in non-small cell lung cancer cell lines through the EGFR/PI3K/AKT signaling pathway. Oncol Lett. 2017;13:3494–3500.
- Tebbutt N, Pedersen MW, Johns TG. Targeting the ERBB family in cancer: Couples therapy. Nat Rev Cancer. 2013;13(9):663–673.
- Cho BC, Chewaskulyong B, Lee KH, et al. Osimertinib versus Standard of Care EGFR TKI as first-line treatment in patients with EGFRm advanced NSCLC: FLAURA Asian subset. J Thorac Oncol. 2019;14(1):99–106.
- Balboula AZ, Nguyen AL. Haspin kinase regulates microtubule-organizing center clustering and stability through Aurora kinase C in mouse oocytes. J Cell Sci. 2016;129(19):3648–3660.
- Dai J, Kateneva AV, Higgins JM. Studies of haspin-depleted cells reveal that spindle-pole integrity in mitosis requires chromosome cohesion. J Cell Sci. 2009;122(22):4168–4176.
- Higgins JM. Haspin: A newly discovered regulator of mitotic chromosome behavior. Chromosoma. 2010;119(2):137–147.
- Barr FA, Sillje HH, Nigg EA. Polo-Like kinases and the orchestration of cell divisionreviews. Nat Rev Mol Cell Biol. 2004;5(6):429–440.
- Carmena M, Earnshaw WC. The cellular geography of aurora kinases. Nat Rev Mol Cell Biol. 2003;4(11):842–854.
- Champeris Tsaniras S, Kanellakis N, Symeonidou IE, et al. Licensing of DNA replication, cancer, pluripotency and differentiation: an interlinked world? Semin Cell Devl Biol. 2014;30:174–180.
- Andrews PD, Knatko E, Moore WJ, et al. Mitotic mechanics: the auroras come into view. Curr Opin Cell Biol. 2003;15:672–683.
- Schmit TL, Zhong W, Setaluri V, et al. Targeted depletion of polo-like kinase (Plk) 1 through lentiviral shRNA or a small-molecule inhibitor causes mitotic catastrophe and induction of apoptosis in human melanoma cells. J Invest Dermatol. 2009;129:2843–2853.
- Inoki K, Li Y, Zhu T, et al. TSC2 is phosphorylated and inhibited by Akt and suppresses mTOR signalling. Nat Cell Biol. 2002;4(9):648–657.
- Holmes D. PI3K pathway inhibitors approach junction. Nat Rev Drug Discovery. 2011;10(8):563–564.
- Chou TC. Theoretical basis, experimental design, and computerized simulation of synergism and antagonism in drug combination studies. Pharmacol Rev. 2006;58(3):621–681.
- Han L, Wang P, Sun Y, et al. Anti-Melanoma activities of haspin inhibitor CHR-6494 deployed as a single agent or in a synergistic combination with MEK inhibitor. J Cancer. 2017;8:2933–2943.