
ABSTRACT
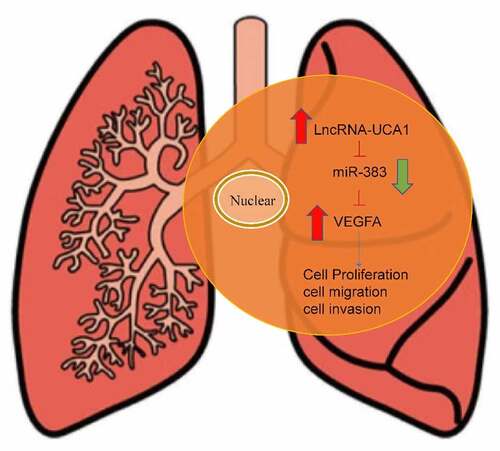
The present study aimed to assess the role of the long non-coding RNA-urothelial cancer associated 1 (lncRNA-UCA1)/microRNA (miR)-383/vascular endothelial growth factor A (VEGFA) axis in regulating lung adenocarcinoma physiology through in vivo and in vitro experiments. The expression profile of lncRNA-UCA1 was analyzed by genome-wide analysis from GSE146459. The cell counting Kit-8, colony formation, wound healing and transwell assays were performed to evaluate the effects of lncRNA-UCA1 in vitro. In addition, luciferase reporter assays were performed to confirm the binding site. The expression levels of miR-383 and VEGFA in tumor cells were measured using reverse transcription-quantitative PCR. HCC-78 was also transfected with miR-383 mimics, inhibitors and siRNA-VEGFA before their viability was also assessed. Xenograft models were established in nude mice to investigate the tumor characteristics in vivo. The expression of lncRNA-UCA1 was significantly increased in tumor tissues and cells compared with adjacent tissues or HBE cells. Silencing lncRNA-UCA1 expression in cells resulted in a reduction in lung cancer cell viability. In addition, lncRNA-UCA1 silencing increased the expression of miR-383. Inhibiting miR-383 expression increased HCC-78 proliferation, migration and invasion, whilst reducing their apoptosis. miR-383 was shown to specifically target VEGFA to inhibit its expression at both the protein and mRNA levels. VEGFA knockdown resulted in a reduction in all aforementioned aspects of HCC-78 cell activity. In addition, inhibiting miR-383 expression led to larger tumor sizes in vivo. To conclude, the results of the study suggest that lncRNA-UCA1 can regulate the expression of miR-383 and, in turn, VEGFA.
Graphical Abstract
Introduction
Lung cancer is a life threatening disease. According to data published by The American Cancer Society, lung cancer has the highest rate of morbidity and the lowest survival rate worldwide [Citation1]. Moreover, lung cancer results in 160,000 deaths and 180,000 newly diagnosed patients according to The World Health Organization in 2012 [Citation2]. This means that lung cancer has high rates of mortality. Patients with lung cancer frequently suffer from breathing difficulties, cough and chest pain, all of which adversely affect their quality of life, making lung cancer a major socioeconomic burden. Non-small cell lung cancer (NSCLC) is the most prevalent subtype of lung cancer, accounting for 80–90% of all cases [Citation3]. In addition, NSCLC is generally divided into three categories: Lung adenocarcinoma, lung squamous cell carcinoma and large-cell lung cancer [Citation3]. The clinical therapeutic approach to lung cancer usually involves excision, chemotherapy and drug therapy. However, treatment outcomes remain unsatisfactory. The poor prognosis of NSCLC is mainly due to chemotherapy resistance and tumor heterogeneity [Citation4]. In addition, the pathological mechanism of lung cancer development remain unclear. Therefore, it is crucial to further understand lung cancer physiology to develop novel and efficient therapeutic strategies for this disease.
Long non-coding RNAs (lncRNAs) and microRNAs (miRNAs/miRs) are non-protein-coding RNA subclasses [Citation5]. MiRNAs are 18–25 nucleotides in length and function by binding to the 3’-untranslated region (UTR) of their target mRNAs, which results in their degradation and subsequent inhibition of protein expression [Citation6]. By contrast, lncRNA is a type of RNA molecule with a transcript longer than 200bp [Citation6]. Until recently, lncRNAs were considered to have limited biological functions. However, recent research findings revealed that this previously neglected RNA subtype can actually regulate a number of cellular processes, including modulation of target gene and genome activity and formation of complexes with proteins [Citation7–10].
The lncRNA-urothelial cancer associated 1 (UCA1) was originally found in bladder tumors [Citation11]. However, recent studies suggest that it can also mediate functions in other types of cancer, including gastric and prostate cancer, which have differential expression profiles [Citation12,Citation13]. In addition, a previous study, which performed a bioinformatics analysis of lncRNA-UCA1, proposed that it may regulate oral squamous cell carcinoma cell activity and viability by sponging miRNAs [Citation14]. miR-383 is a controversial miRNA that is known for its presence and function in cancer tissues, although it was discovered to be aberrantly expressed in lung, hepatic and testicular cancer [Citation15,Citation16]. Therefore, understanding the molecular mechanism underlying the crosstalk between lncRNA-UCA1 and potential miRNAs may be an informative approach to revealing the in-depth mechanism of lung adenocarcinoma.
Vascular endothelial growth factor A (VEGFA) is a member of the platelet-derived growth factor/VEGF growth factor family, rolling in encoding process heparin binding protein, which exists as the dimer. Additionally, VEGF was previously found to be highly expressed in tumors compared with normal tissues, particularly in the lung [Citation17]. There is accumulating evidence suggesting that miRNAs have the ability to modulate the VEGFA signaling process. For instance, Hu et al reported that miRNA-205 can downregulate VEGFA expression, which resulted in the inhibition of breast cancer cell proliferation [Citation18]. However, the molecular function of VEGFA in lung adenocarcinoma remains unclear. Therefore, the aim of the present study was to investigate the role of lncRNA-UCA1, miRNA-383 and VEGFA in lung adenocarcinoma.
Materials and methods
Human tissues
All the lung adenocarcinoma and adjacent tissues used in the present study were obtained from the Air Force Characteristic Medical Center (Beijing, China). The age range of the included patients was 47–78 years old. The patients who participated did not accept any therapy before biopsy. Overall, 84 human lung adenocarcinoma samples and adjacent tissues were obtained, and stored at −80°C until required. The study was approved by the Ethics Committee of Air Force Characteristic Medical Center (Beijing, China; approval no. 2019-120311). Informed consent was provided by patients prior to biopsy. Patient information is shown in Table S1.
In addition, with respect to the low and high expression level of long non-coding (lnc)RNA UCA1, the median expression level was used as the cutoff value. This method is widely used as an unbiased approach without favoring a mathematically optimized cutoff value [Citation19].
Genome-wide analysis
The mRNA microarray dataset, GSE146459 (including 5 cases of lung adenocarcinoma tissues and paracancerous tissues, of which 3 cases are tissues from patients with brain metastases) was obtained from the Gene Expression Omnibus database (http://www.ncbi.nlm.nih.gov/geo/). An Agilent G3 Human GE Microarray (Arraystar, Inc.) was used to analyze the expression profile of lncRNA in 5 lung adenocarcinoma specimens and corresponding adjacent normal tissues. The lncRNA expression level was normalized and significantly differentially expressed genes were selected for further analysis using the criteria of |log2fold change|>1 and P < 0.05 from the Empirical Bayes method.
Cell culture
The human normal HBE lung epithelial cell line and the HCC-78, NCI-H441, Calu-3 and NCI-H1975 lung adenocarcinoma cell lines were purchased from BeNa Culture Collection. The HBE cell line was cultured in complete medium, with 5% dimethyl sulfoxide and 20% FBS. The HCC-78, NCI-H441 and NCI-H1975 cell lines were cultured with complete medium (90% RPMI-1640) and 10% FBS. The Calu-3 cell line was cultured with medium (90% MEM-EBSS) and 10% FBS. The cell lines were maintained at 37°C in a humidified incubator with 5% CO2.
Reverse transcription-quantitative PCR (RT-qPCR)
Total RNA was extracted using TRIzol® (Shanghai Shenggong Biology Engineering Technology Service, Ltd.), according to the manufacturer’s instructions, then quantified using a NanoDrop 2000 spectrophotometer (Thermo Fisher Scientific, Inc.). Subsequently, 200 ng total RNA was reverse transcribed using a ReverTra Ace qPCR RT kit (Toyobo Life Science). Finally, qPCR was performed using a THUNDERBIRD SYBR® qPCR Mix (Toyobo Life Science) and a CFX96 Touch Real-Time PCR Detection System (Bio-Rad Laboratories, Inc.). GAPDH [Citation20–23] and U6 were used as internal reference genes for mRNA/lncRNA and miRNA, respectively. All primer design and synthesis were performed by Sangon Biotech Company. The primers sequences are shown in Table S2.
Cell transfection
The HCC-78 cells were transfected with small interfering (si)-negative control (NC), si-UCA1 (siRNA1 and siRNA2), miR-383 mimics, miR-383 inhibitor, siRNA1+miR-383 inhibitor, si-NC, si-VEGFA, si-VEGFA+miR-383 inhibitor. The miRNA inhibitor is a small, chemically modified single-stranded RNA molecule, designed to specifically bind to and inhibit endogenous miRNA molecules. All the small molecules were purchased from Shanghai GenePharma Co., Ltd. All transfections were performed using Lipofectamine® 2000 (Invitrogen; Thermo Fisher Scientific, Inc.). Briefly, 0.25 μl Lipofectamine 2000 was diluted in 25 μl Opti-MEM followed by incubation for 5 minutes at room temperature. Then 15 pmol of siRNA or inhibitor was diluted in 25 μl of Opti-MEM® I serum-free medium and added to the wells. Finally, 100 μl of antibiotic-free complete growth medium containing 20,000 cells was added to each well containing the RNAi molecule-Lipofectamine® 2000 complex. The transfection time was 48 h. After the transfection, the cells were collected for detection or replaced with complete medium and continued to be cultured and tested. The sequences used are shown in Table S3.
Flow cytometry
Flow cytometry was performed according to the manufacturer’s instructions from a Annexin V-FITC/PI kit (Shanghai Shenggong Biology Engineering Technology Service, Ltd.), 48 h after transfection. The cells in the control group and experimental group were used at the desired cell suspension. A negative control group (normal cells do not add any fluorescent dye reagents) for apoptosis was set for each test to ensure the reliability of the results. Flow cytometry was performed using a FACS Calibur flow cytometer and the data analyzed using FACS Diva software. The experiment was repeated three times.
Cell Counting Kit (CCK)-8 assay
A CCK-8 assay was performed, using siRNA-UCAL-transfected and non-transfected cells seeded, at a density of 8,000 cells per well, in a 96-well plate and cultured in RPMI 1640 medium for 24 h. Next, 10 μl CCK-8 solution (Shanghai Weiao Biotechnology, Co., Ltd.) was added and the cells were incubated for 12, 24, 48 and 72 h, then the OD value was measured using a ELISA Elx800 microplate reader (BioTek Instruments, Inc.) at 490 nm immediately.
Colony formation assay
Transfected or untransfected cells were cultured in a 6-well plate, at an initial density of 150 cells per well for 2 weeks. Then, the cells were fixed with 4% fixing solution and stained with 0.5% crystal violet (Beyotime Institute of Biotechnology) for 15 mins, and washed with water. The number of colonies (>10 cells) were counted after they were dried.
Wound healing and transwell assays
For the wound healing assay, the cells in various groups were seeded in a 12-well plate. Next, wounds were created using a 200 μl pipette after reaching 100% confluence. Then, the cells were washed 3 times with PBS, to remove any floating cells, and serum-free medium was added. Images were captured every 4 h.
For the transwell assay, the cells were prepared, at a density of 5 × 10 [Citation5]/ml in 6-well plate (0.4-μm), then 200 μl was added to the upper chamber. The lower chamber contained 500 μl medium with 10% FBS. The cells were stained with crystal violet after 24 h, then the number of migrated cells were counted.
Xenograft mouse assay
First, the cells were prepared as a cell suspension as previously described, then 36 BALB/c nude mice (4–6 weeks) were divided into 6 groups. The xenograft in vivo assay was approved by the Ethics Committee of Ningxia Medical University (Ningxia Autonomous Region, China). The cells were subcutaneously injected into the posterior flank of the mice, at a concentration of 2 × 10 [Citation5],in each group. On the 7th day, 1 mouse in each group was killed, and the tumor volume was measured, and the remaining 5 mice were used for tumor volume measurement as required. Finally, sodium pentobarbital (intraperitoneal injection, 1,800 mg/kg) was used to kill the animals and subsequent analysis was performed. Tumor weight and volume was measured (the tumor volume in each group did not exceed 300 mm3 and the maximum diameter of a single tumor was 9.63 mm). Furthermore, RT-qPCR was performed to analyze the gene expression level in the tumors.
Luciferase reporter assay
The miRNA target of lncRNA-UCA1 was predicted using the Starbase database (https://starbase.sysu.edu.cn/), and miR-383 was selected as the potential candidate. Then, the mRNA target of miR-383 was predicted using the TargetScan database (http://www.targetscan.org/vert_71/) and VEGFA was selected. The association between the target lncRNA, miRNA and VEGFA was verified using a dual-luciferase reporter assay. First, the 3’-untranslated region of lncRNA-UCA1 and VEGFA, with a specific binding site to miR-383, was cloned into the luciferase reporter vector (Shanghai GeneChem Co., Ltd.). The HCC-78 cells were co-transfected with luciferase reporter plasmids and miR-383 mimics. After 48 h, the cells were harvested, and Firefly and Renilla luciferase activities were measured using a dual-luciferase reporter assay system (Promega Corporation).
Western blot analysis
Total protein was extracted using RIPA solution, then centrifuged to obtain total protein. A BCA protein assay kit (Thermo Fisher Scientific, Inc.) was used to quantify protein concentration, then the protein was separated using SDS-PAGE. The proteins were transferred to a PVDF membrane (Bio-Rad Laboratories, Inc.) at 200 mA for 1 h. Subsequently, the membrane was blocked with 5% skimmed milk for 60 min, and incubated with a primary antibody against VEGFA (cat. no. ab46154; 1:1,000; Abcam) overnight at 4°C with agitation. Following washing, the membrane was incubated with the secondary antibody, anti-rabbit IgG H&L (cat. no. ab6721; 1:1,000; Abcam), for 1 h at 37°C. Finally, the protein bands were developed using a Lab Works 4.5 system after incubation with equal volumes of enhanced chemiluminescence reagents. GAPDH was used as the internal control.
Statistical analysis
All the experimental results are presented as the mean value ± SD. Differences between two groups were compared using a Student’s t-test (paired and unpaired), and a one-way ANOVA followed by a Tukey’s post hoc test was used to compare more than two groups. A paired t-test was used when comparing tumor and adjacent tissues. The median expression level of lncRNA UCA1 was used as the cutoff value [Citation19] to divide patients into high and low expression level groups. A χ2 test, where appropriate, was used to analyze the association between the expression levels of UCA1 and clinicopathological characteristics. P < 0.05 (two-tailed) was considered to indicate a statistically significant difference.
Results
Characterizing the lncRNA-UCA1 expression profile in lung cancer tissues and cell lines
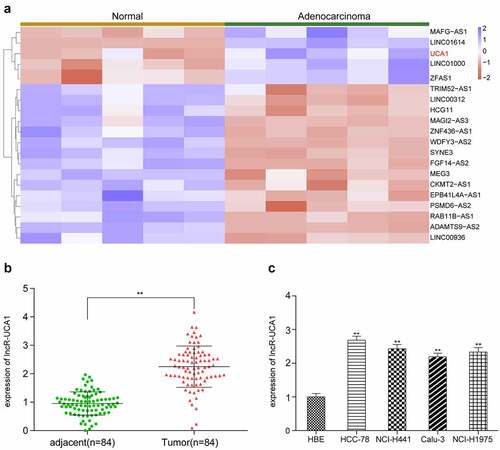
To obtain preliminary data for further study, the top 20 differentially expressed lncRNAs in five lung adenocarcinoma specimens compared with corresponding non-cancerous adjacent tissues were deduced by microarray and analyzed (). First, we tested the 5 lncRNAs (MAFG-AS1, LINC01614, UCA1, LINC01000, ZFAS1) that were significantly up-regulated through preliminary experiments and found that UCA1 had the highest up-regulation fold and the most significant difference. Therefore, this study chose UCA1 as the target molecule for further research (Supplementary Figure S1). In order to further validate the high expression of lncRNA-UCA1 in lung adenocarcinoma tissues, RT-qPCR analysis was performed on 84 patients with lung adenocarcinoma (). It was shown that lncRNA-UCA1 expression was significantly increased in tumor cells in compared with that in normal cells. Subsequently, specific cell lines with high target gene expression were used for in vitro studies. Gene expression was measured in five different cell lines (HCC-78, NCL-H441, Calu-3 and NCI-H1975) (). HCC-78 cells appeared to express lncRNA-UCA1 the most strongly among all the cell lines tested. Therefore, HCC-78 cells were selected for subsequent studies.
Figure 1. Expression profile of lncRnas in lung adenocarcinoma tissues and normal adjacent tissues. (a) Heat map of top 20 differentially expressed lncRnas in lung adenocarcinoma tissues in comparison with normal adjacent tissues, UCA1 is screened out as up regulated in tumors. (b) Gene expression level of lncRNA-UCA1 in tissues analyzed by qRT-PCR, in which a significant increase was observed. **P < 0.01 compared to adjacent group. (c) Expression level of target gene in four lung cancer cell lines, obtained the highest expression from HCC-78. **P < 0.01 compared to HBE cells.
Effects of lncRNA-UCA1 on the proliferation and apoptosis of HCC-78 cells in vitro
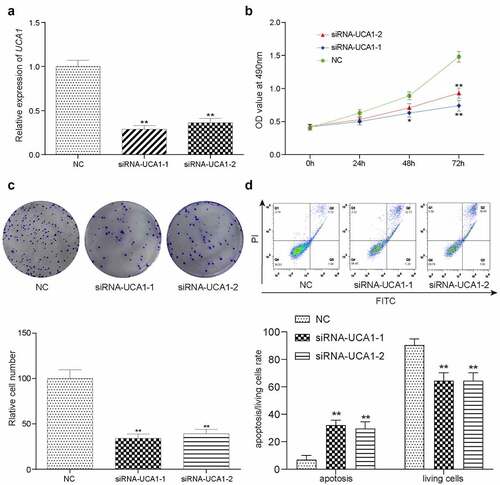
Results from RT-qPCR demonstrated that there was a significant decrease in the expression of UCA1 in both of the siRNA-transfected groups (siRNA1 and siRNA2) compared with that in the negative control (NC) group (), with cells in the lncRNA-UCA1 siRNA group exhibiting the greatest decline. shows the data from the CCK-8 assay, which indicated that HCC-78 cells in the NC group exhibited higher levels of proliferation than siRNA group at 48 h or 72 h (). In addition, data from colony formation assays showed that knocking down lncRNA-UCA1 expression significantly reduced colony, which was accompanied by a significant enhancement in cell apoptosis (). These observations suggested that knocking down lncRNA-UCA1 can directly reduce cell viability.
Figure 2. lncRNA-UCA1 effects on HCC78 cells proliferation and apoptosis. Relative gene expression level of lncRNA-UCA1 in siRNA-lncRNA-UCA1 transfected HCC-78 cells and siRNA-lncRNA-UCA2 transfected HCC-78 cells. The significant decline observed. **P < 0.01 compared to NC group. (b) CCK8 assay result represented by OD value at 490nm in linear graph. Silencing off lncRNA decreases cells proliferation. (c) Colony formation ability of HCC-78 cells with altered expression of lncRNA-UCA1. **P < 0.01 compared to NC group. (d) Apoptotic or living cells rate of HCC-78 cells with altered expression of lncRNA-UCA1. **P < 0.01 compared to NC group.
Assessment of HCC-78 cell migration and invasion after lncRNA-siRNA transfection
To evaluate cell migration and invasion, Transwell and wound healing assays were performed (). In the wound healing assay, significant decreases in the percentage of the width were observed in cells transfected with the lncRNA-UCA1 siRNA, suggesting that silencing lncRNA-UCA1 expression can inhibit the migration of HCC-78 cells. Additionally, according to data from the transwell assay, lncRNA-UCA1 knockdown significantly decreased the cell number compared with the control group, leading to inhibitor in HCC-78 cell invasion. Epithelial-mesenchymal transition (EMT) is an important mechanism of tumor invasion, so we detected EMT markers and found that inhibiting UCA1 could decrease EMT progression ().
Figure 3. lncRNA-UCA1 effects on HCC78 cells migration and invasion abilities. the images and graph for wound healing assay towards HCC-78 cells after silencing lncRNA-UCA1, showing significant decrease in cells migration capability **P < 0.01. (b) Transwell assay of HCC-78 cells altered lncRNA-UCA1 expression, presenting decreased in invasion ability. (c) The expression levels of EMT-related markers in different treatment groups were detected by QRT-PCR. *P < 0.05, **P < 0.01.
Potential association between lncRNA-UCA1 and miR-383
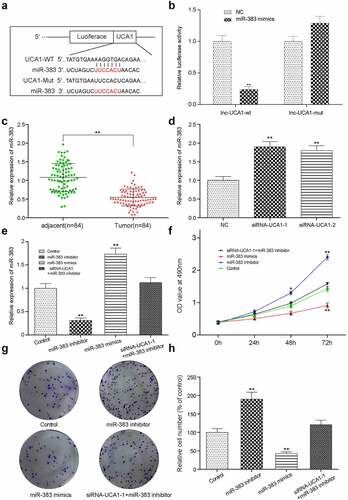
The specific downstream target of lncRNA-UCA1 was predicted using the starBase online tool and miR-383 was screened out as the candidate gene in accordance with affinity (). Subsequent dual-luciferase reporter assay was performed to verify this prediction (). The miR-383 mimic was able to target the predicted binding site of the 3’-UTR from lncRNA-UCA1, leading to the repression of miR-383 expression. Subsequently, evaluation of miR-383 gene expression in clinical tissues was performed by RT-qPCR analysis (). The expression of miR-383 appeared to be significantly decreased in tumor tissues. However, the expression level of miR-383 was significantly increased after lncRNA-UCA1 siRNA transfection.
Figure 4. The targeting relationship between lncRNA-UCA1 and miR-383, and miRNA effects on tumor cells proliferation and apoptosis. (a) Target relationship between miR-383 and lncRNA-UCA1 was predicted by bioinformatics analysis. (b) Luciferase reporter assay validated the target relationship between lncRNA-UCA1 and miR-383, miR-383 mimics significantly inhibit the fluorescence activity of reporter vector carrying the wild-type lncRNA-UCA1, but not the mutant. **P < 0.01 compared with NC group. (c) Gene expression level of miR-383 in cancer and normal tissues, miR-383 has significant low expression in tumor. **P < 0.01 comparison with adjacent group. (d) qRT-PCR analysis for UCA1 silenced HCC-78 cells, the expression level of miR-383 increased significantly after transfection. **P < 0.01 compared with NC group. (e) Validation result of miR-383 mimics increase its expression and miR-383 inhibitor reduce its expression. **P < 0.01 compared with Control group. (f) HCC-78 cells proliferation ability after transfected with different plasmids. Inhibiting miR-383 expression showed the highest in cells proliferations. (g–h) Colony formation assay presented a phenomenon that inhibiting miR-383 was likely to has low apoptosis rate and transfected cells with miR-383 mimics increased apoptosis. **P < 0.01 compared with Control group.
Evaluation of the effects of miR-383 on HCC-78 cell proliferation and apoptosis in vitro
First, we verified the influence of the relevant control group on the expression of miR-383 and UCA1 to provide a basis for further control selection (Supplementary Figure S2). To evaluate the physiological consequences of miR-383 manipulation, HCC-78 cells were transfected with the miR-383 inhibitor, miR-383 mimic or co-transfected with siRNA1 + mRNA-383 inhibitor. Gene expression was subsequently measured using RT-qPCR analysis. HCC-78 cells transfected with the miR-383 mimics showed significantly elevated miR-383 expression levels, whilst a notable reduction was induced following transfection with the miR-383 inhibitor (). HCC-78 cell proliferation was then assessed by using measurements from CCK-8 assay every 24 h to produce a linear graph (). It was found that the HCC-78 cells transfected with the miR-383 inhibitor exhibited the highest levels of proliferation. In addition, HCC-78 cell colony formation was assessed using colony formation assays and the results showed that miR-383 inhibitor transfection resulted in a significant increase in the number of colonies compared with that in control group ().
Assessment of HCC-78 cell migration and invasion after lncRNA and miR-383 transfection
HCC-78 cell migration and invasion were presented as the percentage of width at 0 h and the cell number (), which were obtained from wound healing and transwell assays, respectively. It was revealed that HCC-78 cells transfected with miR-383 inhibitor showed significant increases in both width percentage and cell number, suggesting that this treatment group had the highest migratory and invasive capabilities. This study was used to overexpress miR-383 by transfecting miR-383 mimics. Further analysis showed that both cell migration and invasion were significantly reduced in the miR-383 mimics group compared with the control group. Similarly, we detected the expression of EMT markers (E-cadherin, N-cadherin and vimentin) [Citation24–26]. In the miR-383 inhibitor group, the expression of E-cadherin decreased while the expressions of N-cadherin and vimentin increased. The expression of miR-383 mimic was the opposite. In addition, we found that when siRNA-UCA1 and miR-383 inhibitor were simultaneously transfected, the related expression could be reversed. These results suggest that UCA1 can affect EMT process by regulating the expression of miR-383 ().
Figure 5. miR-383 effects on HCC78 cells migration and invasion abilities. (a)The images and graph for wound healing assay towards HCC-78 cells with miR-383 inhibitor, miR-383 mimics and siRna1+mir-383 inhibitor treatment. Showing a significant increase in cells migration capability from miR-383 inhibitor group. A decrease in miR-383 mimics was also appeared. **P < 0.01 compared with Control group. (b) the transwell assay towards HCC-78 cells for cells treated with same procedures mentioned above, the consistent result was obtained that cells number increased in miR-383 inhibitor group, and decreased in miR-383 mimics group. (c) the expression levels of EMT-related markers in different treatment groups were detected by QRT-PCR. **P < 0.01 compared with Control group.
Relationship between miR-383 and VEFGA
According to the TargetScan database, VEGFA appears to be a target gene of miR-383 due to the high affinity predicted. The potential miR-383 binding site on the VEGFA 3’-UTR is shown in . Dual-luciferase reporter assay was used to verify this observation. miR-383 mimics was used to inhibit VEGFA expression by targeting the predicted binding site on the VEGFA 3’-UTR, with the relative luciferase activity chosen as the standard reference (). shows the expression profile of VEGFA in adjacent healthy tissues and tumor tissues. VEGFA expression in lung adenocarcinoma tissues appeared to be significantly increased compared with that in the adjacent healthy tissues ().
Figure 6. The targeting relationship between miR-383 and VEGFA. (a) Target relationship between miR-383 and VEGFA was predicted by bioinformatics analysis. (b) luciferase reporter assay validated the target relationship between VEGFA and miR-383, miR-383 mimics significantly inhibit the fluorescence activity of reporter vector carrying the wild-type lncRNA-UCA1, but not the mutant. **P < 0.01 compared with NC group. (c) Gene expression level of VEGFA in cancer and normal tissues, VEGFA has significant low expression in tumor. **P < 0.01 comparison with adjacent group. (d) Gene expression level of VEGFA in HCC-78 cells after performed with siRNA1, miR-383 inhibitor, miR-383 mimics and siRna+mir-383 inhibitor transfections. VEGFA expression reduced significantly in siRna1group and miR-383 inhibitor group, while inclined in miR-383 mimics group. **P < 0.01 comparison with control group. (e–f) Protein expression level of VEGFA was evaluated in same condition above, the consistent result was acquired. **P < 0.01 comparison with control group.
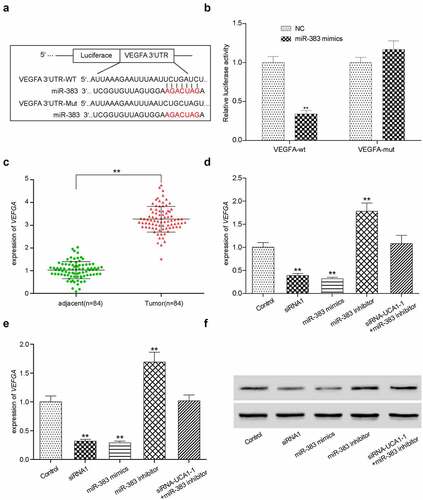
HCC-78 cells were then transfected with lncRNA UCA1 siRNA1, miR-383 inhibitor, miR-383 mimics or co-transfected with siRNA1 + miR-383 inhibitor and divided into different treatment groups. VEGFA mRNA and protein expression was measured using RT-qPCR and western blotting, respectively (). miR-383 mimics transfection significantly downregulated VEGFA expression at both the protein and mRNA levels.
Assessment of HCC-78 cell proliferation, apoptosis, migration and invasion in vitro after si-VEGFA transfection
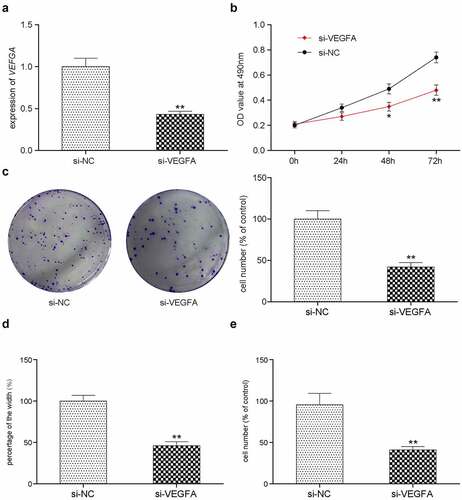
To investigate the role of VEGFA in HCC-78 cell, several assays were performed after cells were transfected with the si-NC and si-VEGFA. VEGFA gene expression was analyzed by RT-qPCR or WB. Compared with the si-NC group, transfection with si-VEGFA significantly reduced VEGFA expression (, Supplementary Figure S2E). Subsequently, transfected tumor cell proliferation was measured using CCK-8 assay (), which showed a decrease in cell proliferation. Colony formation, wound healing and Transwell assays were applied to investigate cell proliferation, migration and invasion, respectively (). Consistent results were obtained in all three assays. si-VEGFA transfection resulted in a significant decrease in cell proliferation, migration and formation ability ().
Figure 7. In vitro effects of VEGFA. (a) Validation of silencing off VEGFA gene decreased its expression. **P < 0.01 comparison with si-NC group. (b) VEGFA silenced HCC-78 cells has lower proliferations in comparison with normal group. (c) Colony formation assay presented a phenomenon that inhibiting VEGFA was likely to has low transfected cells. (d) The wound healing assay towards HCC-78 cells with altered VEGFA gene expression. Showing a significant decrease in cells migration capability from si-VEGFA group. **P < 0.01 comparison with si-NC group. (e) The transwell assay towards HCC-78 cells with altered VEGFA gene expression. A consistent decrease in cells invasion ability in si-VEGFA group. **P < 0.01 comparison with si-NC group.
In vivo study of various transfection treatments
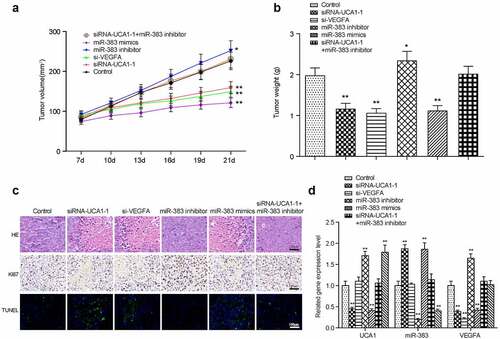
To further validate the role of miR-383, lncRNA-UCA1 and VEGFA in lung adenocarcinoma development, HCC-78 cells transfected with the empty plasmid, lncRNA UCA1 siRNA1 + miR-383 inhibitor, miR-383 mimics, miR-383 inhibitor or si-VEGFA were injected into the mice. Tumor weight and volume were measured and recorded every 7 days (). Mice were sacrificed 21 days later and images of the tumors were captured (). It was found that compared with the control group, inhibiting the expression of lncRNA UCA1 and VEGFA can inhibit tumor growth. However, inhibiting the expression of miR-383 can promote tumor growth. In addition, this promotion was reversed by the low expression of lncRNA UCA1 ().
Figure 8. Xenograft mice model assay. the linear graph exhibited the tumor volumes in different groups (miR-383 inhibitor, miR-383 mimics, siRna1+mir-383 inhibitor, si-VEGFA, siRNA1, Control). (b) Tumors weight in groups mentioned above. (c) HE staining, KI67 staining and TUNEL staining in tumor tissues of each treatment group. (d) The comprehensive study of the gene expression levels of lncRNA-UCA1, miR-383 and VEGFA in mice tumor tissues. N = 5, *P < 0.05, ** P < 0.01 comparison with Control group.
Discussion
The results from the present study suggest that the expression of lncRNA-UCA1, which is located on chromosome (location:19p13.12), is higher in cancer tissues compared with that in normal adjacent tissues. Various assays performed in the present study all showed that knocking down lncRNA-UCA1 expression would likely induce a reduction in lung adenocarcinoma cell proliferation, migration and invasion in vitro, in addition to reducing tumor weight and volume in vivo. These observations suggest that lncRNA-UCA1 can perform key functions in the development of lung adenocarcinoma. Accumulating evidence demonstrated that lncRNAs possess the ability to bind target miRNAs to regulate downstream gene expression [Citation27–29]. It was discovered in the present study that lncRNA-UCA1 can specifically target miR-383 to downregulate its expression. Subsequent investigation found that the expression level of miR-383 was lower in lung tumor tissues compared with that in adjacent healthy specimens [Citation30–32]. In addition, miR-383 appeared to function as a suppressor of cell proliferation, migration and invasion in vitro. These observations were consistent with those made in vivo, where miR-383 mimics was responsible for reducing the tumor size. At present, the expression of miR-383 in lung cancer has been confirmed, but the reasons for its expression changes have not been reported in depth [Citation30–32]. This study is the first to report and verify the regulatory effect of UCA1 on miR-383, which provides new evidence for the alteration of miR-383. In the present study, after demonstrating that lncRNA-UCA1 can downregulate miR-383 expression, VEGFA was found to be a downstream target gene of miR-383. VEGFA is considered to be a potent growth factor [Citation33], The expression level of which was revealed to be high in lung adenocarcinoma, which was, in turn, reduced under conditions of miR-383 overexpression. In addition, tumor cell viability was shown to be reduced after VEGF expression was silenced. Since VEGFA expression is frequently found to be upregulated in cancer tissues, VEGFA may also serve regulatory functions during lung adenocarcinoma development. Data from the present study showed that reducing VEGFA expression is likely to inhibit HCC-78 cell proliferation, migration and invasion in vitro whilst reducing tumor size.
In the present study, miR-383 was revealed to be a target gene of lncRNA-UCA1, with a negative association identified between the expression levels of lncRNA-UCA1 and miR-383 in carcinoma cells. A potential explanation may be provided by findings previously reported by Tian et al regarding the function of miR-383 [Citation34]. According to Tian et al, miR-383 was responsible for the suppression of testicular embryonic carcinoma cell proliferation by interacting with the fragile X mental retardation protein mRNA sequence by binding to its 3’-UTR [Citation34]. The present study also performed in vitro cell-based assays in HCC-78 cells, which found that inhibiting miR-383 expression lead to increased cancer cell activity. Subsequent in vivo assays revealed an increase in tumor weight and volume after knocking down miR-383 expression. These findings suggest that miR-383 exert key functions in lung adenocarcinoma physiology. VEGFA expression was also found to be high in tumor tissues and it may be a target gene of miR-383. HCC-78 cells transfected with the miR-383 mimics and in cells transfected with the lncRNA-UCA1 siRNA appeared to exhibit lower VEGFA expression levels in comparison with those in their corresponding control groups. In addition, cells in the miR-383 inhibitor group exhibited higher VEGFA expression levels. Such findings suggest that VEGFA downregulation may be a protective mechanism mediated by lncRNA-UCA1, which directly combines with the miR-383 to inhibit miR-383 and VEGFA binding. In addition, the role of VEGFA in lung adenocarcinoma was investigated in the present study, in vivo as well as in vitro. Silencing VEGFA expression reduced cancer cell viability, tumor weight and volume. These data are further validation of previous reports and we provide new evidence for the regulatory mechanism of VEGFA [Citation35–37]. Epithelial-mesenchymal transition (EMT) refers to the transition from epithelial to mesenchymal cells that confers the ability to migrate and invade cells, including stem cell characteristics, reduce apoptosis and senescence, and promote immunosuppression. Not only does it play a key role in development, but it is also involved in processes such as tissue healing, organ fibrosis, and carcinogenesis [Citation24–26]. In this study, we detected the expressions of E-cadherin, N-cadherin and vimentin and found that the lncRNA UCA1 could regulate the EMT process by regulating the expression of VEGFA through miR-383, which further deepened our role in the regulation of UCA1 in lung cancer awareness. Further this effect may also explain to some extent the reasons for the changes in the level of apoptosis.
It should be noted that there were several limitations to the present study. Whether VEGFA and miR-383 are the sole components of this signaling network requires further investigation. The downstream targets of VEGFA and how they affect lung cancer progression is also a subject for further studies. The present study focused on the role of the lncRNA-UCA1/miR-383/VEGFA axis in cell and animal models. However, how this pathway affects lung adenocarcinoma clinically remains unclear and requires further study. In addition, it was previously reported that lncRNA-UCA1 serves an important role in gefitinib resistance in NSCLC [Citation38]. Therefore, the in-depth study of the mechanism underlying the involvement of this pathway in the pathophysiology of lung adenocarcinoma will be one of the prospects for further research.
In conclusion, the present study investigated the relationship among lncRNA-UCA1, miR-383 and VEGFA. It was found that lncRNA-UCA1 can regulate lung adenocarcinoma physiology by regulating the expression of miR-383 and, in turn, VEGFA. These results may provide a novel target for the therapy of lung adenocarcinoma and new ideas for the development of novel treatment strategies.
Consent for publication
All presentations of case reports have consent for publication.
Data availability
The datasets used and analyzed during the current study are available from the corresponding author on reasonable request.
Ethics approval and consent to participate
The protocol of this research has been approved by the Ethics Committee of Air Force Characteristic Medical Center (No. 2019-120311) and written informed consent was provided by all patients prior to the start of the study.
Supplemental Material
Download Zip (2.2 MB)Disclosure statement
No potential conflict of interest was reported by the author(s).
Supplementary material
Supplemental data for this article can be accessed online at https://doi.org/10.1080/15384101.2022.2111929
Additional information
Funding
Related Research Data
References
- Nakamura H, Saji H. Worldwide trend of increasing primary adenocarcinoma of the lung. Surg Today. 2014;44(6):1004–1012.
- Bouazza YB, Chiairi I, El Kharbouchi O, et al. Patient-reported outcome measures (PROMs) in the management of lung cancer: a systematic review. Lung Cancer. 2017;113:140–151.
- Zagryazhskaya A, Gyuraszova K, Zhivotovsky B. Cell death in cancer therapy of lung adenocarcinoma. Int J Dev Biol. 2015;59(1–2–3):119–129.
- Yang Y, Ding L, Hu Q, et al. MicroRNA-218 functions as a tumor suppressor in lung cancer by targeting IL-6/STAT3 and negatively correlates with poor prognosis. Mol Cancer. 2017;16(1):141. DOI:10.1186/s12943-017-0710-z.
- Barbagallo C, Brex D, Caponnetto A, et al. LncRNA UCA1, upregulated in CRC biopsies and downregulated in serum exosomes, controls mRNA expression by RNA-RNA interactions. Mol Ther Nucleic Acids. 2018;12:229–241.
- Suh N. MicroRNA controls of cellular senescence. BMB Rep. 2018;51(10):493–499.
- Nie W, Ge HJ, Yang XQ, et al. LncRNA-UCA1 exerts oncogenic functions in non-small cell lung cancer by targeting miR-193a-3p. Cancer Lett. 2016;371(1):99–106.
- Xia E, Bhandari A, Shen Y, et al. lncRNA LINC00673 induces proliferation, metastasis and epithelial-mesenchymal transition in thyroid carcinoma via Kruppel-like factor 2. Int J Oncol. 2018;53(5):1927–1938.
- Pan Y, Wu Y, Hu J, et al. Long noncoding RNA HOTAIR promotes renal cell carcinoma malignancy through alpha-2, 8-sialyltransferase 4 by sponging microRNA-124. Cell Prolif. 2018;51(6):e12507.
- Yu Y, Zhang X, Li Z, et al. LncRNA HOTAIR suppresses TNF-alpha induced apoptosis of nucleus pulposus cells by regulating miR-34a/bcl-2 axis. Biomed Pharmacother. 2018;107:729–737.
- Wang XS, Zhang Z, Wang HC, et al. Rapid identification of UCA1 as a very sensitive and specific unique marker for human bladder carcinoma. Clin Cancer Res. 2006;12(16):4851–4858. DOI:10.1158/1078-0432.CCR-06-0134.
- Zhang S, Dong X, Ji T, et al. Long non-coding RNA UCA1 promotes cell progression by acting as a competing endogenous RNA of ATF2 in prostate cancer. Am J Transl Res. 2017 9(2):366–375.
- Li C, Liang G, Yang S, et al. Dysregulated lncRNA-UCA1 contributes to the progression of gastric cancer through regulation of the PI3K-Akt-mTOR signaling pathway. Oncotarget. 2017;8(55):93476–93491. DOI:10.18632/oncotarget.19281.
- Fang Z, Zhao J, Xie W, et al. LncRNA UCA1 promotes proliferation and cisplatin resistance of oral squamous cell carcinoma by sunppressing miR-184 expression. Cancer Med. 2017;6(12):2897–2908.
- Sun Y, Jin JG, Mi WY, et al. Long noncoding RNA UCA1 targets miR-122 to promote proliferation, migration, and invasion of glioma cells. Oncol Res. 2018;26(1):103–110.
- Zuo ZK, Gong Y, Chen XH, et al. Retracted: TGFβ1-induced LncRNA UCA1 upregulation promotes gastric cancer invasion and migration. DNA Cell Biol. 2017;36(2):159–167.
- Lee S, Kang HG, Choi JE, et al. The different effect of VEGF polymorphisms on the prognosis of non-small cell lung cancer according to tumor histology. J Korean Med Sci. 2016;31(11):1735–1741. DOI:10.3346/jkms.2016.31.11.1735.
- Hu Y, Qiu Y, Yague E, et al. miRNA-205 targets VEGFA and FGF2 and regulates resistance to chemotherapeutics in breast cancer. Cell Death Dis. 2016;7(6):e2291.
- Ye YY, Mei JW, Xiang SS, et al. MicroRNA-30a-5p inhibits gallbladder cancer cell proliferation, migration and metastasis by targeting E2F7. Cell Death Dis. 2018;9(3):410. DOI:10.1038/s41419-018-0444-x.
- Cao Q, You X, Xu L, et al. PAQR3 suppresses the growth of non-small cell lung cancer cells via modulation of EGFR-mediated autophagy. Autophagy. 2020;16(7):1236–1247.
- Chen X, Mao R, Su W, et al. Circular RNA circHIPK3 modulates autophagy via MIR124-3p -STAT3-PRKAA/AMPKα signaling in STK11 mutant lung cancer. Autophagy. 2020;16(4):659–671. DOI:10.1080/15548627.2019.1634945.
- Cruz-Bermúdez A, Laza-Briviesca R, Vicente-Blanco RJ, et al. Cancer-Associated fibroblasts modify lung cancer metabolism involving ROS and TGF-β signaling. Free Radic Biol Med. 2019;130:163–173.
- Walter RF, Werner R, Vollbrecht C, et al. GRB2, RHOA and SDCBP were identified as reference genes in neuroendocrine lung cancer via the nCounter technology. PLoS One. 2016;11(11):e0165181.
- Lüönd F, Sugiyama N, Bill R, et al. Distinct contributions of partial and full EMT to breast cancer malignancy. Dev Cell. 2021;56(23):3203–21.e11. DOI:10.1016/j.devcel.2021.11.006.
- Mak MP, Tong P, Diao L, et al. A patient-derived, pan-cancer EMT signature identifies global molecular alterations and immune target enrichment following epithelial-to-mesenchymal transition. Clin Cancer Res. 2016;22(3):609–620. DOI:10.1158/1078-0432.CCR-15-0876.
- Wang J, Cai H, Liu Q, et al. Cinobufacini inhibits colon cancer invasion and metastasis via suppressing Wnt/β-catenin signaling pathway and EMT. Am J Chin Med. 2020;48(03):703–718. DOI:10.1142/S0192415X20500354.
- Xue M, Pang H, Li X, et al. Long non-coding RNA urothelial cancer-associated 1 promotes bladder cancer cell migration and invasion by way of the hsa-miR-145– ZEB 1/2– FSCN 1 pathway. Cancer Sci. 2016;107(1):18–27.
- Li W, Xie P, Ruan WH. Overexpression of lncRNA UCA1 promotes osteosarcoma progression and correlates with poor prognosis. J Bone Oncol. 2016;5(2):80–85.
- Xue M, Li X, Wu W, et al. Upregulation of long non-coding RNA urothelial carcinoma associated 1 by CCAAT/enhancer binding protein α contributes to bladder cancer cell growth and reduced apoptosis. Oncol Rep. 2014;31(5):1993–2000.
- Ma H, Liu B, Wang S, et al. MicroRNA-383 is a tumor suppressor in human lung cancer by targeting endothelial PAS domain-containing protein 1. Cell Biochem Funct. 2016;34:613–619.
- Mu X, Wu H, Liu J, et al. Long noncoding RNA TMPO-AS1 promotes lung adenocarcinoma progression and is negatively regulated by miR-383-5p. Biomed Pharmacother. 2020;125:109989.
- Yuan Y, Zhou X, Kang Y, et al. Circ-CCS is identified as a cancer-promoting circRNA in lung cancer partly by regulating the miR-383/E2F7 axis. Life Sci. 2021;267:118955.
- Jang K, Kim M, Gilbert CA, et al. VEGFA activates an epigenetic pathway upregulating ovarian cancer-initiating cells. EMBO Mol Med. 2017;9(3):304–318.
- Tian H, Cao YX, Zhang XS, et al. The targeting and functions of miRNA-383 are mediated by FMRP during spermatogenesis. Cell Death Dis. 2013;4(5):e617. DOI:10.1038/cddis.2013.138.
- Liu L, Bi N, Wu L, et al. MicroRNA-29c functions as a tumor suppressor by targeting VEGFA in lung adenocarcinoma. Mol Cancer. 2017;16(1):50. DOI:10.1186/s12943-017-0620-0.
- Qin S, Yi M, Jiao D, et al. Distinct roles of VEGFA and ANGPT2 in lung adenocarcinoma and squamous cell carcinoma. J Cancer. 2020;11(1):153–167.
- Chen CH, Lai JM, Chou TY, et al. VEGFA upregulates FLJ10540 and modulates migration and invasion of lung cancer via PI3K/AKT pathway. PLoS One. 2009;4(4):e5052. DOI:10.1371/journal.pone.0005052.
- Zheng J, Yi D, Liu Y, et al. Long nonding RNA UCA1 regulates neural stem cell differentiation by controlling miR-1/hes1 expression. Am J Transl Res. 2017 9(8):3696–3704.