
ABSTRACT
The regulation and recruitment of γ-TuRCs, the prime nucleator of microtubules, to the centrosome are still thrust areas of research. The interaction of fodrin, a sub-plasmalemmal cytoskeletal protein, with γ-tubulin is a new area of interest. To understand the cellular significance of this interaction, we show that depletion of α-fodrin brings in a significant reduction of γ-tubulin in neural cell centrosomes making it functionally under-efficient. This causes a loss of nucleation ability that cannot efficiently form microtubules in interphase cells and astral microtubules in mitosis. Fluorescence Recovery after Photobleaching (FRAP) experiment implies that α-fodrin is important in the recruitment of γ-tubulin to the centrosome resulting in the aforementioned effects. Further, our experiments indicate that the interaction of α-fodrin with certain pericentriolar matrix proteins such as Pericentrin and CDK5RAP2 are crucial for the recruitment of γ-tubulin to the centrosome. Earlier we reported that α-fodrin limits the nucleation potential of γ-TuRC. In that context, this study suggests that α-fodrin is a γ-tubulin recruiting protein to the centrosome thus preventing cytoplasmic microtubule nucleation and thereby compartmentalizing the process to the centrosome for maximum efficiency. Summary statementα-fodrin is a γ-tubulin interacting protein that controls the process of γ-tubulin recruitment to the centrosome and thereby regulates the microtubule nucleation capacity spatially and temporally.
Introduction
Microtubule organizing centers (MTOCs) have evolved in eukaryotic cells to facilitate the formation and organization of microtubule networks in a regulated fashion [Citation1, Citation2]. These networks provide for cellular integrity and are accountable for various cellular functions such as organelle and macromolecular transport, maintenance of cell shape, signal transduction, and cell proliferation. The key MTOC in mammalian cells is the centrosome [Citation3]. The latter is a complex and ill-defined structure comprising of a pair of centrioles rooted in a matrix of electron dense pericentriolar material (PCM) [Citation4]. Centrosome undergoes duplication during the S phase and then maturation before the onset of mitosis at the end of the G2 phase. The PCM is concentrated with a repertoire of proteins associated with the centrosome. The PCM is dynamic as it undergoes changes in composition and in its expanse during the course of the cell cycle. G1 phase witnesses a small PCM surrounding the centrioles, while at the onset of prophase, a noteworthy increment in the PCM size is observed. This is near simultaneous to the increment in centrosome function observed at the beginning of mitosis [Citation5, Citation6] when the duplicated centrosomes undergo separation. At the onset of mitosis or the prometaphase stage, the PCM engages in the formation of an elaborate network of microtubules called the mitotic spindle. The mitotic spindle is an intricate structure instrumental in the separation of sister chromatids to facilitate the formation of two daughter cells from a parent cell.
Research into the composition of the centrosome and the PCM has revealed that the major component of this matrix is γ-tubulin. γ-tubulin is a relatively recent entrant into the tubulin family of proteins. It is indispensable to microtubule formation in cells [Citation7]. Multiple subunits of γ-tubulin specifically associate with a number of proteins to form macromolecular complexes. These partner proteins are sorted into a common group called the γ-tubulin complex proteins (GCPs). The smallest reported macromolecular complex of γ-tubulin is the γ-tubulin small complex (γ-TuSCs) comprising of γ-tubulin, GCP-2, and GCP-3. γ-tubulin ring complex (γ-TuRC) is a bigger complex consisting of GCP-4, GCP-5, and GCP-6 along with GCP-2 and GCP-3 [Citation8]. A few other interacting partners such as pericentrin/kendrin [Citation9–11], ninein [Citation12, Citation13], CDK5RAP2 [Citation14, Citation15], and GCP-WD/NEDD1 [Citation16] have been stated in the literature to affiliate with the γ-TuRCs to form the extended ring complex. Cytoplasm is a rich pool of γ-TuRCs that are recruited to the centrosome in a timely manner. At the centrosome, γ-TuRCs are anchored on specific PCM proteins like pericentrin and NEDD1 and function as hubs for the creation of a seed or foci. This forms the foundation for the entire microtubule architecture to be built either as a radial array in interphase or as spindles in mitosis.
Fodrin is a non-erythroid homologue of the protein spectrin which maintains the structural integrity of the cytoskeleton [Citation17]. Earlier reports from our lab have revealed the association of fodrin with neuronal γ-TuRCs [Citation18, Citation19]. Fodrin was first discovered in a group of proteins that traveled through axons in neuronal cells. Additionally, they were found to underline the plasma membrane of these cells [Citation20]. Studies on different tissue systems have indicated a widespread presence of this molecule. However, fodrin is most abundant in neuronal tissue. Fodrin upholds the integrity of the plasma membrane in all these cells like its homologue spectrin and also participates in a wide variety of functions such as signal transduction, DNA repair, and apoptosis [Citation21–25]. Analysis of mitosis in context to fodrin done by our group revealed that fodrin is essential for optimal mitotic progression. Further the reduced presence of fodrin presented a number of chromosomal abnormalities followed by mitotic delay [Citation26]. Our turbidometric and electron microscopy experiments have shown that in vitro, fodrin has a regulatory influence on γ-TuRC mediated microtubule nucleation [Citation27]. This brought us to initiate a detailed study on the effect of fodrin in ex vivo condition. We decided to analyze the effects of α-fodrin, a subunit of fodrin, for this study because depletion of the whole molecule had been reported by other group to be embryonically lethal [Citation28]. The present study brings forth the fact that α-fodrin is essential for the enrichment of γ-tubulin at the centrosome. Our analysis also points that α-fodrin may act as a tether to recruit γ-tubulin to the centrosome. Further, this possible regulated recruitment is essential for enhancing the functionality of the centrosome in association with certain other pericentriolar matrix (PCM) proteins.
Results
Reduced γ-tubulin accumulation at the centrosome upon α-fodrin depletion
Immunostaining studies reported earlier from our lab had demonstrated the co-occurrence of γ-tubulin and fodrin at the centrosome in cells of neural lineage such as IMR-32 (neuroblastoma) and U-251 MG (glioblastoma) [Citation18]. Further, in vitro studies have shown that fodrin displays negative regulation of microtubule nucleation [Citation27]. This hints toward a possible role of fodrin in regulating the microtubule formation from the centrosome. Toward analyzing this hypothesis, we downregulated α-fodrin (), a subunit of fodrin, in U-251 MG cells with shRNA A, and then evaluated the presence of γ-tubulin at the centrosome by immunostaining control and fodrin depleted cells. Images are shown in and . For analysis, a constant region of interest (ROI) was drawn around the centrosome demarcated by the γ-tubulin staining in the cells. The mean intensity in this area was evaluated. While control shRNA treated U-251 MG cells showed a normal pattern of γ-tubulin staining at the centrosome, α-fodrin depleted cells displayed about 50% reduced presence of γ-tubulin both in mitosis () and interphase () centrosomes.f
Figure 1. Reduced γ-tubulin at the centrosome upon α-fodrin downregulation. (a). Downregulation of α-fodrin in U-251 MG cells by α-fodrin shRNA (A). (b). Reduction in the centrosomal localization of α-fodrin upon α-fodrin shRNA (A) treatment in U-251 MG cells. (c). Bar graph quantification of the same (n = 52 in control and n = 66 in α-fodrin shRNA treated cells). Confocal images of U-251 MG cells showing the reduction of centrosomal γ-tubulin using shRNA (A) in mitotic (d) and interphase cells (f). (e) (n = 54 in control and n = 52 in by α-fodrin shRNA treated cells) and (g) (n = 96 in control and n = 94 in α-fodrin shRNA treated cells) are the quantitation and box plots showing the reduction respectively. (h) Western blot shows α-fodrin and total cellular γ-tubulin upon downregulation of α-fodrin. I, II and III indicates cells treated with shRNA (A), (B) and (C). β-actin was used as loading control. (i) Denotes quantification of the western blots with shRNA (A) represented in (h). *** denotes extremely significant (p-value < 0.001). Scale bar in (b) denotes 10 µm and scale bar in (d) and (f) denotes 5 µm. The experiment shown in (b) was done three times and experiments shown in (d), (f) and(h) were done five times.
To negate the possibility of the observed effects being off-target effects, we downregulated α-fodrin using different shRNA constructs (; shRNA (B) and (C)). Further, we also analyzed the expression level of total γ-tubulin in cells by western blotting and found that α-fodrin depletion did not significantly change the abundance of total cellular γ-tubulin ( and ). We also checked the centrosomal presence of γ-tubulin by downregulation with a different shRNA construct (shRNA (B), Figure S1 A) and observed a significant reduction in centrosomal γ-tubulin (Figure. S1 B-E) in this case also. This observation is corroborated in IMR-32 cells also where upon downregulation of α-fodrin (Figure. S2 A), the intensity of γ-tubulin at the centrosome (Figure. S2 B-E) was similarly reduced.
Exogenous expression of α-fodrin can recover the effects of α-fodrin downregulation
In order to validate whether α-fodrin caused γ-tubulin reduction in centrosomes, we reinstated α-fodrin into α-fodrin-deficient cells and tested whether much of the effects caused by the deficiency was recovered. Since U-251 MG and IMR32 cells are not very receptive toward transfection procedures and the protein α-fodrin, along with the vector backbone pEGFP, would become approximately 12 Kb, we electroporated cells with pFOD-GFP plasmid and analyzed the centrosome of the GFP expressing cells to understand the level of γ-tubulin. Cells were also electroporated using the same parameters with EGFP plasmid to act as control. ROI analysis of the γ-tubulin intensity at the centrosome indicated that exogenous expression of α-fodrin could retain γ-tubulin at the centrosome ( and ).
Figure 2. Exogenous expression of α-fodrin can recover the effects of α-fodrin downregulation. (a). Confocal images of U-251 MG-γ-tubulin-RFP control shRNA(I)/α-fodrin shRNA(II) treated cells, shRNA α-fodrin treated cells electroporated with pEGFP (III), pFODGFP [(IV), (V)]. After electroporation, cells were plated and allowed to grow before imaging. For comparison, the top two panels were immunostained with fodrin antibody and imaged along with the electroporated ones. Rows (IV) and (V) are different examples for the same condition representing different cells. (b). Bar graph showing the intensity of γ-tubulin at the centrosome in different conditions (n = 93 for control shRNA, n = 120 for α-fodrin shRNA treated cells, n = 95 for α-fodrin shRNA +pEGFP treated cells and n = 49 for α-fodrin shRNA + pFODGFP treated cells). ** indicates very significant (p-value <0.01). *** denotes extremely significant (p-value <0.001). Scale bar denotes 10 µm. The experiment was done twice.
![Figure 2. Exogenous expression of α-fodrin can recover the effects of α-fodrin downregulation. (a). Confocal images of U-251 MG-γ-tubulin-RFP control shRNA(I)/α-fodrin shRNA(II) treated cells, shRNA α-fodrin treated cells electroporated with pEGFP (III), pFODGFP [(IV), (V)]. After electroporation, cells were plated and allowed to grow before imaging. For comparison, the top two panels were immunostained with fodrin antibody and imaged along with the electroporated ones. Rows (IV) and (V) are different examples for the same condition representing different cells. (b). Bar graph showing the intensity of γ-tubulin at the centrosome in different conditions (n = 93 for control shRNA, n = 120 for α-fodrin shRNA treated cells, n = 95 for α-fodrin shRNA +pEGFP treated cells and n = 49 for α-fodrin shRNA + pFODGFP treated cells). ** indicates very significant (p-value <0.01). *** denotes extremely significant (p-value <0.001). Scale bar denotes 10 µm. The experiment was done twice.](/cms/asset/c162ae35-f243-4720-953a-a9da6bb8d558/kccy_a_2119516_f0002_oc.jpg)
These initial experiments showed that α-fodrin is critical for the maintenance of γ-tubulin level in the centrosome of neuroblastoma as well as glioblastoma cell line. Using western blots, we could also understand that the expression level of total γ-tubulin in the cell remained unaltered upon α-fodrin depletion, pointing toward an imperative role of α-fodrin in the recruitment of γ-tubulin to the centrosome. Since the use of both kinds of shRNAs corroborated the same observation, we went forward with the use of α-fodrin shRNA (A) for all the later experiments.
Compromised microtubule regrowth from the interphase centrosome upon α-fodrin depletion
Microtubule formation from the centrosomes is a highly dynamic process. It requires the presence of optimal amounts of γ-tubulin in the form of γ-TuRC at the centrosomes. The cell cytoplasm maintains a rich pool of γ-tubulin and the associated proteins but they are not nucleation-competent. This indicates toward the significance of the centrosome and its components in activating the γ-TuRC for microtubule nucleation. However, the mechanism of this activation is still a matter of research. From the analysis of α-fodrin downregulated cells in earlier experiments, we could infer that the centrosomes of such cells lack optimal amounts of γ-tubulin. We thus looked into the functionality of the centrosome in these cells.
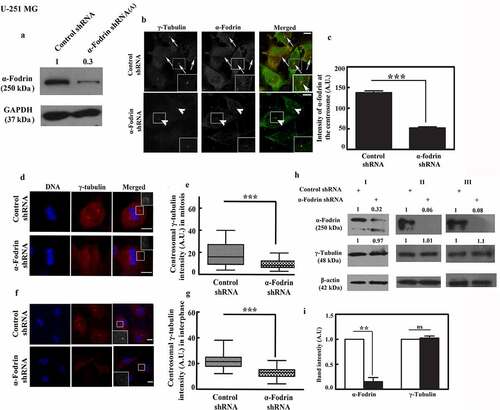
To evaluate the effect of α-fodrin on microtubule nucleation from the interphase centrosome, we depolymerized the microtubules completely in cold temperature and then monitor their regrowth in α-fodrin depleted cells under appropriate conditions. Regrowth of microtubules from the centrosome from scratch utilizing the depolymerized monomeric tubulin is a good parameter to understand the efficiency of the interphase centrosome. Control shRNA transfected U-251 MG cells showed significant regrowth of microtubules from the centrosome post depolymerization and maintained growth till the time limit of the experiment (). However, α-fodrin downregulated cells displayed considerable impairment in regrowth (). Most of the cell microtubules could not grow in the time duration of the experiment. Upon evaluation between 1 and 7 min of growth, it could be concluded that as compared to the control cells, there was about fivefold reduction in the average number of microtubules formed per cell at 7 min post regrowth upon α-fodrin downregulation after taking average from 50 cells in both control and α-fodrin downregulated category. We also found that there was approximately threefold reduction after α-fodrin depletion in the average length of microtubules formed upto 7 min of regrowth ( and ). For better evaluation, we also performed microtubule regrowth upto higher time points, namely, 10, 15 and 30 min. The results were concordant at these time points also (Figure: S3).
Figure 3. Reduced regrowth of microtubules from the centrosomes in α-fodrin depleted cells. Confocal images of U-251 MG cells fixed after 1, 4 and 7 min of regrowth in (a) control shRNA and (b) α-fodrin shRNA treated cells. Bar graph showing the (c) average length of microtubules per cell and (d) average number of microtubules per cell in control shRNA (white bar) and α-fodrin shRNA (black bar) treated cells at 1 and 7 min. ** indicates very significant (p-value < 0.01). Scale bar denotes 5 µm. The experiment was done thrice. n = 50 for control shRNA and n = 50 for α-fodrin shRNA treated cells.
For better understanding, we also did live cell imaging of Tubulin-GFP cells expressing γ-tubulin-RFP. Nocodazole depolymerization followed by time scan of tubulin regrowth showed similar result in cells with downregulated α-fodrin (data not shown).
It could thus be inferred that the centrosome of α-fodrin deficient cells have compromised centrosomal functionality. These centrosomes are under-efficient in forming microtubules. It should be noted at this point that a previous study from our lab [Citation26] had reported no significant change in the expression of total tubulin and actin in α-fodrin depleted cells. Thus, the reduced microtubule network formation is not because of the non-availability of tubulin. This again reinforces that the centrosomes’ impairment in forming microtubules in the interphase is due to the absence of α-fodrin.
Compromised astral microtubule formation after α-fodrin depletion
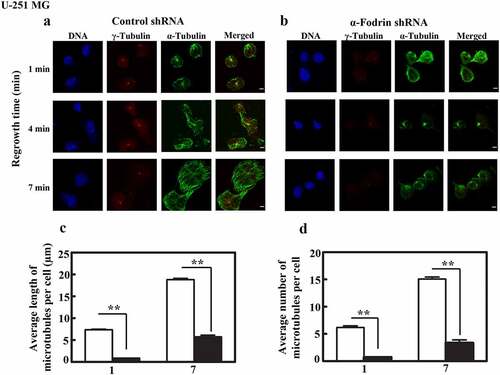
Our next goal was to quantify the centrosome nucleation efficiency in mitosis and validate these findings. A mitotic centrosome is much larger in size when compared to an interphase centrosome. Each mitotic cell carries two such centrosomes as two poles, to form an operational bipolar mitotic spindle. The mitotic centrosome houses three times as much the amount of γ-tubulin than its interphase counterpart. This goes in agreement with the manifolds higher microtubule formation activity by a mitotic centrosome in contrast to an interphase centrosome [Citation5].
The mitotic centrosome gives rise to three different kinds of microtubules, namely the kinetochore microtubules, the polar microtubules and the astral microtubules. The kinetochore microtubules bind to the kinetochore of the chromosomes arranged in the metaphase for an unbiased separation of the chromatids. The polar microtubules move from one pole to the other providing strength to the mitotic spindle. Astral microtubules originate from the centrosome and move toward the cortex of the cell anchoring the two poles in position and they have very important role in spindle separation [Citation29]. The mitotic spindle is a rich hub of proteins and therefore very difficult to analyze. However, astral microtubules are comparatively less dense than kinetochore and polar microtubules and thus are a good read out to judge the microtubule nucleation and formation capability of a mitotic centrosome [Citation30].
Hence to compare the mitotic centrosome activity in control vs α-fodrin depleted cells we chose to analyze the astral microtubules. Mitotic cells immunostained for α-tubulin were imaged. It was observed that the metaphase of control shRNA transfected cells displayed normal bipolar spindles with a good spread of astral microtubules (). However, α-fodrin depleted cells frequently presented anastral spindles (). Such spindles evidently had reduced number and length of astral microtubules. A free-handed ROI was drawn to cover the astral microtubule spread and the mean intensity in this area was calculated which indicated a significant reduction in astral microtubule intensity upon α-fodrin downregulation (). This corroborates with our earlier understanding that α-fodrin is crucial for optimal microtubule formation from the centrosome not just in interphase but also in mitosis. It can be noted here that α-fodrin depleted spindles are smaller. This has been measured and discussed in detail in our earlier reports [Citation26, Citation31]
Figure 4. α-Fodrin is important for the formation of astral microtubules. Confocal images of U-251 MG (a) control shRNA treated cells (b) α-fodrin shRNA treated cells. (c) Bar graph depicting the reduction. *** indicates extremely significant (p-value < 0.001). Scale bar denotes 5 µm. The experiment was done twice. n = 57 for control shRNA, n = 56 for α-fodrin shRNA treated cells.
Requirement of α-fodrin for the efficient recruitment of γ-tubulin to the centrosome
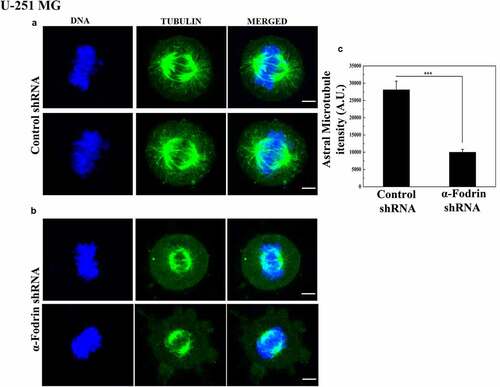
Our experiments so far suggested that α-fodrin depletion resulted in reduced γ-tubulin population at the centrosome, and thereby compromised centrosomal activity. We therefore hypothesized that α-fodrin might be essential in recruiting γ-tubulin to the centrosome. For this, an RFP tagged γ-tubulin expressing U-251 MG line was generated. In order to look into the real-time movement of γ-tubulin, we set out to do fluorescence recovery after photobleaching (FRAP) experiments. γ-tubulin-RFP demarcated the centrosome of the cells. A ROI of 2 pixels was drawn around the centrosome of control shRNA/α-fodrin treated shRNA. The 568 laser line was used at 80% power to bleach the demarcated area significantly. The cells were viable throughout the course of the experiment and therefore were not affected by the bleaching process. The recovery in fluorescence was monitored over a period of 10 min. Images were taken every 30 s. The data were analyzed using ImageJ and GraphPad. Briefly, the intensity of the bleached ROI before and after bleaching was background subtracted in all frames. The data were then normalized using the intensity of a non-bleached centrosome from the same frame to account for the bleaching that might occur during imaging. The experiment was done for 17 control cells and 16 α-fodrin depleted cells. The data from all these individual cells were fit using the single-phase association equation and mean plateau value and half-life of recovery were obtained. Upon α-fodrin downregulation, 42% recovery could be seen in the centrosome as opposed to 54% recovery in control cells. Besides, the half-life of recovery (from the mean fit curve) in control cells was nearly 60 s but in α-fodrin depleted cells the recovery was further delayed with a half-life of nearly 80s (). A FRAP plot with individual error bars is shown in Figure S4 A. Due to technical instrument limitations, we had to increase the bleach time for the centrosome up to 20 s to achieve upto 80% bleaching. This could have very well masked the movement of γ-tubulin to and from the centrosome during the bleach period and the results that we got could be an underestimation both in control and α-fodrin downregulated cells. A major technical limitation in FRAP is the reversible photobleaching of the fluorophore which may be wrongly interpreted as the recovery of the molecule in question. In order to nullify this possibility, we performed FRAP experiment in fixed cells, where we could not observe any recovery either in control shRNA or fodrin shRNA treated cells (Figure. S4 B). Hence, it can be concluded that the recovery observed in the live FRAP experiment is because of the movement of γ-tubulin.
Figure 5. α-Fodrin is vital for the recruitment of γ-tubulin to the centrosome. (a) Fixed frames of the live imaging of centrosome post bleaching showing recovery of γ-tubulin in control shRna/α-fodrin treated cells. (b) Mean fit curve obtained after analyzing the data from 17 control shRNA treated cells (solid line) and 16 α-fodrin shRNA treated cells (dotted line). (c) a table of FRAP parameters evaluated from the mean fit curve. White arrows represent the control cell’s centrosome and white arrowheads indicate the α-fodrin downregulated cell’s centrosome. The experiment was done thrice.
As demonstrated by our photobleaching experiments, the turnover of γ-tubulin to the centrosome is reduced and delayed in α-fodrin downregulated cells. Thus, it is a fair judgment to make that α-fodrin is one of the key molecules to the regulated recruitment of γ-tubulin to the centrosome. Hence, the downregulation of this key molecule results in dysfunctional centrosomes both in interphase and mitosis.
There are several proteins which are also known to have such a role and modify centrosome function such as CDK5RAP2, Pericentrin, Nenein, NEDD1, CEP192, Centrin etc. We thus wanted to check whether fodrin shows its action in association with some of these group of proteins.
α-Fodrin depletion results in reduced presence of pericentriolar matrix proteins (PCM) at the centrosome
CDK5RAP2 (CDK5 Regulatory Subunit Associated Protein 2), the mammalian homologue of centrosomin, a Drosophila melanogaster protein, is a centrosomal protein that has been shown previously to be a regulator of centrosomal microtubule nucleation activity. It contains a centrosomin motif 1 (CM1) with the help of which, it affects the microtubule nucleation activity [Citation14]. Moreover, it is also reported to be important for the recruitment and anchoring of γ-tubulin at the centrosome. It also maintains the pericentriolar matrix (PCM) around centrioles during mitosis and connects centrosome to the spindle poles [Citation32].
It was reported by other groups that downregulation of CDK5RAP2 causes a reduction in the enrichment of γ-tubulin at the centrosome. CDK5RAP2 interacts with γ-tubulin and this association is probably important for the movement of γ-tubulin [Citation15]. We therefore wanted to check whether the centrosomal reduction of γ-tubulin upon α-fodrin downregulation involves CDK5RAP2. Immunostaining of control shRNA and α-fodrin shRNA treated cells for CDK5RAP2 and γ-tubulin showed that there was a simultaneous reduction of both CDK5RAP2 and γ-tubulin at the centrosome upon α-fodrin depletion ().
Figure 6. α-Fodrin is important for the recruitment of CDK5RAP2, Pericentrin and γ-tubulin to the centrosome. (a) Confocal images of U-251 MG cells co-immunostained for CDK5RAP2 and γ-tubulin. Scale bar denotes 5 µm. White arrows represent the centrosome of control shRNA treated cell and white arrowheads indicate the centrosome of α-fodrin shRNA treated cell (b) Bar graph showing the reduction. *** indicates extremely significant (p-value < 0.001). ** indicates very significant (p-value < 0.01). n = 63 for control shRNA and n = 65 for α-fodrin shRNA treated cells. (c) Western blot results showing the co-immunoprecipitation of α-fodrin and CDK5RAP2 (lane 2 and 3). IN signifies input. The experiment was repeated twice. (d) Confocal images of U-251 MG cells co-immunostained for Pericentrin and γ-tubulin. Scale bar denotes 10 µm. (e) Bar graph showing the reduction. **denotes very significant (p-value <0.01) and ****denotes extremely significant (p-value <0.0001). n = 46 for control shRNA and n = 39 for fodrin shRNA treated cells. The experiment was repeated thrice. (f) Western blot result showing immunoprecipitation with α-fodrin (Lane 2). IN signifies input. The experiment was repeated twice.
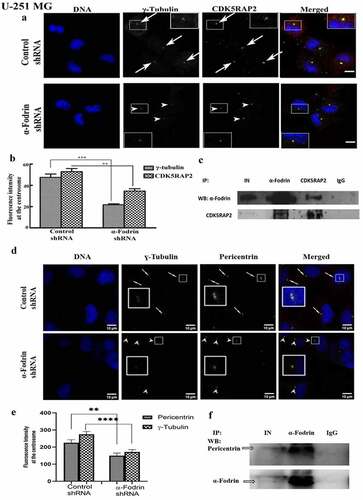
Further, Pericentrin (kendrin) is a centrosomal scaffold protein that recruits proteins to the pericentriolar matrix (PCM) to ensure proper centrosome and mitotic spindle formation, and thus, uninterrupted cell cycle progression [Citation33]. By the interaction with nucleation component γ-tubulin, this protein controls the nucleation of microtubules, thus anchoring the γ-tubulin ring complex to the centrosome. Pericentrin is essential for bipolar spindle formation and chromosome assembly in early mitosis [Citation34]. This ensures normal function and organization of the centrosomes, mitotic spindles, and cytoskeleton, besides regulation over cell cycle progression and checkpoints [Citation34].
We therefore checked whether γ-tubulin reduction prompted by the depletion of α-fodrin is connected with pericentrin. Immunofluorescence measurement of both γ-tubulin and pericentrin in control shRNA and α-fodrin shRNA treated cells showed that there were concomitant decrease of pericentrin in γ-tubulin decreased centrosomes upon α-fodrin depletion ( and ).
α-Fodrin interacts with CDK5RAP2 and pericentrin
The interaction of CDK5RAP2, pericentrin, and α-fodrin with γ-tubulin had been separately reported [Citation14, Citation27]. To analyze the simultaneous reduction of CDK5RAP2, pericentrin, and γ-tubulin upon α-fodrin depletion, we performed an immunoprecipitation reaction in U-251 MG cell lysate with anti α-fodrin antibody and detected CDK5RAP2 and pericentrin ( and ) indicating an interaction between CDK5RAP2 and α-fodrin as well as pericentrin and α-fodrin. A reverse IP with CDK5RAP2 antibody confirmed that indeed CDK5RAP2 and α-fodrin interact with each other (). However, no significant change in the expression level of total cellular CDK5RAP2 upon α-fodrin depletion was found by western blotting (Figure: S5).
We have also checked whether centrin, a calcium binding protein belonging to the calmodulin superfamily [Citation35] has any effect on α-fodrin depletion mediated γ-tubulin reduction in the centrosomes of U-251 MG cells. In cultured human cells, CETN2 is a component of the centrosome, and participates in duplication of centrioles, as well as in primary ciliogenesis [Citation36–38]. Immunofluorescence staining of centrin and γ-tubulin in α-fodrin depleted cells detected significant decrease in both even though there was no co-localization of centrin and γ-tubulin (Figure S6).
We therefore suggest that some centrosomal scaffold proteins interact with fodrin for optimal enrichment of γ-tubulin to the centrosome and maintenance of centrosome function. Further, fodrin recruitment to the centrosome is also likely to be facilitated by these proteins.
Discussion
MTOCs are a diverse class of organelles that perform the basic function of microtubule formation in cells. Centrosome, a primary mammalian MTOC, operates as a collection point for an array of proteins in their functional forms to carry out successful microtubule nucleation. The major protein in this phenomenon is γ-tubulin. The microtubule nucleation-competent form of γ-tubulin, the γ-TuRC, is docked at the centrosome through γ-TuRC anchoring proteins such as pericentrin, GCP-WD/NEDD1, CDK5RAP2. In vitro studies with γ-TuRCs have reported their inability to dock onto the centrosomes by themselves. Hence, the functionality of centrosomes hugely depends on the efficient recruitment and anchorage of γ-tubulin. It is worth mentioning at this point that the centrosome is a non-membranous organelle, and hence the entry and exit of molecules to and from the centrosome has to be made selective and stringent by other mechanisms. This indicates the importance of the γ-TuRC-regulatory proteins. MOZART1 is a protein whose depletion in human cells destabilizes the large γ-tubulin ring complex and abolishes CEP215-induced ectopic MT nucleation [Citation39]. CEP350 is a centrosomal protein required for both the appropriate anchoring and regulation of γ-TuRC activity at the centrosome [Citation40]. TACC3 (Transforming acidic coiled coil) protein helps in the assembly of γ-TuRC from the smaller version, γ-TuSC and thus helps the centrosome achieve its complete nucleation capacity [Citation30]. Fodrin, a cortical plasma membrane lining protein, was reported to associate with neuronal γ-TuRCs [Citation18, Citation19]. We have also shown that purified fodrin interacts with γ-tubulin in the ring complex through its C-terminus and thereby controls the microtubule nucleation activity of the γ-TuRC in vitro [Citation27].
Here, through our experiments on U-251 MG and IMR-32 cells, we have found that a compromise of α-fodrin’s amount delocalizes the γ-tubulin from the centrosome (). In order to authenticate these results, we overexpressed α-fodrin in α-fodrin depleted cells, and found that exogenous α-fodrin could reinstate most of the γ-tubulin back into the centrosome (). As a consequence, the centrosomal microtubule nucleation activity is severely perturbed since γ-tubulin is a key player in microtubule nucleation. Hence, anastral mitotic spindles are frequently seen in α-fodrin depleted cells (). However, at this point, we would like to mention that the reduction in astral microtubules could also be contributed by a possible effect of α-fodrin on microtubule dynamic instability. There are no reports so far investigating this aspect. Since microtubule dynamics is a highly complex phenomenon brought forward by multiple players, this should be studied further.
Interphase cells corroborate the same story of reduced microtubule nucleation, whereby the centrosomes show reduced efficiency to regrow microtubules after induced depolymerization (). Since α-fodrin has a γ-tubulin binding motif [Citation27], we were curious to understand whether α-fodrin plays any role in the recruitment of γ-tubulin to the centrosome. FRAP analysis of γ-tubulin-RFP localizing at the centrosome revealed that reduction in endogenous α-fodrin resulted in a significant reduction in the fraction of γ-tubulin navigating to the centrosome (). Moreover, the movement of this fraction was considerably delayed in α-fodrin depleted cells, even though the recovery rates were probably underestimated. Nevertheless, it points to a significant role of α-fodrin in the recruitment of γ-tubulin. The interaction of γ-tubulin with the long rod-like structure of fodrin, through its GRIP2-like motif is probably important for this recruitment. We had earlier reported the role of α-fodrin in regulating the nucleating activity of γ-TuRC [Citation27] in vitro. Correlating it with our present results, it is implied that α-fodrin is a γ-tubulin recruiting protein to the centrosome that prevents cytoplasmic microtubule nucleation and thereby compartmentalizes the process to the centrosome for maximum efficiency.
Literature survey brings forth a number of proteins that are important to the movement of γ-tubulin to the centrosome. We therefore looked into other γ-tubulin recruiting and anchoring proteins. The amount of these proteins also reduce when γ-tubulin is decreased in the centrosome of α-fodrin depleted cells (). These experiments thus reveal that like CDK5RAP2 and pericentrin, α-fodrin is a key player in the γ-tubulin recruitment process to the centrosome at least in brain-derived cells. Further, depletion of pericentrin gives rise to improper cell cycle progression [Citation41], mitotic spindle organization (mono and multipolar spindle) and chromosome misalignment [Citation42]. In our earlier published work [Citation26], we have seen that fodrin depletion also gives rise abnormal mitosis and chromosome misalignment. Thus, looking at pericentrin function and checking α-fodrin’s similarity with it, it can be assessed that fodrin has many roles that need to be examined including human diseases. Further, there are other pericentriolar proteins that have several functions including centriole duplication. Our experiment with centrin show that fodrin may have interaction with it. Fodrin is also a calcium binding protein with EF hands [Citation25] and like centrin [Citation43] controls microtubule organization in mitotic cells [Citation26]. Thus, future studies should emphasize on the possible role of fodrin in centriole duplication. Fodrin, along with actin, maintains the cytoskeletal structural integrity and thus it can be anticipated that in the centrosome also, it provides a structural base to the pericentriolar material and interacts with the key players in a pathway that helps recruit not only γ-tubulin but other centrosomal proteins also to their destination centrosome.
Nevertheless, the evidence that we have been able to gather strongly points that α-fodrin is significant in regulating the microtubule networking and organization in neural cells. In the earlier work published by our group [Citation18], we checked whether α-fodrin is co-localized with γ-tubulin in the golgi apparatus using golgi-specific protein staining and α-fodrin and γ-tubulin staining. However, we did not find any co-localization. Hence, we have not checked trans-golgi mediated microtubule formation upon α-fodrin depletion.
Thus, although α-fodrin is a structural protein, it has numerous non-structural functions such as regulation of mitotic progression [Citation26] and regulation of microtubule nucleation by probable γ-tubulin recruitment to the centrosome. These findings would make it an important player in cancer progression and other diseases.
Materials and methods
Materials
Isopropyl β-D-1-thiogalactopyranoside (IPTG), Dimethyl Pimelimidate (DMP), PIPES (piperazine-N, N’-bis(2-ethanesulfonic acid), PMSF (phenylmethylsulfonyl fluoride), DTT (Dithiothreitol), DAPI (4’,6-diamidino-2-phenylindole) were from Sigma, USA. Ampicillin and chloramphenicol and Luria-Bertani (LB) broth were from HiMedia, Germany. Protease inhibitor cocktail, Lipofectamine 3000 were from Thermo, USA. DMEM (Dulbecco’s Modified Eagle’s Medium), Opti-MEM (Minimal Essential Medium) and Antibiotic-Antimycotic mix were from Gibco BRL, USA. ECL (Enhanced chemiluminescence) reagent was from Thermo Scientific, USA. FBS (Fetal Bovine Serum) was purchased from PAN Biotech, Germany. α-fodrin shRNA, control shRNA were procured from Origene Technologies, USA. α-fodrin shRNA and non-target shRNA MISSION lentiviral transduction particles were from Sigma, Japan.
Antibodies
Anti-α-fodrin mouse monoclonal antibody (cat. no. ab11755 WB 1:2000), anti-γ-tubulin mouse monoclonal antibody (cat. no. ab11316 WB 1:2000), anti-CDK5RAP2 rabbit polyclonal antibody (cat. no. ab70213 1:500) and anti-pericentrin mouse monoclonal antibody (cat. no. ab28144 1:500) [Citation18,Citation44]; were from Abcam, UK. Pericentrin 2 goat polyclonal (C-16) Antibody was from Santa Cruz (sc -28,145 1:500) and rabbit monoclonal was from Bethyl laboratories (IHC-00264 T). Centrin 2 polyclonal antibody rabbit (15877-1-AP, 1:700) was from Proteintech.
Anti-GFP mouse monoclonal antibody (cat. no. GTX628894, IP 1:1000, WB 1:2000) was from Genetex USA. Anti-α-tubulin mouse monoclonal antibody (cat. no. 3873s 1:4000) was from Cell Signaling Technologies, USA. γ-tubulin rabbit polyclonal antibody was custom synthesized from ABGENEX, India. Secondary antibodies: Anti-Mouse HRP, Anti-Rabbit HRP were procured from Sigma. Anti-Mouse Alexa Fluor 488, Anti-Mouse Alexa Fluor 565, Anti-Rabbit Alexa Fluor 488, Anti-Rabbit Alexa Fluor 565, Anti-human Alexa Fluor 647, Anti goat Alexa Fluor 488 were from Molecular Probes, USA. Secondary HRP antibodies were used in 1:5000 dilution for western blotting and in 1:1000 dilution for immunofluorescence experiments.
Cell lines
U-251 MG (Glioblastoma cell line) was purchased from Sigma USA. IMR-32 (Neuroblastoma cell line) was procured from RGCB central cell repository CCL-127.
Clones used in the study
γ-tubulin RFP encoding phTUBG1-TagRFP-puro used for FRAP was a generous gift from Dr. Pavel Draber, Laboratory of Biology of Cytoskeleton, Institute of Molecular Genetics, Academy of Sciences of the Czech Republic, Czech Republic. The clones of the following α-fodrin shRNA sequences GCCACTGAACTGAAAGGAATA; GCCATTGTTAAGCTGATGAA and GCCATGAAGAC AGCTTCAAA in pLKO-puro-IPTG-3xLacO were used for lentiviral transduction to prepare U-251 MG cells conditionally expressing α-fodrin shRNA. pFOD-GFP and pEGFP were used for the recovery assay. The details of these clones are given in our earlier publication [Citation27].
Maintenance of cell lines
U-251 MG and IMR-32 were maintained in MEM with non-essential amino acids, 1 mM L-glutamine and 1 mM sodium pyruvate with 10% FBS and 1X antibiotic-antimycotic solution. The cells were incubated at 37°C with 5% CO2 and 5% relative humidity. From the reference stock, frozen stocks of cells were made within the third passage and stored in liquid nitrogen. For experiments, cells were used within 3 months after revival.
The cell lines were used within 3 years from purchase or used within one years of STR analysis.
Transient transfection
This method was used for the transfection of α-fodrin shRNA containing plasmid (Procured from Origene ACAATCACCATGAGGAGAACATCTCTTCA) into U-251 MG and IMR-32 cells. Briefly, cells were seeded into 60 mm dishes with or without coverslips. Cells were allowed to attach for 24 h. Transfection was carried out using Lipofectamine 3000 transfection reagent (Invitrogen) according to the manufacturer’s protocol. Opti-MEM was used for the dilution of Lipofectamine and plasmid DNA. 96 hours post transfection, the cells were either fixed for immunofluorescence or harvested for western blotting analysis. A similar protocol of transfection was also applied to transfect Tubulin-GFP expressing plasmid (for figure:3) into U-251 MG cells (U-251 MG-TUB-GFP). 24-h post-transfection, medium was changed in the dishes. The cells were selected using G418 at a concentration of 500 µg/ml.
Stable transfection
U-251 MG cells stably expressing RFP tagged γ-tubulin (U-251 MG-γ-TUB-RFP) were generated by third generation lentiviral transduction. Briefly, γ-tubulin-RFP expressing plasmid, phTUBG1-TagRFP-puro (gift from Dr. Pavel Draber) was transfected into HEK-293T cells along with viral plasmids expressing viral proteins D2G, RRE and REV. 24 hrs post transfection, viral particles generated were released into the medium. The medium was collected and syringe filtered to remove any cellular debris. This viral soup was used to infect U-251 MG cells. After infection, cells were selected using puromycin at a concentration of 1 µg/ml.
To validate that the effects obtained due to α-fodrin downregulation are specific, U-251 MG/U-251 MG-γ-TUB-RFP cells containing conditionally inducible α-fodrin shRNA plasmid was generated by stable infection with MISSION lentiviral transduction particles procured from Sigma. The particles had three shRNA clones of different sequences. Infection was done at an MOI (Multiplicity of infection) of 20 and assisted by the use of polybrene at 8 µg/ml concentration. Cells were selected using puromycin at a concentration of 1 µg/ml for 96 hrs. Selected colonies were then induced with IPTG at 10 mM concentration for 96 hrs for the expression of shRNA and downregulation of α-fodrin.
Recovery assay
U251 cells were trypsinized with 0.05% Trypsin-EDTA and 1 million cells were counted and mixed with 10µl of electroporation buffer. pFOD-GFP/EGFP and the dissociated cells were electroporated using Neon Electroporator with pCAGIG as a control plasmid. Six pulses with 1200 v and 10 ms pulse width were given using Neon electroporator and cultured. After 24 h of electroporation, the cells were fixed with 4% paraformaldehyde and used for confocal imaging.
Immunofluorescence
The immunofluorescence assay was done as previously described in Nellika et al [Citation26]. Briefly, cells were seeded onto clean sterilized cover slips in six well plates or 35 mm dishes. Post 24 h of seeding, the cells were transfected with shRNA. After 96 h of transfection, cells were fixed either with chilled methanol or 4% formaldehyde. Briefly for methanol fixation, cells were washed with warm (37°C) 1X PBS. Then, the cells were incubated with chilled methanol for 10 min at −20°C. The methanol was removed and cells were washed with 1X PBS. For formaldehyde fixation, cells were washed with 1X PBS, followed by incubation with 4% formaldehyde for 15 min at room temperature in dark. Formaldehyde was carefully discarded and then the cells were washed with 1X PBS three times 5 min each.
Cells were blocked and permeabilized with 5% normal donkey serum and 0.1% triton X-100 dissolved in 1X PBS for 1 hr at room temperature. The primary and secondary antibodies were diluted in antibody dilution buffer containing 1% BSA and 0.1% triton X-100. After permeabilization cells were incubated with primary antibody overnight at 4°C in a humid chamber. Following this, the cells were washed three times with 1X PBS 5 min each. The cells were then incubated with secondary antibody tagged with a specific fluorophore. They were then again washed 3 times with 1X PBS 5 min each. The coverslips were then mounted on to glass slides with a drop of DAPI Fluoromount-G mounting agent.
Confocal imaging of fixed cells
For the imaging of fixed cells, Nikon Eclipse Ti (AIR) inverted confocal microscope was used. The cells were imaged with a 60X oil immersion objective. The samples were illuminated either with bright light or laser light at 405 nm/488 nm/561 nm for exciting various fluorophores.
Fluorescence intensity measurements
Images obtained from immunofluorescence experiments were analyzed using ImageJ. Care was taken while imaging to keep the intensity of light and voltage constant for both control and α-fodrin shRNA treated samples. All images were taken with z-stacks. Maximum intensity profiles were generated for every image before analysis. An ROI of constant size (nearly 2 pixels diameter) was drawn around the centrosomes. For analyzing the changes at the centrosome, the intensity of γ-tubulin, and the other proteins were determined using ImageJ. Mean intensity throughout the ROI was quantified and plotted. For astral microtubule intensity measurements, ROI was drawn to encompass the entire astral microtubule spread. Concomitantly, the changes in astral microtubules were evaluated by analyzing the intensity of α-tubulin. Background intensity was subtracted in all measurements. All experiments were repeated twice or thrice. The intensities were compared and analyzed using GraphPad Prism. Student’s t-test was applied to validate the hypothesis.
Microtubule regrowth
U-251 MG cells stably expressing Tubulin GFP (U-251 MG-TUB-GFP) were transfected either with control or α-fodrin shRNA. After 96 h, cells were incubated in ice for 2 h, to completely depolymerize the microtubules. The cells were then washed thrice with warm 1X PBS. Warm medium was added to the cells to allow the regrowth of microtubules for specified time points namely 1, 4, and 7 min. In another set, the regrowth was followed for 0, 5, 7, 10, 15, and 30 min. After the specified times of regrowth the cells were washed once with MT extraction buffer containing 0.1% saponin in PEM to remove the unpolymerized tubulin from the cells. The cells were then fixed with methanol-EDTA. Samples were then imaged and cells showing microtubule regrowth were enumerated using Image J. The experiment was repeated thrice. The values were compared and analyzed using GraphPad Prism. Student’s t-test was applied to validate the hypothesis.
Fluorescence recovery after photobleaching
U-251 MG cells stably expressing γ-tubulin RFP (U-251 MG-γ-TUB-RFP) and inducible control/α-fodrin shRNA were used for this assay. 10 mM IPTG was used to induce the expression of the shRNA. The cells were imaged live post induction. A circular ROI of 0.2 pixels was drawn around the centrosome as demarcated by γ-tubulin RFP. For photobleaching of the centrosome, the 561 nm laser was empirically adjusted to an intensity to bring about complete bleaching of the fluorophore in 20 sec (A 50-mW, 561-nm laser system was used for photobleaching experiments performed with 80% laser power). One image was taken before the photobleaching and post bleaching, the images were taken at intervals of 30 s for a total time of 10 min. During analysis, the intensity of the ROI in all frames, before and after photobleaching was determined using ImageJ. These intensities were normalized against a non-bleached centrosome. The intensities were also normalized from their initial pre-bleach value, such that the recovery was rated in a scale from 0 to 1, where 0 means no recovery and 1 means 100% recovery. All intensities were subtracted from background intensity. Data was collected from 17 centrosomes in control and 16 in α-fodrin downregulated cells over two independent experiments. A mean intensity curve was drawn for both conditions. This curve was fit using one-phase association equation for non-linear regression in Graphpad. The mean plateau value represents the mobile fraction that recovered and the half time of the curve indicates the mean half-life of recovery or the rate of movement of γ-tubulin to the centrosome. In order to negate the effect of reversible photobleaching of fluorophore, the same experiment was repeated in fixed cells, where no recovery was observed either in control or α-fodrin depleted cells.
Immunoprecipitation
Pre-cleared U-251 MG cell lysate was incubated with anti-α-fodrin rabbit antibody or anti-CDK5RAP2 rabbit antibody or anti-IgG isotype control antibody overnight at 4°C with rotation. The samples were then precipitated using protein A agarose dynabeads for 2 h at 4°C with rotation. The pull-down proteins were eluted from the beads by boiling the samples with SDS-sample buffer at 96°C for 7 min. Western blots were developed using fodrin, CDK5RAP2 or pericentrin antibodies.
Statistical approach
All experiments have been repeated 2, 3, or 5 times and Student’s t-test was used to understand the statistical significance on the parameter values obtained.
Author contributions
JSS, AJ, RKN, and SG did the experiments. JSS, RKN, and SS were involved in conceptualization and ideation of the study. PAR and JJ were involved in the recovery assay. JSS and SS had written the manuscript. SS has supervised the work.
Supplemental Material
Download Zip (16.2 MB)Acknowledgement
The authors would like to thank Dr. Pavel Draber for providing with phTUBG1-TagRFP-puro plasmid. The authors thank Prof. Tapas Manna of IISER, Trivandrum for his valuable suggestion over the manuscript and Dhrishya Dharmapal for her help in the experimental part. JSS, RKN and AJ would also like to thank Indian Council of Medical Research, India; University Grants Commission, India and Council of Scientific and Indrustrial Research, India for fellowship. The authors also thank the Department of Science and Technology-Science Education and Research Board, Government of India for the extra mural funding and Department of Biotechnology, Rajiv Gandhi Centre for Biotechnology, India for core funding.
Disclosure statement
No potential conflict of interest was reported by the author(s).
Data availability statement
The data to support the findings of the present study are available in the supplementary material of this article.
Supplementary material
Supplemental data for this article can be accessed online at https://doi.org/10.1080/15384101.2022.2119516
Additional information
Funding
Related Research Data
References
- Bornens M. The centrosome in cells and organisms. Science. 2012;335(6067):422–426.
- Zimmerman W, Sparks CA, Doxsey SJ. Amorphous no longer: the centrosome comes into focus. Curr Opin Cell Biol. 1999;11(1):122–128.
- Lüders J, Stearns T. Microtubule-Organizing centres: a re-evaluation. Nat Rev Mol Cell Biol. 2007;8(2):161–167.
- Moritz M, Braunfeld MB, Sedat JW, Alberts B and Agard DA. Microtubule nucleation by γ-tubulin-containing rings in the centrosome. Nature. 1995;378(6557):638–640.
- Khodjakov A, Rieder CL. The sudden recruitment of γ-tubulin to the centrosome at the onset of mitosis and its dynamic exchange throughout the cell cycle, do not require microtubules. J Cell Biol. 1999;146(3):585–596.
- Ou Y, Rattner JB. The centrosome in higher organisms: structure, composition, and duplication. Int Rev Cytol. 2004;238:119–182.
- Stearns T, Evans L, Kirschner M. γ-Tubulin is a highly conserved component of the centrosome. Cell. 1991;65(5):825–836.
- Moritz M, Braunfeld MB, Guénebaut V, et al. Structure of the γ-tubulin ring complex: a template for microtubule nucleation. Nat Cell Biol. 2000;2(6):365–370.
- Doxsey SJ, Stein P, Evans L, et al. Pericentrin, a highly conserved centrosome protein involved in microtubule organization. Cell. 1994;76(4):639–650.
- Murphy SM, Preble AM, Patel UK, et al. GCP5 and GCP6: two new members of the human γ-tubulin complex. Mol Biol Cell. 2001;12(11):3340–3352.
- Young A, Dictenberg JB, Purohit A, et al. Cytoplasmic dynein-mediated assembly of pericentrin and γ tubulin onto centrosomes. Mol Biol Cell. 2000;11(6):2047–2056.
- Delgehyr N, Sillibourne J, Bornens M. Microtubule nucleation and anchoring at the centrosome are independent processes linked by ninein function. J Cell Sci. 2005;118(8):1565–1575.
- Ou YY, Mack GJ, Zhang M, et al. CEP110 and ninein are located in a specific domain of the centrosome associated with centrosome maturation. J Cell Sci. 2002;115(9):1825–1835.
- Choi Y-K, Liu P, Sze SK, et al. CDK5RAP2 stimulates microtubule nucleation by the γ-tubulin ring complex. J Cell Biol. 2010;191(6):1089–1095.
- Jia Y, Fong KW, Choi YK, et al. Dynamic recruitment of CDK5RAP2 to centrosomes requires its association with dynein. PLoS One. 2013;8(7):1–7.
- Lüders J, Patel UK, Stearns T. GCP-WD is a γ-tubulin targeting factor required for centrosomal and chromatin-mediated microtubule nucleation. Nat Cell Biol. 2006;8(2):137–147.
- Winkelmann JC, Forget BG. Erythroid and nonerythroid spectrins. Blood. 1993;81(12):3173–3185.
- Shashikala S, Kumar R, Thomas NE, et al. Fodrin in centrosomes: implication of a role of fodrin in the transport of gamma-tubulin complex in brain. PLoS One. 2013;8(10):e76613.
- Thomas NE, Shashikala S, Sengupta S. Cytoplasmic gamma-tubulin complex from brain contains nonerythroid spectrin. J Cell Biochem. 2010;110(6):1334–1341.
- Levine J, Willard M. Fodrin: axonally transported polypeptides associated with the internal periphery of many cells. J Cell Biol. 1981;90(3):631–642.
- Bialkowska K, Saido TC, Fox JEB. SH3 domain of spectrin participates in the activation of Rac in specialized calpain-induced integrin signaling complexes. J Cell Sci. 2005;118(2):381–395.
- Machnicka B, Grochowalska R, Bogusławska DM, et al. Spectrin-Based skeleton as an actor in cell signaling. Cell Mol Life Sci. 2012;69(2):191–201.
- McMahon LW, Zhang P, Sridharan DM, et al. Knockdown of αII spectrin in normal human cells by siRNA leads to chromosomal instability and decreased DNA interstrand cross-link repair. Biochem Biophys Res Commun. 2009;381(2):288–293.
- Metral S, Machnicka B, Bigot S, et al. αII-Spectrin is critical for cell adhesion and cell cycle. J Biol Chem. 2009;284(4):2409–2418.
- Sreeja JS, John R, Dharmapal D, et al. A fresh look at the structure, regulation, and functions of fodrin. Mol Cell Biol. 2020;40(17):1–16.
- Nellikka RK, Sreeja JS, Dharmapal D, et al. α-fodrin is required for the organization of functional microtubules during mitosis. Cell Cycle. 2019;18(20):2713–2726.
- Sreeja JS, Nellikka RK, John R, et al. Binding of alpha-fodrin to gamma-tubulin accounts for its role in the inhibition of microtubule nucleation. FEBS Lett. 2019;593(11):1154–1165.
- Stankewich MC, Cianci CD, Stabach PR, et al. Cell organization, growth, and neural and cardiac development require αII-spectrin. J Cell Sci. 2011;124(23):3956–3966.
- Compton DA. Spindle assembly in animal cells. Annu Rev Biochem. 2000;69(1):95–114.
- Singh P, Thomas GE, Gireesh KK, et al. TACC3 protein regulates microtubule nucleation by affecting γ-tubulin ring complexes. J Biol Chem. 2014;289(46):31719–31735.
- Sreeja JS, Jyothy A, Sengupta S. α-fodrin in cytoskeletal organization and the activity of certain key microtubule kinesins. Genes (Basel). 2021;12(5):750.
- Barr AR, Kilmartin JV, Gergely F. CDK5RAP2 functions in centrosome to spindle pole attachment and DNA damage response. J Cell Biol. 2010;189(1):23–39.
- Chen D, Purohit A, Halilovic E, et al. Centrosomal anchoring of protein kinase C βII by pericentrin controls microtubule organization, spindle function, and cytokinesis. J Biol Chem. 2004;279(6):4829–4839.
- Dictenberg JB, Zimmerman W, Sparks CA, et al. Pericentrin and γ-tubulin form a protein complex and are organized into a novel lattice at the centrosome. J Cell Biol. 1998;141(1):163–174.
- Hu H, Sheehan JH, Chazin WJ. The mode of action of centrin. J Biol Chem. 2004;279(49):50895–50903.
- Khouj EM, Prosser SL, Tada H, et al. Differential requirements for the EF-hand domains of human centrin 2 in primary ciliogenesis and nucleotide excision repair. J Cell Sci. 2019;132(19):jcs228486.
- Salisbury JL, Suino KM, Busby R, et al. Centrin-2 is required for centriole duplication in mammalian cells. Curr Biol. 2002;12(15):1287–1292.
- Stemm-Wolf AJ, Morgan G, Giddings THsJr, et al. Basal body duplication and maintenance require one member of the Tetrahymena thermophila centrin gene family. Mol Biol Cell. 2005;16(8):3606–3619.
- Lin T, Neuner A, Flemming D, et al. MOZART1 and γ-tubulin complex receptors are both required to turn γ-TuSC into an active microtubule nucleation template. J Cell Biol. 2016;215(6):823–840.
- Paz J, Lüders J. Microtubule-organizing centers: towards a minimal parts list. Trends Cell Biol. 2018;28(3):176–187.
- Kim S, Rhee K, Toda T. Importance of the CEP215-pericentrin interaction for centrosome maturation during mitosis. PLoS One. 2014;9(1):e87016.
- Unal S, Alanay Y, Cetin M, et al. Striking hematological abnormalities in patients with microcephalic osteodysplastic primordial dwarfism type II (MOPD II): a potential role of pericentrin in hematopoiesis. Pediatr Blood Cancer. 2014;61(2):302–305. DOI:10.1002/pbc.24783
- Dammermann A, Merdes A. Assembly of centrosomal proteins and microtubule organization depends on PCM-1. J Cell Biol. 2002;159(2):255–266.
- Cervenkaa I, Valnohovaa J, Bernatika O, et al. Dishevelled is a NEK2 kinase substrate controlling dynamics of centrosomal linker proteins. Proc Nat Acad Sci. 2016;113(33):9304–9309. DOI:10.1073/pnas.1608783113