
ABSTRACT
Self-sustained quiescence (SSQ) has been characterized as a stable but reversible non-proliferative cellular state that limits the cloning of cultured cancer cells. By developing refined clonogenic assays, we showed here that cancer cells in SSQ can be selected with anticancer agents and that culture at low cell density induced SSQ in pancreas and prostate adenocarcinoma cells. Pre-culture of cells in 3D or their pretreatment with pharmacological inhibitors of mechanistic target of rapamycin (mTOR) synergize with low cell density for induction of SSQ in a Beclin-1-dependent manner. Dissociated pancreatic adenocarcinoma (PAAD) cells rendered defective for SSQ by down-regulating Beclin-1 expression exhibit higher tumor growth rate when injected subcutaneously into mice. Conversely, dissociated PAAD cells in SSQ promote the formation of small indolent tumors that eventually transitioned to a rapid growth phase. Ex vivo clonogenic assays showed that up to 40% of clonogenic cancer cells enzymatically dissociated from resected fast-growing tumors could enter SSQ, suggesting that SSQ could significantly impact the proliferation of cancer cells that are naturally dispersed from tumors. Remarkably, the kinetics of clinical metastatic recurrence in 124 patients with pancreatic adenocarcinoma included in the TGCA-PAAD project could be predicted from Beclin-1 and Cyclin-A2 mRNA levels in their primary tumor, Cyclin A2 mRNA being a marker of both cell proliferation and mTOR complex 1 activity. Overall, our data show that SSQ is likely to promote the late development of clinical metastases and suggest that identifying new agents targeting cancer cells in SSQ could help improve patient survival.
Introduction
Metastases are the leading cause of cancer-related morbidity and mortality and account for more than 80% of cancer deaths. Metastasis involves cancer cells, isolated or in clusters of a few cells, that are disseminated from the primary tumors to distant sites by lymphatic or hematogenous routes. Metastases development is an inefficient process. In experimental models, only a small fraction of cancer cells that have extravasated in the parenchyma of a distant organ begins to proliferate to form micro-metastases, with most of cancer cells entering into a non-growing state called dormant [Citation1–3]. Additionally, only a small subset of micro-metastases continue to grow to form macroscopic tumors [Citation1–3] and the growth of small macroscopic tumors into larger tumors is also limited [Citation4,Citation5]. Unfortunately, the mechanisms that limit development of metastases are also probably involved in the persistence of cancer cells in patients in complete remission and are a cause of the late development of metastases [Citation5–7].
Since a metastase is basically a clonal cell population resulting from the proliferation of a single disseminated cancer cell, we have undertaken studies on the factors limiting the cloning of cancer cells in culture in order to better understand the factors regulating the development of metastases. This led us to discover that the ability of prostate adenocarcinoma (PA) cells to proliferate at low cell density to form a cell clone can be severely limited by a phenomenon we initially called dormancy [Citation8,Citation9], by analogy with the phenomenon of cancer cell dormancy [Citation5], then renamed Self-Sustained Quiescence (SSQ) [Citation10] to highlight its cell-autonomous feature. Indeed, PA cells can be induced to enter a G0/G1 growth-arrested state that, once established, maintains itself at low cell density despite the return of cells to growth-permissive conditions. We showed that this self-sustained growth arrest involves a stable decrease of the redox potential of cellular thiols and is further stabilized by BMP signaling pathways [Citation10]. Accordingly, cells in SSQ can be switched to a proliferating state when treated with SSQ inhibitors (SSQi) consisting of a reduced thiol (such as dithiothreitol, glutathione, or N-acetylcysteine) and/or an inhibitor of BMP signaling (such as K02288; see also the Methods section for more details) [Citation8–10]. Additionally, SSQ can be destabilized by autocrine factors of less than 2 kDa produced by most types of cancer cells grown in 2D culture (see in [Citation9]). The self-maintenance property of SSQ is remarkable compared to other models of cancer cell dormancy that in most cases involved mechanisms that are non-cell-autonomous in accordance with the “seed and soil” model. This raises the issue of the biological relevance of SSQ in the regulation of tumor development. Here, we showed that PA and pancreatic ductal adenocarcinoma (PADC) cells in SSQ or competent for SSQ can be selected with anticancer agents after subculturing cells at low cell density. This allowed the characterization of factors modulating induction of SSQ and the isolation of PDAC cell populations highly enriched in SSQ that we used for in vivo studies. We then applied the results obtained to the analysis of metastasis in pancreas adenocarcinoma (PAAD) patients.
Results
Selection of clonogenic cancer cells in SSQ with anticancer agents at low cell density
We hypothesized that anticancer agents that preferentially target proliferative cells could select cells in SSQ. We used KC-DT66066 cells, derived from a pancreas ductal adenocarcinoma (PDAC) developed in a genetically engineered LSL-KrasG12D/+, Pdx1-Cre mouse model of spontaneous PDAC [Citation11,Citation12] and routinely passaged at medium/high cell density in 2D-culture plates. When these cells were plated at low cell density in regular growth medium, they exhibited high cloning efficiency (CE = 48 ± 14% of seeded cells grew to form cell clones; mean ± sd, n = 24; see the none→ none clonogenic assay in that was slightly increased by addition of SSQi (59 ± 17%; see the none→ SSQi clonogenic assay in ). To test for the selection of cancer cells in SSQ with gemcitabine, KC-DT66066 cells were plated at low density in a regular growth medium and cultured for 3 days before applying gemcitabine selection for 4 days. When cells were washed and returned to their regular growth medium, very few, if any, growing cell clones were detected after 10–12 days, even after microscopic examination (see gem d3→ none in ). However, when cells were returned to regular growth medium supplemented with SSQi after gemcitabine selection, growing cell clones were recovered at an averaged frequency of 1.5% of seeded cells (see gem d3→ SSQi in ). This showed that non-growing cells that had survived to gemcitabine treatment were in SSQ since they switched to a proliferative state only after adding SSQi. Interestingly, the recovery of growing cell clones was reduced to background (<0.4%) if gemcitabine was added immediately after cell seeding (see gem d0→ SSQi in ). This indicated that most cells from 2D-cultures entered SSQ only after plating at low cell density.
Figure 1. Selection of pancreas cancer KC-DT66066 cells in SSQ at low cell density with anticancer agents. a) Outlines of clonogenic assays to assess the kinetics of SSQ formation. Cells were plated at low cell density on day 0 (d0) and cultured as indicated. The labels on the left are those used in the scatter plots. SSQi is a mixture of pharmacological agents that reverts SSQ (see Methods). b) Kinetics of the generation of gemcitabine-resistant cells. Scatter plots of cloning efficiency (CE) measured with the indicated clonogenic assays. Labels in the red boxes indicate the percentage of seeded cells having formed a cell clone. * indicates the statistical significance of the change in CE induced by SSQi supplementation and # the statistical significance of the difference in CE between the indicated clonogenic assays with SSQi supplementation. c) Representative pictures of fixed and stained cell culture dishes after culturing the cells as indicated. d) Rationale for determining the initial frequency of cancer cells in SSQ in a given cell population and the frequency at which they are induced by cell subculture at low cell density or low cell density and low serum. The gem d0 clonogenic assay selects cells that were already in SSQ in the initial cell population. The selected SSQ cells switch to a proliferating state and formed cell clones after the addition of SSQi (gem d0→ SSQi clonogenic assay). Growing cell clones obtained in clonogenic assays with delayed gemcitabine selection and SSQi supplementation (gem d3→ SSQi and low FCS→ gem d3→ SSQi) originated from cells already in SSQ in the initial population or that were induced to enter SSQ by subculture at low cell density or at low cell density and in low serum.
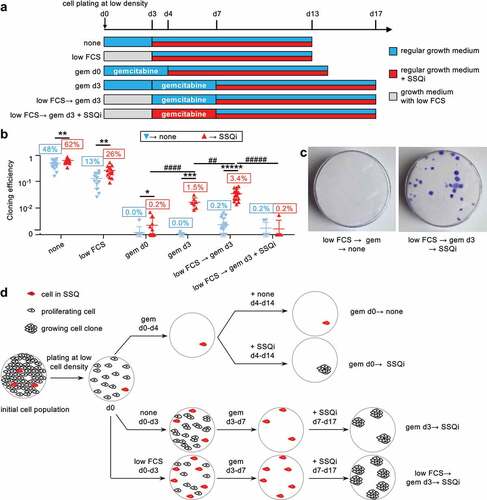
As this induction of SSQ could be counteracted by growth factors that promote cell proliferation, we tested whether low fetal calf serum concentration in growth medium (low FCS) could facilitate SSQ induction after plating at low cell density. After plating for 3 days at low cell density in low FCS, spontaneous cloning efficiency (CE) decreased to 13% of seeded cells but was increased twofold by adding SSQi (see low FCS in ). This suggests that clonogenic cancer cells that survive to culture at low cell density in low serum were more susceptible to the stimulation of clonal cell growth by SSQi. Correspondingly, frequency of cancer cells in SSQ selected by gemcitabine increased to 3.4% of seeded cells under these conditions, showing that reduced serum concentration synergized with low cell density to induce SSQ (see low FCS→ gem d3→ SSQi in ).
Of note, the addition of SSQi could be delayed for at least 3 days after completion of gemcitabine selection with no significant decrease of cell clone recovery, showing that SSQi did not rescue cancer cells undergoing a delayed cell death phenomenon that might have been induced by gemcitabine treatment (Fig S1A). In fact, the addition of SSQi at the same time as gemcitabine completely blunted the subsequent recovery of growing cell clones (see low FCS→ gem d3 + SSQi→ SSQi in ). This showed that SSQi sensitized cells to gemcitabine, as expected if the main action of SSQi is to promote the switch from SSQ to a proliferative state. These observations were generalized to others pancreas and prostate cancer cell lines (Fig S1B, D-E) and anticancer drugs exhibiting a strong and selective toxicity to proliferating cancer cells (Fig S1D-E). Finally, we showed that SSQ entry and exit are fully reversible processes that can be repeated serially since proliferating cell populations derived from cancer cells in SSQ selected with nocodazole or gemcitabine and reactivated with SSQi could reenter in SSQ with high efficiency when cultured at low cell density (Fig S1F). In the remainder of this article, the clonogenic assay gem d0→ SSQi was used to measure the relative frequencies of cells already in SSQ in the cell populations studied (). The relative frequency of clonogenic cancer cell in SSQ measured by clonogenic assays with delayed selection by gemcitabine (gem d3→ SSQi or low FCS→ gem d3→ SSQi) corresponds to the sum of the relative frequency of cancer cells already in SSQ in the cell population studied and the relative frequency of their induction by low cell density and low serum ().
SSQ is promoted by 3D cell culture and treatment with pharmacological inhibitors of mTOR
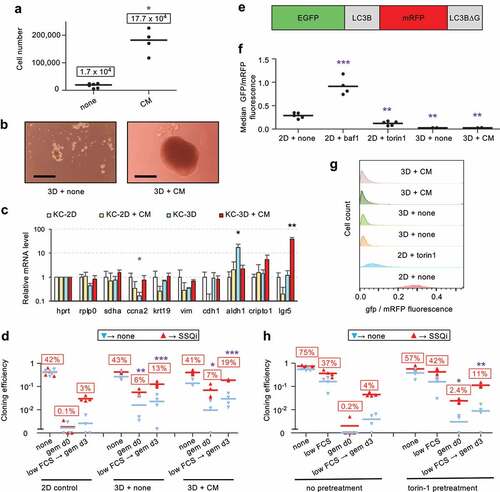
We observed that KC-A338 cells entered SSQ at high frequency in 2D culture (Fig S1B), which correlated with their ability to spontaneously form transformed foci that eventually detached from the bottom of the culture dish to form compact tumor spheroid-like structures (Fig S1C). This led us to investigate whether 3D culture could promote SSQ. 3D culture of KC-DT66066 cells on cell-surface-repellent plates in their regular growth medium resulted in the formation of small, non-growing and loosely attached cell aggregates (). However, when growth medium was supplemented with conditioned medium (CM) harvested from senescent mouse fibroblasts cultures that produce numerous growth factors and cytokines [Citation13], compact growing spheroids were obtained (). Analysis of the expression of stemness markers by RT-qPCR showed that non-growing cell aggregates overexpressed Aldh1 while growing spheroids overexpressed Lgr5 ( and see the S1 file for the full list of genes tested). Interestingly, the gem d0 → SSQi clonogenic assay showed that 6–7% of clonogenic cancer cells had entered SSQ during 3D culture both as non-growing cell aggregates or growing spheroids (). Moreover, cells from 3D culture exhibited an increased rate of SSQ induction after plating at low density in reduced serum (compare low FCS→ gem d3 → SSQi between 2D control, 3D and 3D+CM in ). In an attempt to understand why SSQ was promoted by 3D cell culture, we examined the possible role of autophagy since cell detachment from the extracellular matrix can induce autophagy [Citation14]. Therefore, we used the autophagy gene reporter GFP-LC3-RFP-LC3ΔG [Citation15] to measure the autophagic flux and observed that it was stably enhanced in 3D cultured cells (). This led us to examine whether stimulation of autophagy in 2D cell culture could promote SSQ. Accordingly, cells grown at medium cell density in standard culture plates were pretreated for 1 day with Torin1 [Citation16], a standard inhibitor of mTOR that strongly induces autophagy [Citation15], then harvested and seeded at low cell density to test for SSQ induction as described in . Torin1 pretreatment strongly increased the induction of SSQ by plating cells at low density in reduced serum (compare low FCS→ gem d3 → SSQi between pretreated and non-pretreated cells in ). Moreover, the gem d0→ SSQi clonogenic assay indicated that at least 2% of clonogenic cancer cells were induced to enter SSQ before plating cells at low density. These data were confirmed using rapamycin, the canonical mTOR inhibitor and both Torin1 and rapamycin also increased SSQ in human prostate adenocarcinoma cell lines (Fig S2A-B). Taken together, these results showed that inhibition of mTOR signaling pathways was sufficient to strongly promote the induction of SSQ in cancer cells.
Figure 2. SSQ induction in KC-DT66066 cells is enhanced by 3D cell preculture or pretreatment with pharmacological inhibitors of mTOR in 2D cell cultures. a) Growth of cells seeded at 104 cells per well in cell-repellent surface 12-well plate and cultured for 10 days in regular growth medium supplemented with none (none) and 50% conditioned medium (CM) from senescent mouse embryo fibroblasts cultures. The stars indicate the statistical significance of the differences with cells grown in regular growth medium. Labels indicate mean cell number. b) Representative pictures of cells grown for 7 days in cell-repellent surface plates in regular growth medium supplemented with none (3D + none) or CM (3D + CM). The scale bar indicates 0.25 mm. c) RT-qPCR analysis of mRNA species levels according to the indicated cell-culture conditions. Stars indicate statistical significance of differences with the KC-2D condition. 4 independent experiments were performed. d) Clonogenic assays to compare SSQ induction in cells from 3D or 2D cultures using the same cell dissociation method. Note that the relatively high frequency of cell clones in the clonogenic assays gem d0→ none and low FCS→ gem d3→ none resulted from the spontaneous reversion of cells in SSQ after gemcitabine selection when their frequency exceeded 10% of the seeded cells. e) Schematic representation of the fusion protein encoded by the reporter gene EGFP-LC3B-mRFP-LC3BΔg encoding the autophagy sensitive EGFP-LC3B and the autophagy resistant mRFP-LC3Δg fluorescent proteins. f) GFP to mRFP fluorescence ratio in EGFP-LC3B-mRFP-LC3BΔG transduced cells cultured in 2D with none, 100 nM bafilomycin A1 (baf1) or 200 nM Torin1 for 1 day or cultured in 3D with none (3d+none) or CM (3D+CM) for 7 days. Stars indicate the significance of the difference with untreated 2D-cultured (control) cells. g) Data from a representative flow cytometry experiment showing the distribution of the ratio of GFP to mRFP fluorescence in transduced cells cultured as indicated. h) Clonogenic assays to compare SSQ induction in cells pretreated at medium cell density in 2D-cultures with none or 200 nM Torin1 for 1 day (pretreatment) before cell passaging at low density. Labels indicate the percentage of seeded cells having formed a cell clone after SSQi supplementation. Stars indicate statistical significance of differences with 2D control in panel d and with untreated cells in panel h in clonogenic tests with SSQi supplementation.
Beclin-1 expression is required for SSQ induction in an autophagy-independent manner
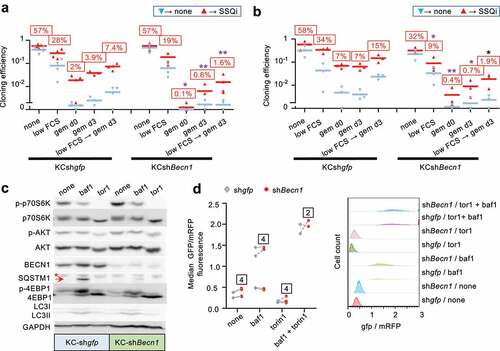
To further investigate the possible role of autophagy in regulating SSQ induction, we focused on Beclin-1 (BECN1) that promotes autophagosomal membrane nucleation [Citation17]. Beclin-1 is released from the cytoskeleton upon mTOR Complex 1 (mTORC1) inhibition and is also required for induction of autophagy by cell detachment from extracellular matrix [Citation14,Citation18,Citation19]. We generated three independent KC-DT66066 cell populations transduced with a Becn1-targeting lentiviral shRNA that exhibited a 90% reduction in Becn1 mRNA level, compared to cell populations transduced with a gfp-targeting control lentiviral vector (KCshBecn1 and KCshgfp cell populations, respectively; data not shown and see below). Clonogenic assays as performed in showed that induction of SSQ was significantly decreased by Becn1 downregulation (). Furthermore, this could not be alleviated by Torin1 pre-treatment of cancer cells, which increased the frequencies of cells in SSQ only in control cell populations (KCshgfp, ). Similar results were obtained using KC-A338 cells in which a four-fold reduction in Becn1 mRNA levels decreased SSQ induction 2.7-fold (Fig S2C).
Western Blot analysis showed that KCshBecn1 cell populations displayed a 10-fold decrease of Beclin-1 (). Phosphorylation of p70S6 kinase and 4EBP1, two downstream targets of mTOR complex 1 (mTORC1) was strongly inhibited by Torin1 treatment in both control and KCshBecn1 populations (). Akt1 phosphorylation at serine 473 was less affected by Torin-1 treatment (), consistent with phosphorylation of this site by several kinases in addition of mTOR complex 2 [Citation20]. Interestingly, the expression of LC3-II (a cleavage product of LC3-I (ATG8) and a marker of autophagosomes formation) showed no significant difference between control and KCshbecn1 cells under basal conditions or after treatment with bafilomycin A1 (an autophagy inhibitor that induced an accumulation of LC3-II [Citation21];). Additionally, the level of SQSTM1, a protein degraded by autophagy, was barely detectable under basal conditions in both control and KCshbecn1 cells, but was increased by bafilomycin A1 treatment (although to a lesser extent in KCshbecn1 cells; ). This suggested that autophagy was barely affected by Beclin-1 downregulation, which was confirmed by comparing autophagic flux in several independent KCshgfp and KCshBecn1 cell populations (). Thus, Torin1 treatment could promote SSQ through Beclin1-dependent mechanisms that are unrelated to autophagy. This was confirmed by two types of experiments. Inhibition of autophagic flux with bafilomycin A1 (which affects autophagy downstream of Beclin-1 activation) did not have a significant impact on the induction of SSQ by Torin1 in pancreas or prostate adenocarcinoma cells (Fig S2D-E). Similarly, transduction of a constitutively active mutant of Beclin1, Becn1F121A [Citation22] which is defective in its binding to Bcl2/Bclx inhibitors, resulted in increased autophagic flux both under basal conditions or after mTOR inhibition, but did not have a significant impact on SSQ induction (Fig S2F-S2 H).
Figure 3. Beclin-1 downregulation inhibits SSQ but not autophagy. a) and b) clonogenic assays to compare SSQ induction in KC-DT66066 cell populations transduced with shRNA targeting GFP (KCshgfp) or Beclin-1 (KCshBecn1)and pretreated with none (a) or 200 nM Torin1 (b) as depicted in Figure 2 H. Labels above bars indicate the percentage of seeded cells having formed a cell clone after SSQi supplementation. * indicate statistical significance of CE differences after SSQi supplementation between KCshgfp and KCshBecn1 cells. c) Western Blot analysis of KCshgfp and KCshBecn1 cell populations seeded at medium cell density at d0 and treated from d1 to d2 as indicated (baf1 and tor1 were for 100 nm bafilomycin A1 and 200 nM Torin1 respectively). This is one representative western blot of 3 analyzed. The arrow indicates the SQSTM1 band and the star a non-specific band. d) left: GFP/mRFP fluorescence ratio showing no difference in autophagic flux in KCshgfp and KCshbecn1 cell populations transduced with the EGFP-LC3B-mRFP-LC3BΔG reporter gene. Cells were passaged at medium cell density at d0, treated from d1 to d2 with the indicated drugs (none, bafilomycin A1 (baf1),and/or Torin1) and analyzed as in Figure 2(f-g). Dotted lines connect data points derived from a same experiment. Labels indicate the number of independent reporter gene transduction experiments. Right: A representative flow cytometry experiment shown.
Cancer cells in SSQ are distinguished from senescent cells and exhibit epithelial to mesenchymal transition (EMT) characteristics
Since anticancer agents are potent inducers of replicative senescence in cancer cells, we investigated a possible relationship between replicative senescence and SSQ by characterizing cancer cells in SSQ after gemcitabine selection. Thus, KC-DT66066 cells were treated for 1 day with Torin-1 at medium cell density and then individually tracked after SSQ induction at low cell density using the low FCS→ gem d3→ SSQi clonogenic assay. Cancer cells in SSQ were identified post hoc as the single cells at day 7 that survived gemcitabine selection and then gave rise to a cell clone after culturing in a growth medium supplemented with SSQi. Accordingly, cells were photographed at the end of gemcitabine selection on day 7 (d7) and after culturing in growth medium supplemented with SSQi on days 10, 14 and 17 (). It appeared that most of the clonogenic cancer cells in SSQ were small spindle-shaped or rounded cells ( upper row and ). Non-clonogenic cancer cells showed more variable morphology, with significantly enlarged nucleus and cell area, which are two distinctive features of senescent cells [Citation23–25] ( lower row and ). In fact, a large proportion of non-clonogenic cells were large, flattened senescent-like cells, whereas only 1 of 29 clonogenic cancer cells in SSQ exhibited characteristics of senescent cells ( and ), suggesting that SSQ and replicative senescence are disjoint phenomena. This was consistent with the reversible nature of SSQ (Fig S1F), whereas senescent-like cells appeared to have undergone irreversible growth arrest. Indeed, two independent cell populations highly enriched in cells with a senescent phenotype by culturing them for 10 days in the presence of gemcitabine at medium cell density showed a strong decrease below the detection threshold in their cloning efficiency and their ability to enter SSQ.
Table 1. Most clonogenic KC-DT66066 cells in SSQ are small spindle-shaped cells.
Figure 4. KC-DT66066 cells in SSQ are distinguished from senescent cells and exhibit morphological characteristics of Epithelial to Mesenchymal Transition (EMT). a) Outlines of cancer cell tracking in the low FCS→ gem d3→ssqi clonogenic assay using a phase contrast microscope to identify cancer cells in SSQ. Cells were pretreated for 1 day with 200 nM Torin1 at medium cell density before seeding at low cell density and in low serum at day 0 (d0). The cancer cells in SSQ were identified a posteriori as individual cells at the end of gemcitabine selection (at d7) having given rise to a cell clone after culture in growth medium supplemented with SSQi. b) Representative pictures of clonogenic cancer cells in SSQ (upper row) and non-clonogenic cancer cells (lower row) photographed on day 7. c) Scatter plots showing greater nuclear and cellular size in non-clonogenic cells at day 7 compared to SSQ cells. A total of 186 cells were analyzed in two independent experiments. d) RT-qPCR analysis of mRNA species levels in SSQ-enriched cell populations (SSQ; n = 4) versus growing cell populations (Exp; n = 2) and senescent cell populations (Sen; n = 2). SSQ-enriched cell populations were Torin1-pretreated cells from the low FCS→ gem d3 clonogenic assay analyzed at day 7. Senescent cells populations were derived by culturing cells at medium cell density with gemcitabine plus SSQi for about 10 days and further culturing for 1 day in regular medium before cell lysis. Stars indicate statistical significance of the differences with SSQ-enriched cell populations using a two tailed heteroscedastic student’s t test. e) Representative pictures of cancer cells in SSQ on day 7 that have transitioned to an epithelial phenotype by day 10 (upper row), day 14 (middle row) or have maintained a mesenchymal phenotype by day 14 (lower pictures row).
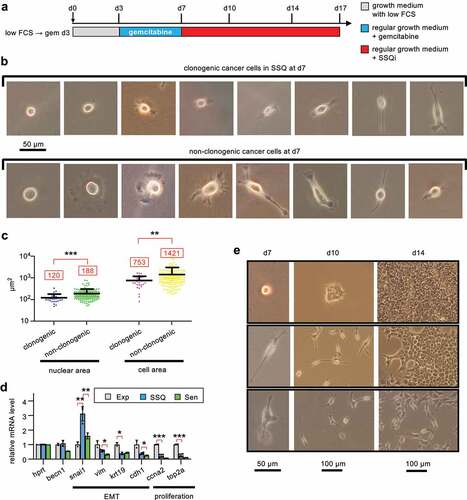
The spindle-shaped of most cancer cells in SSQ suggested that these cells had undergone an Epithelial-Mesenchymal Transition. This was consistent with increased expression of Snai1, a potent EMT inducer, and decreased expression of epithelial markers (Cdh1 and Krt19) in SSQ-enriched cell populations compared to proliferating cells (). Senescent cells populations derived from medium cell density cultures treated with gemcitabine plus SSQi for about 10 days showed no significant Snai1 induction highlighting that Snai1 induction in SSQ-enriched cell populations did not result of their contamination by senescent cells (). The prevalence of the mesenchymal phenotype in SSQ cancer cells was supported by the observation that 26 of 29 growing cell clones that formed after 3 days of culture in SSQi-supplemented medium (on day 10; n = 13 ± 7.3 cells/clone; median ± standard deviation) were composed of scattered spindle-shaped cells, whereas only 3 clones were epithelial type (see, for example, middle column). The persistence of a mesenchymal phenotype over multiple cell generations was remarkable since native KC-DT66066 cultured at medium cell density exhibited a marked epithelial phenotype (see for instance Fig S1C). However, 25 of 29 cell clones had switched to an epithelial phenotype by day 14 and 28 of 29 by day 17 (see also, right column). Interestingly, a delayed transition to an epithelial phenotype was significantly associated to a low clonal cell growth rate, since the four clones that transitioned after day 14 were small compared to only 8 of the 24 that transitioned before day 14 (p < 0.02 using a Fisher’s exact probability test; see for an instance).
SSQ regulates tumor growth in vivo in mice
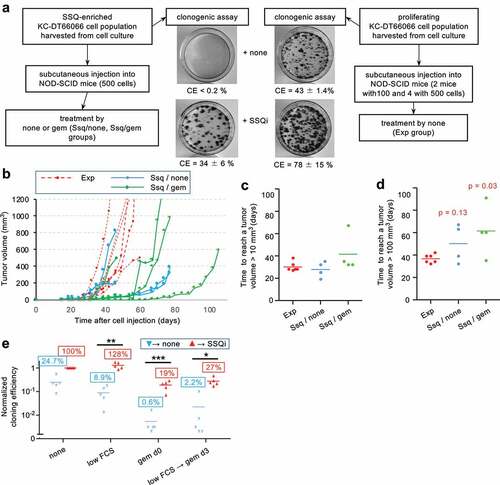
When 106 carefully dissociated KC-DT66066 cells harvested from growing cultures were subcutaneously injected in allogenic C57Bl/6 mice, they gave rise to fast-growing tumors that began to regress after approximately one week due to immune rejection of cancer cells. Even during this short period of growth, we observed a higher tumor growth rate with Beclin-1 deficient cell population (KCshBecn1) compared to the control (KCshgfp) (Fig S3A). Interestingly, we found that treatment with a high dose of gemcitabine on day 4 after cell injection increased KC cell tumorigenicity, possibly by depressing the immune response (data not shown and see [Citation26]. Under these conditions, the higher growth rate of KCshBecn1 cells was confirmed because KCshbecn1 cells, but not the control population, were able to out-compete the immune response (Fig S3B). Considering that KCshbecn1 and KCshgfp cell populations exhibited the same growth rate in 2D culture at medium cell density (Fig S3C) and the same percentage of clonogenic cells (compare none→ SSQi in ), these experiments suggested that a significant fraction of control cells could enter SSQ in vivo, resulting in a lower tumor growth rate. Of note, they also showed that KC-DT66066 cells exhibited high resistance to gemcitabine in vivo, which was not dependent on Beclin-1 expression. To further investigate the role of SSQ in regulating tumor growth, we analyzed the tumorigenicity of KC-DT66066 cells in immunodeficient NOD-SCID mice. As few as 100 dissociated cells harvested from exponentially growing cell cultures gave rise to rapidly growing tumors in these hosts (Fig S3D). To test the contribution of cells in SSQ, we subcutaneously injected 4 mice with 500 cells obtained from exponentially-growing culture (which were refer to as the Exp group that additionally included 2 mice previously injected with 100 proliferating cells, n = 6) and 8 mice with 500 cells enriched for SSQ by Torin 1 treatment and gemcitabine selection in cell culture (). Mice injected with cells enriched for SSQ were further divided into 2 groups that were treated with saline (Ssq/none group, n = 4) and gemcitabine on the 4th and 11th day after cell injection (Ssq/gem group, n = 4; and Methods). Gemcitabine treatment was performed with the aim of counter selecting cancer cells that started to proliferate shortly after cell injection to further enrich the injected cells for SSQ cells in vivo. A distinct palpable tumor mass (≈10 mm3) could be detected in all the mice in the Exp and Ssq/none groups and in 3 of the 4 mice in the Ssq/gem group around the 30th day after cell injection (). These results indicated that the initial phase of tumor growth was not significantly affected by the state of the cells prior to injection or by treatment with gemcitabine. However, subsequent tumor growth differed in the groups of mice injected with SSQ cells. While all tumors in mice of the Exp group grew vigorously and rapidly reached a tumor volume of 100 mm3 approximately one week later (36.7 ± 3.9 days, mean ± s.d., n = 6), 2 tumors out of 4 in mice in the SSQ/none group thereafter grew very slowly and reached 100 mm3 only at day 67 after cell injection. This corresponded to a difference with the mean tumor growth time of the Exp group of more than 7 times the standard deviation of the tumor growth times in the Exp group (). Such a difference makes the occurrence of slow-growing tumors unlikely in the Exp group if a Gaussian distribution of tumor growth rates in this group is assumed. Additionally, a third mouse in the Ssq/none group developed a tumor that rapidly reached 200 mm3 on day 37, but then stopped growing until this mouse was sacrificed on day 47 due to skin ulceration (). The proportions of slow-growing tumors in the Exp and Ssq/none groups (0/6 vs 3/4) were found statistically different as calculated with a Fisher’s exact probability test (p = 0.033). This confirmed that the formation of tumors with a slow-growing phenotype is promoted by the injection of cancer cells in SSQ. Similar observations were made with mice in the Ssq/gem group (3 of 4 mice also developed slow-growing tumors), but one mouse also showed delayed formation of a palpable tumor (it was detected on day 65 after cell inoculation; ) in addition to slow tumor growth (). This showed that cancer cells in SSQ promoted the formation of indolent tumors at high frequency and that SSQ could also impede the early phase of tumor growth. Nonetheless, all of the indolent tumors, including the one that had been indolent for two months, eventually transitioned to a rapidly growing phase, consistent with our concept of a stable but reversible quiescence (). Genes expression profiling of growing tumors by RT-qPCR analysis did not reveal any significant difference associated with the status of the injected cells (correlation coefficient r > 0.99, n = 17 genes analyzed, p < 0.0001; Fig S3E and S1 file). Interestingly, in comparison with exponentially growing KC-DT66066 cells in 2D-cultures, all growing tumors displayed an increased expression level of the Lgr5 stemness marker, as observed for cells growing in spheroids (compare and S3E). This analogy between spheroids and tumors was further supported by analysis of the clonogenicity of dissociated tumor cells, as previously done for spheroids ( , and method). This not only confirmed the presence within the tumors of significant populations of cells in SSQ (18.7 ± 8.2% of clonogenic tumor cells selected with the gem d0 clonogenic assay, mean ± sd, n = 5; ), but also revealed that clonogenic tumor cells were prone to enter SSQ (27.3 ± 11.4% of the clonogenic tumor cells selected with the low FCS→ gem d3→ SSQi clonogenic assay, mean ± sd; n = 5; ). Interestingly, in tumors that grew in allogenic C57Bl/6 mice injected with 106 proliferating KC-DT66066 cells, clonogenic assays also revealed cancer cells in SSQ or prone to enter SSQ , but at lower frequencies (1.3 ± 0.7% and 3.0 ± 1.7% of clonogenic cells in the gem d0 and low FCS→ gem d3 clonogenic assays, respectively, mean ± sd, n = 5). However, these frequencies significantly increased when C57Bl/6 mice were treated with cyclosporine, an immunosuppressive agent (4.50 ± 1.1% and 14.8 ± 4.9% of clonogenic cells, respectively; n = 4, p < 0.002; see Methods for more details), suggesting that immune response could modulate the frequency of SSQ cells in tumors.
Figure 5. SSQ regulates tumor development. a) Outlines of the experiment performed to compare tumorigenicity of KC-DT66066 cells in a proliferating state or in SSQ. b) Tumor growth curves in individual NOD-SCID mice subcutaneously injected with proliferating KC-DT66066 cells (Exp group, n = 6) or with cells in SSQ and treated with none (Ssq/none group, n = 4) or gemcitabine (Ssq/gem group; n = 4). c) and d) Scatter plots showing the time taken for tumors to reach a volume of 10 mm3 (c) or 100 mm3 (d). p indicates the statistical significance of the difference in the proportion of mice with a slow tumor growth rate as calculated with a Fisher’s exact probability test. Note that a third tumor in the Ssq/none group showed a slow tumor growth rate but only after having reached 200 mm3 (see Fig 5B and main text). e) Growing tumors contain a significant percentage of cancer cells in SSQ or prone to enter SSQ. Clonogenic assays using cells dissociated from growing tumor resected from mice in the Exp (n = 1), Ssq/none (n = 2) and Ssq/gem (n = 2) groups and directly tested for SSQ as described in . Data were normalized to 100% of cloning efficiency in the none → SSQi clonogenic assay. * indicates the statistical significance of the change in CE induced by SSQi supplementation. Note that spontaneous reversion of SSQ (that could be observed with the clonogenic assay low FCS → gem d3→ none) strongly increased in some dishes containing a high absolute number of cells in SSQ as observed in .
High Beclin-1 level and low mTOR activity in the primary tumor of PAAD patients is predictive of late metastatic recurrence
Based on our results in mice, primary tumors with a relatively low level of Beclin-1 expression should release cancer cells that are not prone to enter SSQ, and thus cause a lower rate of late metastasis if SSQ constitutes the only mechanism controlling delayed metastases development in pancreatic adenocarcinoma (PAAD). Analysis of PAAD patient records downloaded from the Genomic Data Commons website (see Methods) showed that the rate of distant metastases in the first 360 days after initial treatment did not differ significantly between cohorts of patients with low and high level of Beclin-1 transcripts in their primary tumors (). However, beyond 360 days, a low level of Beclin-1 transcripts in the primary tumor was associated with a decreased rate of distant metastases ( and see the Methods section for the determination of the cutoff value of BECN1 mRNA levels used throughout this study). This remained true when we restricted the analysis to patients with a similar T3N1M0/Mx clinical grade (Fig S4A-B), suggesting that Beclin-1 expression level is a predictive factor of late metastasis independent of TNM grade. To further establish the biological relevance of a 360-day cutoff for classifying patients as developing early or late metastases, we compared the primary tumors transcriptomes of patients with distant metastasis-free survival less than and greater than 360 days by Gene Set Enrichment Analysis (GSEA). GSEA recovered only eight statistically significant genes sets with a false discovery rate (FDR) q < 0.05. They showed that primary tumors from patients with a distant-metastasis-free survival inferior to 360 days were enriched for genes regulated by MYC transcription factor, mTORC1 signaling and the unfolded protein response ( and see Fig S4C for others miscellaneous gene sets). This suggested that a distinguishing feature of tumors from patients with a distant metastasis-free survival inferior to 360 days might be enrichment in proliferating cells (enhanced MYC activity) that exhibited higher protein synthesis (enhanced mTORC1 signaling) associated with endoreticulum stress (enhanced unfolded protein response). Thus, we analyzed distant metastasis-free survival of PAAD patients according to the relative level of Cyclin A2 (CCNA2, a marker of cell proliferation) in their primary tumor since mTORC1 activity seemed to be associated with tumor cell proliferation in the primary tumors. A high level of Cyclin A2 transcript was found to be a very strong predictor of early metastasis with a median survival time of 291 days versus 763 days in the cohort of patients with a low level of Cyclin A2 transcript ( and see the Methods section for the determination of the cutoff value of CCNA2 mRNA levels used throughout this study) and this was independent of TNM grade (Fig S4D). Independence was also confirmed by multivariate Cox regression analysis (data not shown). GSEA showed that primary tumors with a high level of Cyclin A2 transcripts were highly enriched for classical hallmarks of cell proliferation, but also enhanced mTORC1 signaling and unfolded protein response ( and S4E), as anticipated above. The strong correlation between the transcript levels of Cyclin A2 and of markers of mTORC1 activity in the primary tumors of PAAD patients were confirmed by hierarchical gene clustering (). Interestingly, this analysis also showed that levels of Beclin-1 and Cyclin A2 transcripts (as well as mTORC1 activity marker genes) were positively correlated with levels of cancer cell markers but not mesenchymal, endothelial, or immune cell markers ( and S4F). This suggested that transcript levels of Beclin-1 and Cyclin A2 in the primary tumors were mainly determined by cancer cells.
Figure 6. Elevated Beclin-1 expression in the primary tumor of PAAD patients is associated with an increased rate of metastasis in the patient cohort with a metastasis-free survival greater than 360 days. a) Kaplan–Meier curves for distant metastasis-free survival in PAAD patients according to the level of Beclin-1 transcripts in their primary tumor. b) Same as (a) but restricted to patients with survival time greater than 360 days. Initial treatment was partial or total pancreatectomy to remove the tumor and at least 78% of patients received adjuvant pharmaceutical treatments (see S2 file). Significance (p) of the difference in survival and hazard ratio (HR) were calculated with a Mantel-Cox Log-ranked test. c) Gene set enrichment analysis (GSEA) showing significant enrichment for hallmarks of MYC, mTORC1 and unfolded protein response signaling activity [Citation57] in primary tumors of PAAD patients with a distant-metastasis-free survival time less than 360 days after initial treatment (n = 60) versus greater than 360 days (n = 64). Normalized enrichment score (NES), its statistical significance (p) and its false discovery rate (FDR) are indicated.
![Figure 6. Elevated Beclin-1 expression in the primary tumor of PAAD patients is associated with an increased rate of metastasis in the patient cohort with a metastasis-free survival greater than 360 days. a) Kaplan–Meier curves for distant metastasis-free survival in PAAD patients according to the level of Beclin-1 transcripts in their primary tumor. b) Same as (a) but restricted to patients with survival time greater than 360 days. Initial treatment was partial or total pancreatectomy to remove the tumor and at least 78% of patients received adjuvant pharmaceutical treatments (see S2 file). Significance (p) of the difference in survival and hazard ratio (HR) were calculated with a Mantel-Cox Log-ranked test. c) Gene set enrichment analysis (GSEA) showing significant enrichment for hallmarks of MYC, mTORC1 and unfolded protein response signaling activity [Citation57] in primary tumors of PAAD patients with a distant-metastasis-free survival time less than 360 days after initial treatment (n = 60) versus greater than 360 days (n = 64). Normalized enrichment score (NES), its statistical significance (p) and its false discovery rate (FDR) are indicated.](/cms/asset/1648ea8a-aa8a-403c-ab77-299d2996bfa6/kccy_a_2123187_f0006_oc.jpg)
Figure 7. Cyclin A2 marks tumors with elevated mTORC1 activity and combines with Beclin-1 to predict kinetics of metastases development. a) Kaplan–Meier curves for distant metastasis-free survival in PAAD patients with high or low level of Cyclin A2 (CCNA2) transcripts in their primary tumor. b) GSEA demonstrates significant enrichment for hallmarks of cell proliferation and mTORC1 signaling [Citation57] in the primary tumors of PAAD patients with high level (n = 31) versus low level (n = 93) of CCNA2 transcripts. Normalized enrichment score (NES), its statistical significance (p) and its false discovery rate (FDR) are indicated. c) Hierarchical clustering of genes according to the Pearson correlation of their transcription levels in the primary tumors of PAAD patients (n = 124). The colors indicate the value of the Pearson correlation coefficient for a given gene pair, ranging from −1 (blue) to + 1 (red). The mTORC1 genes markers correspond to the first 15 highest ranked genes composing the mTORC1 signaling signature derived by GSEA analysis of PAAD tumors in (gene set M5924 [Citation57]). d) Kaplan–Meier curves for distant metastasis-free survival in PAAD patients with survival time less than 360 days according to the transcript levels of cyclin A2 (CCNA2) and Beclin 1 (BCEN1) in their primary tumor. e) Same as panel D), but limited to patients with a survival time greater than 360 days. Log-ranked (Mantel-Cox) test was used to calculate the statistical significance (p) of the differences in distant metastasis-free survival between adjacent survival curves and corresponding hazard ratios (HR).
![Figure 7. Cyclin A2 marks tumors with elevated mTORC1 activity and combines with Beclin-1 to predict kinetics of metastases development. a) Kaplan–Meier curves for distant metastasis-free survival in PAAD patients with high or low level of Cyclin A2 (CCNA2) transcripts in their primary tumor. b) GSEA demonstrates significant enrichment for hallmarks of cell proliferation and mTORC1 signaling [Citation57] in the primary tumors of PAAD patients with high level (n = 31) versus low level (n = 93) of CCNA2 transcripts. Normalized enrichment score (NES), its statistical significance (p) and its false discovery rate (FDR) are indicated. c) Hierarchical clustering of genes according to the Pearson correlation of their transcription levels in the primary tumors of PAAD patients (n = 124). The colors indicate the value of the Pearson correlation coefficient for a given gene pair, ranging from −1 (blue) to + 1 (red). The mTORC1 genes markers correspond to the first 15 highest ranked genes composing the mTORC1 signaling signature derived by GSEA analysis of PAAD tumors in Figure 6(c) (gene set M5924 [Citation57]). d) Kaplan–Meier curves for distant metastasis-free survival in PAAD patients with survival time less than 360 days according to the transcript levels of cyclin A2 (CCNA2) and Beclin 1 (BCEN1) in their primary tumor. e) Same as panel D), but limited to patients with a survival time greater than 360 days. Log-ranked (Mantel-Cox) test was used to calculate the statistical significance (p) of the differences in distant metastasis-free survival between adjacent survival curves and corresponding hazard ratios (HR).](/cms/asset/27b19ce2-e5a6-47f4-847a-4ee2ccb724ed/kccy_a_2123187_f0007_oc.jpg)
The combination of Beclin-1 and Cyclin A2 markers showed that all metastatic events within the first 360 days after initial treatment were associated with tumors with either high Cyclin A2 or both low Cyclin A2 and low Beclin-1 expression (). Remarkably, patients whose tumors exhibited both low Cyclin A2 and high Beclin-1 expression did not develop metastases within the first 360 days after initial treatment (). However, after 360 days, patients with both low Cyclin A2 and high Beclin-1 expression exhibited a higher rate of distant metastasis compared to patients with both low Cyclin A2 and low Beclin-1 expression in their primary tumors (). Taken together, this strongly suggests that Beclin-1 abundance and mTORC1 activity in the primary tumor of PAAD patients determine the kinetics of occurrence of clinical metastases. This was further confirmed by analyzing the statistics of
the relative proportions of early and late clinical metastasis (before and after 360 days) according to tumor phenotype of patients with a T3N1M0/x clinical grade (). This showed that late clinical metastasis was mainly associated with the CCNA2low BECN1high primary tumor phenotype and early clinical metastasis to the CCNA2high and the CCNA2 low BECN1low primary tumor phenotypes.
Table 2. Early and late (before and after 360 days, respectively) distant metastases events recorded in T3N1M0/x PAAD patients according to their primary tumor phenotype.
Discussion
We showed here that cancer cells in SSQ can be selected with anticancer agents including gemcitabine, vincristine, nocodazole, doxorubicin, oxaliplatin and taxol in vitro (, S1D-F) and possibly also in vivo (). This suggests that SSQ could promote the persistence of disseminated cancer cells after adjuvant chemotherapies. Analysis of the mechanisms of SSQ induction showed that culture at low cell density induces SSQ in prostatic and pancreatic adenocarcinoma cells ( and [Citation9,Citation10]). By investigating why SSQ is also induced at high cell density in non-growing cell aggregates or in growing cancer cell spheroids generated in 3D culture (), we found that it is induced by mTOR inhibition. Indeed, pretreatment of growing cancer cells cultured in 2D at medium cell density with rapamycin or Torin1, two standard pharmacological inhibitors of mTOR activity, is sufficient to induce SSQ and also synergizes with low cell density for SSQ induction ( and S2A-B). As cell proliferation depends on mTOR activity [Citation27–29], this implies that proliferating cells are not prone to enter SSQ, in agreement with our finding that exponentially growing cell cultures in 2D exhibited low frequency of cancer cells already in SSQ and are modestly induced to enter SSQ after seeding at low cell density (). Inversely, in 3D cultures, high levels of autophagy (, g)) indicate that mTOR activity was downregulated in a large fraction of cells since mTOR activity inhibits autophagy. An unexpected result is that induction of SSQ requires Beclin-1 expression but was independent from autophagy. Indeed, downregulation of Beclin-1 inhibits SSQ induction but not autophagy () and autophagy inhibition with bafilomycin A1 does not prevent SSQ induction by Torin1 (Fig S2D-E). Moreover, transduction of a constitutively active Beclin-1 mutant, defective in its binding to Bcl2/Bclx inhibitors, increased both basal autophagy flux and its stimulation by mTOR inhibitors, but had no effect on SSQ induction (Fig S2F-H). This confirmed that autophagic flux does not regulates SSQ induction and thus that Beclin-1 is likely to be required for SSQ through autophagy-independent pathways. Several publications have already reported autophagy-independent roles for Beclin-1. Beclin-1 regulates degradation of cell membrane receptors for growth factors and transferrin through the control of endolysosomal trafficking [Citation17,Citation30–32]. It can also inhibit the System Xc- cystine/glutamate antiporter involved in cystine uptake, thus impacting cellular thiol redox potential [Citation33], and also the Stat3 signaling pathway [Citation34]. These actions of Beclin-1 could contribute to two main features of cancer cells in SSQ which are the absence of proliferating response to stimulation by external growth factors and a decrease in the redox potential of cellular thiols. Considering that mTOR activity is regulated by nutrient depletion, cellular thiol redox potential and growth factor signaling [Citation35–45], activation of Beclin-1 through inhibition of mTOR activity could therefore promote the establishment of a self-sustained inhibitory loop maintaining a low mTOR activity (). As mTOR also directly control cell proliferation through its regulation of c-Myc activity and Cyclin D accumulation [Citation27–29], our data point toward a central role of mTOR downregulation in the induction and maintenance of self-sustained quiescence (). An issue of this study concerns the role of EMT in SSQ. We observed that pancreas cancer cells in SSQ exhibit a mesenchymal phenotype (). This mesenchymal phenotype is obviously not sufficient to maintain SSQ since it often persisted for several cell generations after the transition from SSQ to a proliferating state (). However, it could promote the transition between proliferating and SSQ states. This would be consistent with the high frequency of the mesenchymal phenotype in SSQ cancer cells (). Additionally, the slower growth of cell clones with a mesenchymal phenotype could also result from a higher rate of mesenchymal cell reentry in SSQ (see and the corresponding Results section).
Figure 8. A molecular model of self-sustained quiescence. mTORC1 is a central node in the regulatory network controlling cell proliferation, for instance by regulating c-Myc activity, cyclin D accumulation and protein synthesis. Activation of Beclin-1 by downregulation of mTORC1 activity leads to activation of a regulatory loop (red circle in right panel) that helps to maintain a low mTORC1 activity. Indeed, Beclin-1 induced the degradation of cell surface receptor for growth factors and iron (transferrin receptor), and directly inhibits the Xc- cystine/glutamate antiporter [Citation17,Citation30–33], which inhibits mTOR activity via nutrient depletion, oxidative stress and suppression of growth factors signaling pathways [Citation35,Citation38,Citation40–45]. Note that BMP signaling stabilizes SSQ in prostate cancer cells [Citation8,Citation10] but appears to play a minor role in PAAD cells (see Methods for details and data not shown). EMT possibly favors the entry in SSQ and MET the maintenance of the proliferating state. The bold corresponds to activated signaling pathways while the dotted line corresponds to repressed pathways.
![Figure 8. A molecular model of self-sustained quiescence. mTORC1 is a central node in the regulatory network controlling cell proliferation, for instance by regulating c-Myc activity, cyclin D accumulation and protein synthesis. Activation of Beclin-1 by downregulation of mTORC1 activity leads to activation of a regulatory loop (red circle in right panel) that helps to maintain a low mTORC1 activity. Indeed, Beclin-1 induced the degradation of cell surface receptor for growth factors and iron (transferrin receptor), and directly inhibits the Xc- cystine/glutamate antiporter [Citation17,Citation30–33], which inhibits mTOR activity via nutrient depletion, oxidative stress and suppression of growth factors signaling pathways [Citation35,Citation38,Citation40–45]. Note that BMP signaling stabilizes SSQ in prostate cancer cells [Citation8,Citation10] but appears to play a minor role in PAAD cells (see Methods for details and data not shown). EMT possibly favors the entry in SSQ and MET the maintenance of the proliferating state. The bold corresponds to activated signaling pathways while the dotted line corresponds to repressed pathways.](/cms/asset/125eb4ad-2343-44fa-b59a-3d78155d7fd6/kccy_a_2123187_f0008_oc.jpg)
Another result of our work is that dissociated PADC cells in SSQ injected into mice promoted the delayed formation of a palpable tumor in one case, as expected for the dormant phenotype of cancer cells in SSQ in vitro, but also, quite unexpectedly, the formation of small, slow-growing (indolent) tumors in most cases (). Our data suggest that SSQ can directly regulate tumor cell growth and thus tumor indolence when tumor is composed of a high percentage of SSQ-competent cells. Indeed, we observed that the mouse tumor microenvironment promotes SSQ. A large fraction of clonogenic cancer cells dissociated from resected tumors were found to be in SSQ or prone to enter SSQ after cell plating at low cell density, this even in tumors resulting from the injection of exponentially growing cancer cells exhibiting a low frequency of cells in SSQ or competent for SSQ (see the Result section and also compare data in . This SSQ-promoting effect of tumor microenvironment could explain why tumors generated by the injection of a large number of exponentially growing cancer cells rapidly exhibit a higher growth rate when these cells have been made defective for SSQ by Beclin-1 downregulation whereas downregulation of Beclin-1 has no effect on proliferation of cells cultured at medium cell density (Fig S3A-C). Accordingly, a plausible mechanism of long-term tumor indolence is the maintenance of a high percentage of cancer cells in SSQ through the continuous induction of SSQ by tumor microenvironment (see also above the discussion on the possible role of EMT in SSQ reentry). Breaking this steady state through the rapid outgrowth of cancer cells refractory to SSQ induction or changes in the tumor microenvironment would resume a high tumor growth rate. Taken together, these results challenges models of tumor dormancy that posit a dynamic balance between cancer cell proliferation and cell death caused by antitumor immunity and insufficient tumor vascularization [Citation46].
Our analysis of the relationship between metastasis in PAAD patients and gene expression in their primary tumor showed that tumors that are expected to contain and therefore disseminate clonogenic cancer cells that are not prone to enter SSQ mainly give rise to early clinical metastasis whereas those that are likely to disseminate cancer cells in SSQ or poised to enter SSQ give rise to late clinical metastasis ( and ). Indeed, tumors expressing a higher level of Cyclin A2, a marker of cell proliferation, also exhibit higher mTORC1 activity (), which inhibits induction of SSQ (see discussion above and ). Similarly, a low level of Beclin-1 transcripts was found to decrease the ability to enter SSQ (), even in growth-arrested cells cultured in 3D (data not shown). Conversely, a high level of Beclin-1 expression, when combined with low mTORC1 activity associated with low Cyclin A2 expression, is expected to promote entry in SSQ (). Of note, Cyclin A2 mRNA, in addition to being a marker of cell proliferation, is also a hallmark of c-Myc activity (it is the highest ranked gene in the GSEA analyses showing enrichment for c-Myc targets in and the eighteenth ranked gene in ). Correlatively, one of the most distinctive features of patients with early metastasis is an enrichment of their primary tumor with cellular markers of c-Myc activity (. This suggests that c-Myc activity per se could be a better hallmark of mTORC1 activity in primary tumors rather than cell proliferation, which is consistent with c-Myc regulation by mTORC1 signaling via Beclin-1-dependent and independent pathways [Citation27,Citation47].
Beclin-1 is often considered a haplo-insufficient tumor suppressor gene since Beclin-1 can inhibit tumorigenesis [Citation48] and an allele of this gene is frequently deleted in advanced cancers [Citation49]. A high Beclin-1 expression level in the primary tumor of PAAD patients was successively associated with a low rate of metastasis in one study and then with a high rate of metastasis in another [Citation50,Citation51]. This paradox could partly result from the short follow-up of patients with high Beclin-1 in the first study, since we found that high Beclin-1 expression shows a trend to promote a lower rate of early metastasis (). However, it should be noted that our data support the idea that Beclin-1, combined with mTORC1 activity, primarily determines the kinetics of metastases development and not the overall rate of metastasis.
A possible direct clinical application of our results is a better selection of patients eligible for early and aggressive adjuvant chemotherapy. Indeed, our results suggest that patients with a primary tumor associated with dispersion of cancer cells not entering SSQ could benefit from aggressive chemotherapy since their dispersed cancer cells are expected to be sensitive to anticancer agents. It is crucial that adjuvant chemotherapy begins as early as possible since cancer cells grown in tumor masses gained new mechanisms of resistance to anticancer agents compared to dispersed cancer cells, including the possible de novo generation of cancer cells in SSQ within growing metastases microenvironment. Patients with dispersed cancer cells only in SSQ (patients with a primary tumor phenotype associated with late metastasis or treated once by an aggressive adjuvant chemotherapy) are unlikely to respond well to chemotherapy since these cancer cells are resistant to anticancer agents even when they are dispersed. Therefore, the development of new agents targeting cancer cells in SSQ seems essential. Complete elimination of dispersed cancer cells in SSQ may require the identification of agents that are effective in stably reversing SSQ in vivo to restore cancer cell susceptibility to chemotherapy or in directly killing cancer cells in SSQ.
Materials and methods
Cells
All cells were cultured under 5% CO2 at 37°C in Dulbecco’s Modified Eagle’s Medium-high glucose (4.5 g.L−1 glucose, glutamax 1X; #D0819 Sigma Aldrich) supplemented with fetal calf serum (10% of DMEM volume; # 10,270–106; various lots; GIBCO, Life Technologies), pyruvate 1 mM (#CSTVAT00-0 U from EUROBIO), penicillin/streptomycin 1X (# 15,140–122 from GIBCO), to which distilled water was added (17.6% of DMEM volume) to make it isotonic (isoDMEM-FCS). Final fetal calf serum (FCS) concentration was 7.9% in growth medium and was decreased to 1.9% for low FCS condition by dilution with growth medium without FCS. For subculturing, cells were harvested after 5 min treatment with 0.25% trypsin-EDTA (# 25,200–056 from Gibco) supplemented with 1 mM pyruvate (Tryp-EDTA-Pyr), dissociated by pipetting, counted using a hemocytometer if necessary and inoculated at a dilute density. KC-DT66066, KC-A338, and KPC-A219 are independent cell lines derived from pancreas ductal adenocarcinoma (PDAC) developed in genetically engineered LSL-KrasG12D/+, Pdx1-Cre (KC) and LSL-Trp53R172H/+, LSL-KrasG12D/+, Pdx1-Cre (KPC) mouse models of spontaneous PDAC, respectively [Citation11,Citation12]. All KC and KPC-A219 cells were derived in J. Guillermet laboratory under a genetic C57Bl/6 × CD1 and C57Bl/6 × CD1 × 129 genetic background, respectively, and were authenticated by PCR. Human LNCaP* and LNCaP C4–2 (RRID:CVCL_4782) prostate adenocarcinoma were characterized previously [Citation10]. Cells were found to be free of mycoplasma by a PCR test carried out on their supernatant.
Reagents
anti-Beclin-1 (clone D40C5, #3495S), anti-GAPDH (clone D16H11, #5174), anti-4E-BP1 (clone 53H11, #9644), anti-phospho-4E-BP1 (Thr37/46; clone 236B4, #2855), anti-p70 S6 kinase (clone 49D7, #2708), anti-phospho-p70 S6 kinase (Thr389) (clone 108D2, #9234) and anti-LC3A/B (clone D3U4C, # 12,741) were rabbit monoclonal antibodies from Cell Signaling Technology. Anti-Akt (#9272) and anti-phospho-Akt (S473; #9271) were rabbit polyclonal antibodies from Cell Signaling Technology. Anti-SQSTM1 (#GT239) was a mouse monoclonal antibody from Invitrogen. Secondary HRP-linked anti-mouse IgG (7#076S) and anti-rabbit IgG (#7074S) were from Cell Signaling Technology. K02288 (#AB-M2789-10 MG), Torin1 (#F6100-UBP) and rapamycin (#AB-M1768-25 MG) were from AbMole BioScience (USA), N-acetyl-L-cysteine (#A7250) from Sigma-Aldrich, Nocodazole (#F6120-UBP) from UPBIO. Gemcitabine chlorhydrate and Cyclosporin A were from Sandoz (France) and Vincristine Sulfate from Hospira (France). Lipofectamine 3000 kit (#L3000–00) was from Invitrogen. LightCycler 480 SYBR Green I Master kit (#04707516001) was from Roche Diagnostics, USA)
Clonogenic assays
2D-cultured murine pancreas and human prostate C4–2 cells were seeded at 103 cells per 60 mm diameter tissue culture-treated polystyrene dish (# 430,169, Corning, NY, USA) for selection of SSQ cells with anticancer agents, otherwise at 102 cells per dish and cultured as indicated. Human LNCaP* cells were seeded at 5000 cells per 6 cm diameter dish and cultured as indicated. To test the cloning efficiency (CE) of cells from 3D-cultures, cells were harvested, washed one time with Tryp-EDTA-Pyr and then dissociated by incubation for 20 minutes in Tryp-EDTA-Pyr at 37°C with regular pipetting. Complete growth medium was added and cells were filtered through a 70 µm Cell Strainer (Falcon, Corning), washed once with complete growth medium, counted, and plated at low cell density as needed. For the CE tumor cell assay, tumors were minced and cells dissociated using the same protocol as for spheroids. Only cells larger than 20 µm were counted with a hemocytometer to calculate cell dilutions for clonogenic assays (cells smaller than 20 µM were not clonogenic). In 7 of the 8 tumors analyzed, more than 90% of the clonogenic tumor cells were KC-DT66066 cells that generated easily recognizable dense and rapidly growing cell clones. In 1 tumor from the Ssq/none group that was not included in CE analysis, long-lived fibroblastic cells constituted more than 90% of the clonogenic tumor cells and generated only sparse, slow-growing fibroblastic cell clones. Cell clones were fixed in 50% ethanol and 10% acetic acid, stained with Crystal Violet and counted manually (clones with a diameter >0.5 mm). Cloning efficiency (CE) was calculated as the ratio of the number of cell clones to that of seeded cells. Cloning efficiency in the presence of SSQ inhibitors (SSQi) was used as a measure of the percentage of clonogenic cells. The fraction of cells in SSQ in a cell population was defined as the cloning efficiency of cells from that population in the gem d0→ SSQi clonogenic assay ( and main text). SSQi (NK, GK, or GSK) consisted of a reduced thiol (N-Acetylcysteine (NAC or N) or glutathione (G) which could be used with similar efficacy at optimal concentrations) at 1 or 4 mM for murine and human cells, respectively, and of K02288 (K, an inhibitor of BMP signaling) at 100 nM. In murine PDAC cells, K02288 increased by about twofold the recovery of proliferating cell clones from cells in SSQ when NAC concentration was below 0.5 mM but was otherwise unnecessary at 1 mM NAC concentration. Similarly, SB505124 (an inhibitor of TGF β signaling) was used with K002288 and glutathione (GSK) to reverse SSQ in LNCaP* cells, but its effect was statistically insignificant.
3D culture
Cells were harvested from 2D cultures by treatment with Tryp-EDTA-Pyr, counted, and seeded into 24 well plates (Cellstar, cell-repellent surface, # 664,970, Greiner Bio-One Gmbh) or into 6 cm dishes (Ultra-Low Attachment, #3261, Corning, NY, USA) at a concentration of 104 and 105 cells per well or dish, respectively, in regular growth medium and cultured for up to 11 days. Conditioned Medium (CM) was isoDMEM-FCS harvested from primary cultures of fibroblasts derived from 13.5 days C57Bl/6 embryos and made senescent by gemcitabine treatment at 100 ng/ml for 7 days. The CM was filtered through 0.2 µm sized-pore filter and in some experiments concentrated with Amicon Ultra centrifugal filters with a cutoff of 50 kDa or 300 kDa.
Identification of cancer cells in SSQ in low density 2D KC-DT66066 cell culture
Individual cancer cells pretreated with Torin-1 at medium cell density were followed from day 7 of the low FCS→ gem d3→ SSQi clonogenic assay by photographing them with a Olympus I×70 inverted phase contrast microscope using 20X LCPlan FI Ph1 and 10X UPlan F1 Ph1 objectives and a mounted Canon EOS 6D camera. Pictures (in jpg format ; 5 to 12 pixels per microns) were manually analyzed using the polygonal enclosing tool of ImageJ. In spindle-shaped cells, the nuclear membrane was often indistinct, so we measured area of a nuclear region including nucleus and/or a perinuclear region enriched in vesicles, both exhibiting a specific granular texture and dark yellow-brown color (see ). The mean value of the area of this nuclear region was close to that of the area of the nucleus measured in confluent KC-DT66066 cells in which nuclear membrane was unambiguously identified.
Recombinant retrovirus
To downregulate Beclin-1 expression we used recombinant lentiviral vectors, pLKO1-shBecn1, that encode validated shRNA [Citation52,Citation53] from the RNAi Consortium (clones TRCN0000087290 and TRCN0000087292 with target sequence 5’-GCGGGAGTATAGTGAGTTTAA-3’ and 5’-CGGACAGTTTGGCACAATCAA-3’, respectively, distributed by Sigma-Aldrich, Merck, France. pLKO1-shgfp [Citation54] was a gift from David Sabatini (Addgene plasmid # 30,323; http://n2t.net/addgene:30323; RRID:Addgene_30323), pMRX-IP-GFP-LC3-RFP-LC3ΔG [Citation15] a gift from Noboru Mizushima (Addgene plasmid # 84,572; http://n2t.net/addgene:84572; RRID:Addgene_84572) and lenti-HA-mBec1 F121A [Citation22] a gift from Congcong He (Addgene plasmid # 99,506; http://n2t.net/addgene:99506; RRID:Addgene_99506). To produce retroviral particles, 2 µg of the plasmid carrying the relevant recombinant provirus was co-transfected with 2 µg of plasmid pMD2.G (a kind gift from D. Trono) and 2 µg of plasmid PVPackgagpol (# 217,566 from Stratagene, La Jolla, CA) or plasmid pCMV-ΔR8.74 (a gift from D. Trono) (for Moloney Murine Leukemia Virus and Human Immunodeficiency Virus derived retroviral backbone, respectively) in 90% confluent HEK293T cells plated in 6 cm diameter dishes using lipofectamine 3000 kit (12 µL of P3000 and 14 µL of Lipofectamine 3000 used). Supernatant were filtered through 0.4 µM filter and used to infect exponentially growing cells. Transduced cells were selected with puromycin (Calbiochem; 1 to 2 µg/ml) or directly used in some superinfection experiments with MRX-IP-GFP-LC3-RFP-LC3ΔG.
Flow cytometry analysis of autophagic flux
Cell transduced with MRX-IP-GFP-LC3-RFP-LC3ΔG vector were seeded at 4 × 10⁵ cells per 6 cm diameter dish (day 0), treated at day 1 as indicated and dissociated and harvested in cold culture medium at day 2 by strong pipetting after Tryp-EDTA-Pyr treatment, pelleted by centrifugation, resuspended in 500 µL of cold PBS 1X and fixed by adding 4.5 mL of 4% paraformaldehyde in saline (sc-281,692, Santa Cruz Biotechnology, France) and incubating at room temperature for 5 minutes. Then, cells were washed 2 times with PBS1X, suspended in 500 µL PBS 1X and kept at 4°C in dark until analysis. The GFP and RFP cell fluorescence was measured using a Fortessa Flow-cytometer (BD Biosciences) with excitation/emission at 488/515–545 and 561/600–620 nm, respectively. For data analysis using FlowJo software (BD Biosciences), the RFP positive cell subpopulation was first selected to measure the GFP/RFP fluorescence ratio. The prior elimination of cell doublets did not have a significant impact on the results.
mRNA isolation and RT-qPCR analysis
Cultured cells or spheroids were washed twice with cold PBS, and processed for total RNA isolation using the RNeasy Mini Kit (Qiagen, France) or Trizol reagent (Invitrogen, ThermoFisher Scientific, France). Tumor fragments were minced into fine pieces and lysed by vigorous shaking with steel balls in Trizol reagent. RT-qPCR experiments were performed as previously published [Citation8,Citation10] using the LightCycler 480 SYBR Green I Master kit. Hprt was selected as the reference gene for normalization of data derived from independent cDNA synthesis reactions and normalization was further checked using others control gene such as Sdha or Rplp0. The expression level of each mRNA species was further normalized to that measured in the growing 2D-culture (KC-2D) set to 1. Oligonucleotide primers sequences along with a summary of data are shown in S1 file.
Western blot analysis
Cells were seeded at 4 × 10⁵ cells per 6 cm diameter dish (day 0), treated at day 1 as indicated and lysed at day 2 or 3. For cell lysis, cells were washed two times with cold PBS1X and lysed in Laemli 2X lysis buffer supplemented with phosphatase inhibitors. About 50 µg protein lysate were subjected to SDS-PAGE and transferred to a polyvinylidene fluoride membrane (Hybond P; RPN303F from Amersham Pharmacia Biotech, England) that was blocked with 5% nonfat milk, in PBS1X containing 0.1% Tween-20 and probed with primary antibodies in the same buffer overnight at 4°C. Proteins were detected using horseradish peroxidase-conjugated secondary antibodies and detected using ECL (RPN2106) or ECL-select (RPN2235) reagents (Amersham, GE Healthcare, UK) and a cooled digital camera (LC33000, FujiFilm). Relative protein levels in each lane was measured using the Multi Gauge software (Fuji Microsoft, FujiFilm) associated with the digital camera device.
Animal models
Six-week-old female NOD.CB-17-Prkdc scid/Rj (NOD-SCID) or C57Bl/6 J mice weighing 16–20 g were purchased from Janvier Laboratory (Le Genest Saint Isle, France). All mice were housed in ventilated cages with sterile food and water ad libitum throughout the study. The presence of subcutaneous tumors was carefully checked by palpation, light pinching and rolling of the skin between fingers to assess thickening of the skin and the presence of small hard lumps, which allowed to detect most of the tumors several days before they reach 1 mm3. Tumor size was measured two times a week with Vernier calipers. Tumor volumes were calculated using the following formula: (L * W2)/2, in which L represents the large diameter of the tumor, and W represents the small diameter. Mice were sacrificed when their tumor volume exceeded 1500 mm3 or when they showed signs of suffering.
Experimental procedures for NOD-SCID mice
KC-DT66066 cells in SSQ were generated in two steps. 4 × 10⁵ cells were seeded in 6 cm diameter dish and treated the next day with 200 nM Torin1 for 1 day. Cells were then subcultured at low cell density in growth medium with 1.9% FCS plus insulin 10 µg/mL (to enhance survival of cells in SSQ) for 3 days and then subjected to gemcitabine selection for 5 days in regular medium supplemented with gemcitabine at 30 ng/mL. Cells in SSQ were then harvested in DMEM with 10% fetal calf serum after 5 min treatment with Tryp-EDTA-Pyr solution warmed to 37°C, washed two times with cold DMEM without serum or antibiotics, resuspended in a small volume of DMEM and counted. Exponentially growing cells were harvested from 6 cm diameter dishes seeded with 4 × 10⁵ cells two days before and harvested in DMEM as cells in SSQ. Harvested cells were injected subcutaneously in the backs of mice. Gemcitabine at 50 mg/kg was injected intraperitoneally on day 4 and 11 for the Ssq/gem group, day 0 referring to the day of cell injection.
Experimental procedures for C57Bl/6 mice
Cells were seeded at 4 × 10⁵ per 10 cm diameter plate and then cultured for 4 or 5 days with a growth medium change on the third day. Cells were harvested by a 3 min treatment with Tryp-EDTA-Pyr, washed twice with growth medium without serum or antibiotics, filtered through a 70 µm cell strainer and 200 µl of a cell suspension at 5 × 10⁶ cells/mL subcutaneously injected (day 0) into the back of C57Bl/6 mice. Cyclosporin A (Sandoz, France) was administered orally at a dose of 80 mg/kg at days −2, 0, 4, 7 and 11.
Analysis of patients’ records
The anonymized records from 144 patients with pancreatic adenocarcinoma (PAAD) included in the TGCA-PAAD project and with a follow-up and a transcriptome profiling of their primary tumors by Illumina sequencing were downloaded from the Genomic Data Commons website as clinical files and FPKM transcriptome-sequencing files. For gene expression analysis, genes counts from the FPKM files were assembled into a count matrix Kij (for gene i in tumor sample j) after filtering genes with zero geometric mean. Gene counts were normalized by calculating scaling factors analogous to those calculated in the DESeq package [Citation55,Citation56]: λj=MEDIANi = 1_to_17689{Kij/GEOMETRIC_MEANk = 1_to_149{Kik}}. The normalized FPKM value Kij/λj was used as a measure of the expression level of gene i in tumor j. In the case of five patients for whom there were two sequencing files, we took the geometric mean value of normalized gene counts. This normalization introduced in most cases only a small correction (the average value of λj was λ = 1.01 ± 0.12, mean ± s.d.; n = 149) and was validated a posteriori by the strong self-consistency of the results obtained. The cutoff value θ used to categorize patients in cohorts with a low or high level of expression of a given gene in their tumor was chosen so as to maximize the statistical significance of the difference in survival between the two cohorts of patients. For BECN1 mRNA levels (8.56 ± 1.83 FPKM, mean ± s.d., range: 4.2–18.0, n = 124), a cutoff value of 8.895 FPKM was used throughout this study. For CCNA2 mRNA levels (4.76 ± 2.86 FPKM, mean ± s.d., range: 1.12–16.44, n = 124) a cutoff value of 5.66 FPKM was used throughout this study (see also S2 file).
The clinical data were verified by cross-referencing the various clinical files for the treatment status and for the duration of patient survival without local or distant tumor recurrence. Only the records of 124 of the 144 patients contained relevant indications on local recurrence and the status of distant metastasis. They include 109 patients with a pancreas adenocarcinoma of the ductal subtype, 6 with a Not Otherwise Stated subtype, 3 with a poorly differentiated and 1 with a well differentiated subtype, 3 with mixed phenotypes (ductal and micropapillary or neuroendocrine subtypes) and 2 with an invasive phenotype. The “Initial treatment” corresponded to removal of the primary tumor by partial or total pancreatectomy. Adjuvant chemotherapy was recorded for 78% of patients (the treatment status was not specified for the remaining patients) and this percentage increased to 89% for patients with distant metastasis-free survival >360 day. When a patient had a local recurrence or a new cancer type, he was censored at the time of that diagnostic in the Kaplan-Meier analysis for distant metastasis-free survival. Data were processed and analyzed using Excel (version 16; Microsoft, USA) upgraded with Real Statistics add-ins (Zaiontz, C., 2020, Real Statistics Using Excel.at www.real-statistics.com) and GraphPad Prism version 5.00 (San Diego, California, USA). Enrichment analysis was performed with Gene Set Enrichment Analysis software (GSEA v4.2.0 for Windows and Mac) with default settings and the msigdb.v7.4.symbols.gmt dataset available from the Broad Institute. Hierarchical gene clustering was performed using Morpheus software (https://software.broadinstitute.org/morpheus). The references of downloaded files and a synthetic summary of clinical data are given in S2 file. Normalized sequencing data are provided in S3 file.
Statistics
In all graphs, each point corresponds to an independent measurement, the labels above the data points indicate the average values and error bars are standard deviation unless otherwise indicated. Significance was measured using a two-tailed Student’s t-test unless otherwise specified. Log-ranked (Mantel-Cox) and Fisher’s exact probability test were performed using GraphPad Prism version 5.00 or 8.00 (San Diego, California, USA). Correlations were calculated using Excel software (Microsoft Standard Office 2016) and their statistical significance calculated on the Vassar web site (http://vassarstats.net). Multivariate Cox regression analysis was performed using Excel (version 16; Microsoft, USA) upgraded with Real Statistics add-ins (Zaiontz, C., 2020, Real Statistics Using Excel.at www.real-statistics.com). The number of * indicates the statistical significance of the difference between the indicated mean values with * for p < 0.05, ** for p < 10−2, *** for p < 10−3, **** for p < 10−4, ***** for p < 10−5 and ******* for p < 10−6 and the same for #.
Author contributions
Conceptualization: TT. Supervision: CN, FB, TT. Methodology: TT. Investigation: JG provided murine pancreas cancer cell lines derived from corresponding transgenic mice; MH carried out counting of colonies from clonogenic assays and plasmids constructions in studies with prostate cancer cells. TT performed all cell culture, flow cytometry, qPCR, Western Blot experiments and analysis of patients’ records; CN and MT carried out animal experiments. Formal analysis: TT; Analysis and Visualization of Data: FB, CN, TT. Writing original draft: TT. Review and Editing: CN, FB, FD, FLT, JG, LD and TT.
Declarations and ethics satements
Ethical approval: The animal protocol used in this study was reviewed and approved by the local ethics committee (Comité d’Ethique en Expérimentation Animale of University of Paris; approved protocol CEEA 18–088 submitted by C. Nicco and T. Tchenio). Animals received humane care in compliance with the guidelines implemented at our institution (INSERM and University Paris Descartes).
Supplemental Material
Download Zip (53.1 MB)Disclosure statement
The authors have declared that no conflict of interest exists.
Data Availability Statement
The authors declare that all data supporting the findings of this study are available within the article and its appendices, or available from the corresponding author upon reasonable request.
Supplementary material
Supplemental data for this article can be accessed online at https://doi.org/10.1080/15384101.2022.2123187.
Correction Statement
This article has been republished with minor changes. These changes do not impact the academic content of the article.
Additional information
Funding
Related Research Data
References
- Luzzi KJ, MacDonald IC, Schmidt EE, et al. Multistep nature of metastatic inefficiency: dormancy of solitary cells after successful extravasation and limited survival of early micrometastases. Am J Pathol. 1998;153:865–873.
- Cameron MD, Schmidt EE, Kerkvliet N, et al. Temporal progression of metastasis in lung: cell survival, dormancy, and location dependence of metastatic inefficiency. Cancer Res. 2000;60:2541–2546.
- Naumov GN, MacDonald IC, Weinmeister PM, et al. Persistence of solitary mammary carcinoma cells in a secondary site: a possible contributor to dormancy. Cancer Res. 2002;62:2162–2168.
- McAllister SS, Gifford AM, Greiner AL, et al. Systemic endocrine instigation of indolent tumor growth requires osteopontin. Cell. 2008;133:994–1005.
- Risson E, Nobre AR, Maguer-Satta V, et al. The current paradigm and challenges ahead for the dormancy of disseminated tumor cells. Nat Cancer. 2020;1:672–680.
- Shen S, Vagner S, Robert C. Persistent cancer cells: the deadly survivors. Cell. 2020;183:860–874.
- Janni W, Rack B, Schindlbeck C, et al. The persistence of isolated tumor cells in bone marrow from patients with breast carcinoma predicts an increased risk for recurrence. Cancer. 2005;103:884–891.
- Bui AT, Laurent F, Havard M, et al. SMAD signaling and redox imbalance cooperate to induce prostate cancer cell dormancy. Cell Cycle. 2015;14:1218–1231.
- Havard M, Dautry F, Tchenio T. A dormant state modulated by osmotic pressure controls clonogenicity of prostate cancer cells. J Biol Chem. 2011;286:44177–44186.
- Bui AT, Huang ME, Havard M, et al. Transient exposure to androgens induces a remarkable self-sustained quiescent state in dispersed prostate cancer cells. Cell Cycle. 2017;16:879–893.
- Baer R, Cintas C, Dufresne M, et al. Pancreatic cell plasticity and cancer initiation induced by oncogenic Kras is completely dependent on wild-type PI 3-kinase p110alpha. Genes Dev. 2014;28:2621–2635.
- Hingorani SR, Petricoin EF, Maitra A, et al. Preinvasive and invasive ductal pancreatic cancer and its early detection in the mouse. Cancer Cell. 2003;4:437–450.
- Maciel-Baron LA, Morales-Rosales SL, Aquino-Cruz AA, et al. Senescence associated secretory phenotype profile from primary lung mice fibroblasts depends on the senescence induction stimuli. Age (Dordr). 2016;38:26.
- Fung C, Lock R, Gao S, et al. Induction of autophagy during extracellular matrix detachment promotes cell survival. Mol Biol Cell. 2008;19:797–806.
- Kaizuka T, Morishita H, Hama Y, et al. An autophagic flux probe that releases an internal control. Mol Cell. 2016;64:835–849.
- Thoreen CC, Kang SA, Chang JW, et al. An ATP-competitive mammalian target of rapamycin inhibitor reveals rapamycin-resistant functions of mTORC1. J Biol Chem. 2009;284:8023–8032.
- Wirawan E, Lippens S, Vanden Berghe T, et al. Beclin1: a role in membrane dynamics and beyond. Autophagy. 2012;8:6–17.
- Hosokawa N, Hara T, Kaizuka T, et al. Nutrient-Dependent mTORC1 association with the ULK1-Atg13-FIP200 complex required for autophagy. Mol Biol Cell. 2009;20:1981–1991.
- Di Bartolomeo S, Corazzari M, Nazio F, et al. The dynamic interaction of AMBRA1 with the dynein motor complex regulates mammalian autophagy. J Cell Biol. 2010;191:155–168.
- Vadlakonda L, Dash A, Pasupuleti M, et al. The Paradox of Akt-mTOR interactions. Front Oncol. 2013;3:165.
- Mauvezin C, Neufeld TP. Bafilomycin A1 disrupts autophagic flux by inhibiting both V-ATPase-dependent acidification and Ca-P60A/SERCA-dependent autophagosome-lysosome fusion. Autophagy. 2015;11:1437–1438.
- Rocchi A, Yamamoto S, Ting T, et al. A Becn1 mutation mediates hyperactive autophagic sequestration of amyloid oligomers and improved cognition in Alzheimer’s disease. PLoS Genet. 2017;13:e1006962.
- Mitsui Y, Schneider EL. Increased nuclear sizes in senescent human diploid fibroblast cultures. Exp Cell Res. 1976;100:147–152.
- Nakajima T, Nakashima T, Okada Y, et al. Nuclear size measurement is a simple method for the assessment of hepatocellular aging in non-alcoholic fatty liver disease: comparison with telomere-specific quantitative FISH and p21 immunohistochemistry. Pathol Int. 2010;60:175–183.
- Hernandez-Segura A, Nehme J, Demaria M. Hallmarks of cellular senescence. Trends Cell Biol. 2018;28:436–453.
- Deshmukh SK, Tyagi N, Khan MA, et al. Gemcitabine treatment promotes immunosuppressive microenvironment in pancreatic tumors by supporting the infiltration, growth, and polarization of macrophages. Sci Rep. 2018;8:12000.
- Cianfanelli V, Fuoco C, Lorente M, et al. AMBRA1 links autophagy to cell proliferation and tumorigenesis by promoting c-Myc dephosphorylation and degradation. Nat Cell Biol. 2015;17:20–30.
- Maiani E, Milletti G, Nazio F, et al. AMBRA1 regulates cyclin D to guard S-phase entry and genomic integrity. Nature. 2021;592:799–803.
- Simoneschi D, Rona G, Zhou N, et al. CRL4(AMBRA1) is a master regulator of D-type cyclins. Nature. 2021;592:789–793.
- Thoresen SB, Pedersen NM, Liestol K, et al. A phosphatidylinositol 3-kinase class III sub-complex containing VPS15, VPS34, Beclin 1, UVRAG and BIF-1 regulates cytokinesis and degradative endocytic traffic. Exp Cell Res. 2010;316:3368–3378.
- Rohatgi RA, Janusis J, Leonard D, et al. Beclin 1 regulates growth factor receptor signaling in breast cancer. Oncogene. 2015;34:5352–5362.
- Matthew-Onabanjo AN, Janusis J, Mercado-Matos J, et al. Beclin 1 promotes endosome recruitment of hepatocyte growth factor tyrosine kinase substrate to suppress tumor proliferation. Cancer Res. 2020;80:249–262.
- Song X, Zhu S, Chen P, et al. AMPK-Mediated BECN1 phosphorylation promotes ferroptosis by directly blocking system Xc(-) activity. Curr Biol. 2018;28:2388–99 e5.
- Hu F, Li G, Huang C, et al. The autophagy-independent role of BECN1 in colorectal cancer metastasis through regulating STAT3 signaling pathway activation. Cell Death Amp Dis. 2020;11:304.
- Reiling JH, Sabatini DM. Stress and mTorture signaling. Oncogene. 2006;25:6373–6383.
- Galvez T, Teruel MN, Heo WD, et al. siRNA screen of the human signaling proteome identifies the PtdIns(3,4,5)p3-mTOR signaling pathway as a primary regulator of transferrin uptake. Genome Biol. 2007;8:R142.
- Ohyashiki JH, Kobayashi C, Hamamura R, et al. The oral iron chelator deferasirox represses signaling through the mTOR in myeloid leukemia cells by enhancing expression of REDD1. Cancer Sci. 2009;100:970–977.
- Alexander A, Cai SL, Kim J, et al. ATM signals to TSC2 in the cytoplasm to regulate mTORC1 in response to ROS. Proc Natl Acad Sci U S A. 2010;107:4153–4158.
- Bayeva M, Khechaduri A, Puig S, et al. mTOR regulates cellular iron homeostasis through tristetraprolin. Cell Metab. 2012;16:645–657.
- Watson A, Lipina C, McArdle HJ, et al. Iron depletion suppresses mTORC1-directed signalling in intestinal Caco-2 cells via induction of REDD1. Cell Signal. 2016;28:412–424.
- Pant K, Saraya A, Venugopal SK. Oxidative stress plays a key role in butyrate-mediated autophagy via Akt/mTOR pathway in hepatoma cells. Chem Biol Interact. 2017;273:99–106.
- Oka SI, Hirata T, Suzuki W, et al. Thioredoxin-1 maintains mechanistic target of rapamycin (mTOR) function during oxidative stress in cardiomyocytes. J Biol Chem. 2017;292:18988–19000.
- Romero AM, Ramos-Alonso L, Montella-Manuel S, et al. A genome-wide transcriptional study reveals that iron deficiency inhibits the yeast TORC1 pathway. Biochim Biophys Acta, Gene Regul Mech. 2019;1862:194414.
- Daher B, Parks SK, Durivault J, et al. Genetic Ablation of the cystine transporter xCT in PDAC cells inhibits mTORC1, growth, survival, and tumor formation via nutrient and oxidative stresses. Cancer Res. 2019;79:3877–3890.
- Zhou J, Li XY, Liu YJ, et al. Full-Coverage regulations of autophagy by ROS: from induction to maturation. Autophagy. 2021;18:1–16.
- Almog N. Molecular mechanisms underlying tumor dormancy. Cancer Lett. 2010;294:139–146.
- Cianfanelli V, D’Orazio M, Cecconi F. AMBRA1 and BECLIN 1 interplay in the crosstalk between autophagy and cell proliferation. Cell Cycle. 2015;14:959–963.
- Liang XH, Jackson S, Seaman M, et al. Induction of autophagy and inhibition of tumorigenesis by beclin 1. Nature. 1999;402:672–676.
- Wechman SL, Pradhan AK, DeSalle R, et al. New Insights into Beclin-1: evolution and pan-malignancy inhibitor activity. Adv Cancer Res. 2018;137:77–114.
- Kim HS, Lee SH, Do SI, et al. Clinicopathologic correlation of beclin-1 expression in pancreatic ductal adenocarcinoma. Pathol Res Pract. 2011;207:247–252.
- Song S, Wang B, Gu S, et al. Expression of Beclin 1 and Bcl-2 in pancreatic neoplasms and its effect on pancreatic ductal adenocarcinoma prognosis. Oncol Lett. 2017;14:7849–7861.
- Takahashi Y, Coppola D, Matsushita N, et al. Bif-1 interacts with Beclin 1 through UVRAG and regulates autophagy and tumorigenesis. Nat Cell Biol. 2007;9:1142–1151.
- Vera-Ramirez L, Vodnala SK, Nini R, et al. Autophagy promotes the survival of dormant breast cancer cells and metastatic tumour recurrence. Nat Commun. 2018;9:1944.
- Sancak Y, Peterson TR, Shaul YD, et al. The Rag GTPases bind raptor and mediate amino acid signaling to mTORC1. Science. 2008;320:1496–1501.
- Anders S, Huber W. Differential expression analysis for sequence count data. Nat Precedings. 2010;11:R106.
- Dillies MA, Rau A, Aubert J, et al. A comprehensive evaluation of normalization methods for Illumina high-throughput RNA sequencing data analysis. Brief Bioinform. 2013;14:671–683.
- Liberzon A, Birger C, Thorvaldsdottir H, et al. The molecular signatures database (MSigDB) hallmark gene set collection. Cell Syst. 2015;1:417–425.