
ABSTRACT
Rab-interacting lysosomal protein – like 2 (RILPL2) has been reported to be associated with prognosis and tumor biological functions in breast cancer and endometrial carcinoma. However, its expression and functional role in non-small cell lung cancer (NSCLC) remain unclear. The expression and clinical data of lung adenocarcinoma (LUAD) and lung squamous carcinoma (LUSC) were downloaded from the TCGA database. The expression of RILPL2 in NSCLC cell lines was verified by the Western blot. We used online databases and bioinformatics analysis tools to explore its prognostic value, potential biological functions, and correlations with tumor immune microenvironment.The expression of RILPL2 was significantly lower in NSCLC compared with adjacent normal tissues. Low RILPL2 expression was associated with worse overall survival (OS) in NSCLC. The GO analysis showed RILPL2 was comprehensively involved in immune activity. RILPL2 expression was significantly positively correlated with the infiltration levels of B cells, CD8+T cells, CD4+T cells, macrophages, neutrophils, dendritic cells (P < 0.001), and it was also significantly positively correlated with programmed cell death ligand 1 (PD-L1/CD274) (P < 0.001). High RILPL2 expression could predict better immunotherapy response and prognosis in the immunotherapy cohort. The GSEA analysis showed low RILPL2 expression was associated with glycolysis process in LUAD, which was verified in vitro.These results showed RILPL2 expression was correlated with prognosis, tumor microenvironment, and immunotherapy response in NSCLC. Besides, RILPL2 may regulate glycolysis in LUAD.
Introduction
Non-small cell lung cancer (NSCLC) is one of the most common malignant tumors in the world. Most patients are diagnosed at an advanced stage, with an approximate 5-year survival rate of 16.6% [Citation1]. Although current treatment alternatives for NSCLC patients include surgery, chemotherapy, targeted therapy, and immunotherapy, the overall survival (OS) rate of NSCLC patients is far from satisfactory [Citation2].
The development of cancer is not only determined by the intrinsic factors of cancer cells but also by the composition of tumor microenvironment. Immune-related mechanisms play an important role in the development of cancer, especially the level of immune cell infiltration [Citation3]. Programmed death ligand 1 (PD-L1/CD274), a major immune checkpoint, is often expressed in several types of malignant tumors and related to survival and tumor progression [Citation4]. Immunotherapy, represented by blockade of PD-1/PD-L1 pathway, has shown good antitumor effects and becomes the first-line therapy for lung cancer [Citation5]. However, current immunotherapy only works in a subset of patients [Citation6]. Therefore, the identification of novel and effective therapeutic targets is still necessary.
Rab-interacting lysosomal protein – like 2 (RILPL2), one of the RILP family (RILP, RILPL1, RILPL2), encodes a rab-interacting lysosomal protein-like domain, which may be involved in vesicular transport, cellular protein transport and regulation of lysosome morphology [Citation7]. RILPL2 is widely expressed in different tissues, including brain, kidney, liver, lung, prostate, skin, etc. RILPL2 was responsible for transporting and releasing melanin vesicles, thereby protecting against UV damage. RILPL2 was associated with viral replication and could be a potential target for HCV treatment [Citation8]. In addition, recent studies reported that RILPL2 played a role in tumor biological functions in breast cancer and endometrial carcinoma. For example, RILPL2 was found involved in proliferation, metastasis, and chemoresistance in breast cancer [Citation9]. RILPL2 was a prognostic marker and correlated with immune cell infiltration in endometrial carcinoma [Citation10]. However, the role of RILPL2 in NSCLC has not been studied before. In our study, we first investigated the expression level of RILPL2 and its potential biological functions in NSCLC based on bioinformatic analysis, then we conducted some experiments to verify the corresponding results.
Materials and methods
Analysis of RILPL2 expression level
The expression difference of RILPL2 in various types of tumors was obtained from the TIMER database (https://cistrome.shinyapps.io/timer/). The DESeq2 package 4.0 was used to detect the differentially expression genes (DEGs) in the TCGA cohorts, and the filter criteria was set to |log2FC| ≥ 1, FDR <0.05. The expression of RILPL2 in NSCLC was verified by the GEPIA database (http://gepia.cancer-pku.cn/), Cancer Cell Line Encyclopedia (CCLE, https://sites.broadinstitute.org/ccle), and Western blot.
Analysis of RILPL2 expression with various clinicopathologic features
The RNA-seq data of 516 lung adenocarcinoma (LUAD) patients and 501 lung squamous carcinoma (LUSC) patients and the corresponding clinical data were downloaded from the TCGA database (https://portal.gdc.cancer.gov/). The gene expression profile was measured experimentally using the Illumina HiSeq 2000 RNA Sequencing platform by the University of North Carolina TCGA genome characterization center. Then, we eliminated the cases with missing or defective information. Finally, the clinical information of 337 LUAD patients and 398 LUSC patients were reserved for the following analysis.
Survival analysis
The Kaplan – Meier Plotter database (www.kmplot.com/lung) and PrognoScan (http://dna00.bio.kyutech.ac.jp/PrognoScan/index.html) were used to analyze the prognostic value of RILPL2. All samples were divided into high- and low- RILPL2 cohorts according to the best cutoff. Receiver operating characteristic (ROC) curves were used to evaluate the ability of RILPL2 expression of the TCGA cohorts to predict prognosis.
Gene ontology analysis
The potential RILPL2-related gene sets were downloaded from the UALCAN database (http://ualcan.path.uab.edu/index.html). The gene ontology analysis of RILPL2 was conducted by the Metascape tool (https://metascape.org/gp/index.html#/main/step1).
Analysis of RILPL2 expression with tumor immune microenvironment
The role of RILPL2 in the tumor immune microenvironment was explored based on the TCGA tumor samples. The data were divided into low and high RILPL2 expression groups according to the median expression value of RILPL2. The ESTIMATE database (https://bioinformatics.mdanderson.org/estimate/index.html) was used to evaluate the correlation between RILPL2 expression and immune score, stromal score. The correlation between RILPL2 expression and immune cell infiltration was explored by the R package (Xcell algorithm, 2020 version 4.0.3) and TIMER database. The correlation between RILPL2 expression and related gene markers of immune cells was obtained from the TIMER database. The correlations between RILPL2 expression and immune checkpoints, tumor mutational burden (TMB), microsatellite instability (MSI) were implemented by the R package ggstatsplot (2020 version 4.0.3). The Tumor Immune Dysfunction and Exclusion (TIDE) analysis tool (http://tide.dfci.harvard.edu/) and GEO dataset (GSE126044, GSE166449, GSE111414) were used to explore the correlation between RILPL2 expression and immunotherapy response.
Gene set enrichment analysis
The RNA-seq data of 516 LUAD and 501 LUSC patients were downloaded from the TCGA database. The data were divided into low and high RILPL2 expression groups according to the median expression value of RILPL2. We employed the Gene Set Enrichment Analysis (GSEA 4.2.1) method to figure out the potential pathways in the low or high RILPL2 expression group. The HALLMARK gene sets (h.all.v7.5.1.symbols) from the MSigDB were used to make analysis. For each analysis, the number of gene set permutations was set to 1000. The normalized enrichment score (NES) >1 or < −1, false discovery rate (FDR) q value <0.05 were considered to be significantly enriched in each phenotype.
Cell culture
Human NSCLC cell lines (A549, PC-9, NCI-H1975, NCI-H3122, NCI-H358, NCI-H2228) and human bronchial epithelial cell BEAS-2B were purchased from the American Type Culture Collection (ATCC). All cells were cultured in RPMI-1640 supplemented with 10% FBS and incubated in an atmosphere containing 5% CO2 at 37°C.
Quantitative real-time RT-PCR
Quantitative RT-PCR was performed as previously described [Citation11]. Primers were designed as follows: beta-actin forward, 5′-TTGCTGATCCACATCTGCT-3′; reverse, 5′-GACAGGATGCAGAAGGAGAT-3′; HK2 forward, 5’-CTGGACCCGACTCAG GAGGACT-3’; reverse, 5’-CCTCGCCTTTGTTCTCCTTGAT-3’; LDHA forward, 5′-AAGCGGTTGCAATCTGGATTCAG-3′; reverse, 5′-GGTGAACTCCCAGCCTT
TCC-3′; PKM2 forward, 5’-GAGGCCTCCTCCAAGTGCT-3’; reverse, 5’-CCA GACTTGGTGAGGACGAT-3’.
Western blot analysis
In brief, equal amounts of protein were separated by SDS-PAGE, followed by electrophoretically transferred to NC membrane. The membranes were blocked with 5% BSA and then incubated overnight at 4°C with the following primary antibodies: β-actin (1:10000, Abcam), RILPL2 (1:1000, Thermo Fisher Scientific), LDHA, PKM2, HK2 (1:2000, Cell Signaling Technology), PTEN, AKT (1:1000, Cell Signaling Technology), p-AKT (Ser473) (1:2000, Cell Signaling Technology). After washing, the membranes were incubated with the corresponding secondary antibody for 1.5 h at room temperature. Beta-actin was used as the protein loading control. All experiments were performed at least three independent times.
Cell infection
For stable RILPL2 overexpression, cells were cultured in 6-well plates (2.0 × 10⁵ cells) with antibiotic-free medium for 24 h; then, they were infected with lentiviral pCMV-RILPL2-PGK-PuroR or the corresponding control lentivirus (OBiO Biotechnology, Shanghai, China) at the multiplicity of infection (MOI) of 20 pfu/cell. The selection of transfected cells was performed 48 h later with 1 μg/mL puromycin (Invitrogen), and the infection efficiency was determined by western blot.
Lactate production and glucose uptake
The A549 and H358 cells (1.0 × 10⁶ cells) were cultured in 6-well plates. After 24 h starvation, the supernatants of these cells were collected for experiment. The glucose and lactate level were quantified by the Glucose Assay Kit and Lactate Assay Kit (Nanjing Jiancheng Bioengineering Institute, China) following the manufacturer’s protocols.
Construction of risk score model
The RNA-seq and corresponding clinical data of LUAD were downloaded from the TCGA database to construct the risk score model by the LASSO regression algorithm and R package glmnet (2020 version 4.0.3). The risk score was defined as the expression multiplied by the coefficient. The risk scores were divided into low-and high-risk groups according to the median value. ROC curves and Kaplan-Meier curves were used to evaluate the predictive ability of the risk score model.
Statistical analysis
We used GraphPad Prism 7 and SPSS 22.0 software to make statistical analysis. The experiment results are presented as the mean ± standard deviation (SD). Differences between groups were evaluated by two-tailed Student’s t-tests, Wilcox tests or one-way ANOVA tests. Survival data were analyzed by Kaplan-Meier method and Log-rank test. A multivariate Cox regression model was used to identify independent predictors. Correlational analyses were analyzed by Chi-squared tests, Fisher’s exact tests or Spearman correlation. P-value <0.05 was considered statistically significant.
Results
RILPL2 expression in NSCLC and its correlation with clinicopathologic features
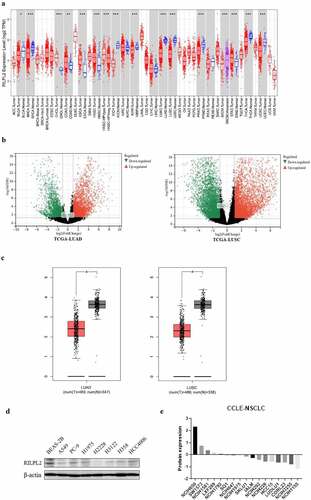
To explore the expression of RILPL2 in Pan-cancer, especially NSCLC, the TIMER and GEPIA databases were searched. Besides, the TCGA cohorts were used to detect DEGs between tumor and normal tissues. As shown in , RILPL2 expression was significantly higher in cholangiocarcinoma (CHOL), colon adenocarcinoma (COAD), esophageal carcinoma (ESCA), head and neck squamous cancer (HNSC), pheochromocytoma and paraganglioma (PCPG), stomach adenocarcinoma (STAD) compared with adjacent normal tissues (P < 0.05). However, RILPL2 expression was significantly lower in bladder urothelial carcinoma (BLCA), breast cancer (BRCA), cervical and endocervical cancer (CESC), kidney chromophobe (KICH), kidney renal papillary cell carcinoma (KIRP), lung adenocarcinoma (LUAD), lung squamous cell carcinoma (LUSC), prostate adenocarcinoma (PRAD), thyroid carcinoma (THCA), uterine corpus endometrial carcinoma (UCEC) compared with adjacent normal tissues (P < 0.05). The volcano plots showed that RILPL2 expression was downregulated in tumor tissues compared with normal tissues in NSCLC (). The transcription level and protein level of RILPL2 were lower compared with normal tissues in NSCLC (). The majority of NSCLC cell lines from the CCLE database also showed low RILPL2 expression ().
Figure 1. RILPL2 expression level in NSCLC. (A) RILPL2 expression in different tumors based on the TIMER database (Wilcox test). Red color: tumor tissue. Blue color: normal tissue. (B) Volcano plots of DEGs (include RILPL2) in tumor tissues compared with normal tissues in the TCGA cohorts (|log2fc| ≥ 1, FDR <0.05). (C) RILPL2 expression in NSCLC based on the GEPIA database (One-way ANOVA test). Red color: tumor tissue. Black color: normal tissue. (D) Western blot of RILPL2 expression. (E) Protein expression of RILPL2 in NSCLC cell lines from the CCLE database. non-small cell lung cancer; DEGs, differentially expressed genes. *p < 0.05, **p < 0.01, ***p < 0.001.
To explore the role of RILPL2 in NSCLC preliminarily, the correlation analysis was made between RILPL2 expression and the corresponding clinicopathologic features. ln the TCGA-LUAD cohort, RILPL2 expression was significantly related to gender (P = 0.014), clinical stage (P = 0.001), T stage (P = 0.001), N stage (P = 0.015) and M stage (P = 0.018). The low expression rates of RILPL2 in male (56.8%), stage IIb-IV (61.4%), T2–4 (55.9%), N1–3 (58.7%), M1 (68.2%) LUAD were higher than those of in female (43.5%), stage I-IIa (42.9%), T1 (36.4%), N0 (45.0%), M0 (48.9%) LUAD. ln the TCGA-LUSC cohort, RILPL2 expression was significantly related to clinical stage (P = 0.040). The low expression rate of RILPL2 in stage IIb-IV LUSC (55.8%) was higher than that of in stage I-IIa (46.3%) LUSC (). The results might be explained by the different genetic landscape and biological characteristics between LUAD and LUSC, which indicated the special role of RILPL2 in LUAD.
Table 1. The correlation between RILPL2 expression and clinicopathologic features in the TCGA-LUAD cohort.
Table 2. The correlation between RILPL2 expression and clinicopathologic features in the TCGA-LUSC cohort.
Prognostic value of RILPL2 expression in NSCLC
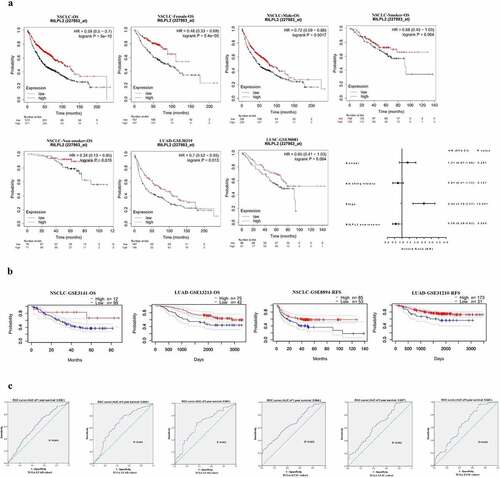
To explore the prognostic value of RILPL2 expression in NSCLC, the Kaplan – Meier Plotter database and PrognoScan database were used. As shown in , low RILPL2 expression was associated with worse overall survival (OS) in NSCLC, regardless of gender and smoking status. Multivariate Cox regression analysis showed that RILPL2 was an independent prognostic factor (). Similarly, in addition to OS, low RILPL2 expression was also associated with worse relapse free survival (RFS) in NSCLC (). ROC curves showed that RILPL2 expression had a stable area under curve (AUC) value for predicting 1/3/5-year survival in LUAD and LUSC ().
Figure 2. Prognostic value of RILPL2 expression in NSCLC. (A-B) Association between RILPL2 expression and prognosis based on the Kaplan – Meier Plotter database and PrognoScan database (Log rank test, Multivariate Cox regression analysis). (C) the ROC curves of RILPL2 expression for predicting the 1,3,5-year OS in LUAD and LUSC. OS, overall survival; NSCLC, non-small cell lung cancer; LUAD, lung adenocarcinoma; LUSC, lung squamous cell carcinoma.
Gene ontology (GO) analysis of RILPL2
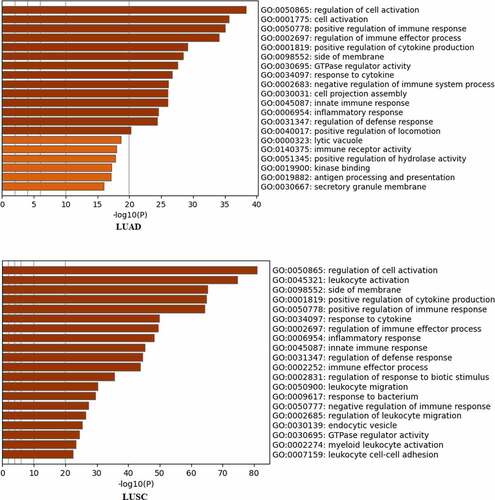
To explore the potential biological functions of RILPL2 in NSCLC, the Metascape tool was utilized for GO enrichment analysis. The GO analysis indicated that RILPL2 and RILPL2-related genes were remarkably enriched in immune activity in LUAD, such as “positive regulation of immune response”, “regulation of immune effector process”, “positive regulation of cytokine production”, “response to cytokine”, “negative regulation of immune system process”, “innate immune response”, “immune receptor activity”, “antigen processing and presentation”. The similar enriched items were observed in LUSC ().
Figure 3. The Gene Ontology analysis of RILPL2.
Correlation between RILPL2 expression and tumor immune microenvironment
Tumor-infiltrating lymphocytes are an important marker of immune surveillance and also an independent predictor of prognosis in cancers [Citation12]. Therefore, we used the xCell algorithm and TIMER database to explore the relationship between RILPL2 expression and immune cell infiltration. As shown in , the immune score and stromal score were higher in the high RILPL2 expression group than those of low RILPL2 expression group. RILPL2 expression was significantly correlated with the majority of immune cells (), and RILPL2 expression was positively correlated with the infiltration levels of B cells (R = 0.316, P = 1.04e-12), CD8+T cells (R = 0.2, P = 8.32e-06), CD4+T cells (R = 0.384, P = 1.90e-18), macrophages (R = 0.301, P = 1.37e-11), neutrophils (R = 0.402, P = 2.88e-18), dendritic cells (R = 0.36, P = 5.96e-16) in LUAD (). Similarly, RILPL2 expression was also positively correlated with the infiltration levels of B cells (R = 0.316, P = 1.04e-12), CD8+T cells (R = 0.2, P = 8.32e-06), CD4+T cells (R = 0.384, P = 1.90e-18), macrophages (R = 0.301, P = 1.37e-11), neutrophils (R = 0.402, P = 2.10e-20), dendritic cells (R = 0.43, P = 2.15e-23) in LUSC ().
Figure 4. Correlation between RILPL2 expression and tumor immune microenvironment. (A) Correlation between RILPL2 expression and immune score, stromal score (T test). (B) Correlation between RILPL2 expression and immune cell infiltration based on the xCell algorithm (Wilcox test). (C) Correlation between RILPL2 expression and immune cell infiltration based on the TIMER database (Spearman correlation). (D) Correlation between RILPL2 expression and immune checkpoints (Wilcox test). (E) Correlation between RILPL2 expression and TMB score, MSI score (Spearman correlation). (F) Correlation between RILPL2 expression and prediction of immunotherapy response based on the TIDE analysis tool (T test). (G) the comparison of immunotherapy response and survival according to RILPL2 expression (Pearson chi-squared test, Log rank test). TMB, tumor mutational burden; MSI, microsatellite instability. *p < 0.05, **p < 0.01, ***p < 0.001.
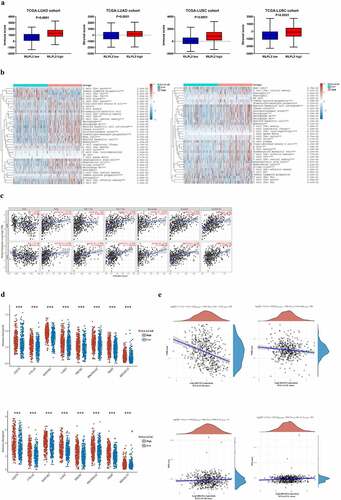
Figure 4. (Continued).
Then, we explored the relationship between RILPL2 expression and immune checkpoints, TMB, MSI. RILPL2 expression was significantly positively correlated with programmed cell death ligand 1 (PD-L1/CD274), cytotoxic T lymphocyte antigen 4 (CTLA4), lymphocyte activating gene 3 (LAG3), etc. (). Besides, RILPL2 expression was also significantly correlated with most gene markers of immune cells (). RILPL2 expression was negatively correlated with TMB score, however, no significant relationship was found between RILPL2 expression and MSI score ().
Table 3. Correlation analysis between RILPL2 expression and related gene markers of immune cells.
Furthermore, we investigated whether RILPL2 expression could affect immunotherapy response. Upregulated RILPL2 expression could predict better immunotherapy response in the TCGA cohorts ().
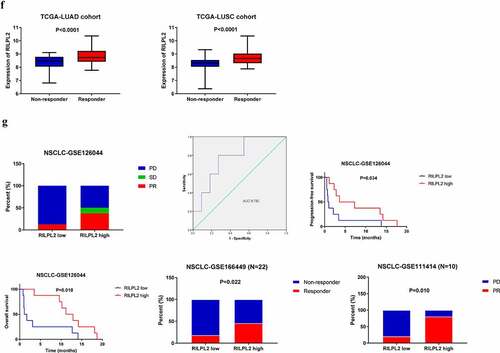
To verify the predictive role of RILPL2 as an immunotherapy biomarker, we collected the data of 16 NSCLC patients treated with Nivolumab from the dataset GSE126044 (). This cohort included 7 adenocarcinomas and 9 squamous cell carcinomas. Efficacy was defined as the best overall response to treatment according to the Response Evaluation Criteria In Solid Tumors (RECIST) 1.1. Progression-free survival (PFS) was measured from the first day of Nivolumab to tumor progression or death, whereas overall survival (OS) was measured from the date of Nivolumab until the date of death. As shown in , a higher objective response rate (ORR) and lower progressive disease (PD) rate was found in the high RILPL2 expression group than those of low RILPL2 expression group (PR: 37.5% vs 12.5%; SD: 12.5% vs 0%; PD: 50% vs 87.5%). The ROC curve also revealed that RILPL2 was a good marker to predict immunotherapy response (AUC = 0.782). Similarly, high RILPL2 expression was associated with better PFS and OS in the immunotherapy cohort. Besides, we also collected the data of NSCLC patients treated with Pembrolizumab from the dataset GSE166449 (N = 22) and GSE111414 (N = 10). The response rates of high RILPL2 expression group were significantly higher than those of low RILPL2 expression group in the dataset GSE166449 (P = 0.022) and GSE111414 (P = 0.010).
Table 4. Clinical characteristics of GSE126044.
Taken together, these results indicated that RILPL2 played an important role in the tumor immune microenvironment.
Gene set enrichment analysis (GSEA) analysis of RILPL2
The GSEA was conducted to detect the differentially activated pathways according to RILPL2 expression. The significantly upregulated terms enriched in the low RILPL2 expression group were “G2 M checkpoint”, “E2F targets”, “MYC targets”, “mitotic spindle”, “MTORC1 signaling”, “unfolded protein response”, “glycolysis” ( and ). The significantly upregulated terms enriched in the high RILPL2 expression group were “inflammatory response”, “IL-6/JAK/STAT3 signaling”, “interferon-gamma response”, “interferon- alpha response”, “complement”, “TNF-α signaling via NF-kB”, “KRAS signaling”, “bile acid metabolism”, “IL-2/STAT5 signaling” ().
Figure 5. Signaling pathways enriched in the low RILPL2 expression group in LUAD. LUAD, lung adenocarcinoma.
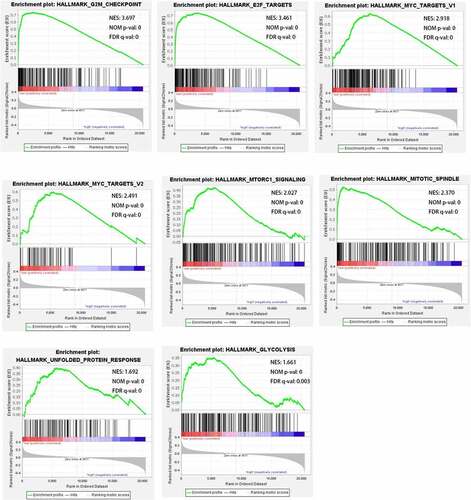
Table 5. Signaling pathways significantly correlated with RILPL2 expression in LUAD based on the GSEA analysis.
Correlation between RILPL2 and glycolysis
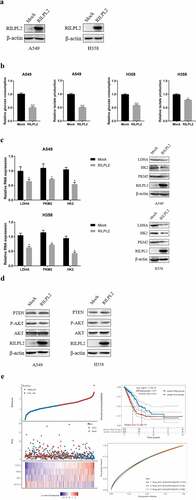
To examine the potential role of RILPL2 in glycolysis, glucose consumption and lactate production were detected in Mock and RILPL2-overexpression cells. The results showed that overexpression of RILPL2 inhibited glucose consumption and lactate production, while low RILPL2 expression had the opposite effects (). Additionally, overexpression of RILPL2 reduced the mRNA and protein levels of key genes in glycolysis, such as LDHA, HK2, PKM2 (). The PTEN/AKT pathway is known to play a critical role in glycolysis [Citation13]. The overexpression of RILPL2 enhanced the expression of PTEN and reduced the phosphorylation level of AKT (). Then, RILPL2 and key glycolysis-related genes (PKM2, HK2, LDHA) were used to construct the risk score model. The risk score = (−0.1282) *RILPL2+(0.0554) *HK2+(0.2138) *PKM2+(0.4145) *LDHA. The ROC curves and Kaplan-Meier curves showed an ability of predicting OS ().
Figure 6. Correlation between RILPL2 expression and glycolysis in LUAD. (A) RILPL2 protein level in mock and RILPL2-overexpressing cells after transfection. (B) the relative glucose consumption and lactate production in mock and RILPL2-overexpressing cells (T test). (C) the mRNA and protein levels of LDHA, HK2, PKM2 in mock and RILPL2-overexpressing cells. (D) the protein levels of PTEN, p-AKT (Ser473), AKT in mock and RILPL2-overexpressing cells. (E) Risk score model based on RILPL2 and glycolysis-related genes. *p < 0.05, **p < 0.01, ***p < 0.001.
Discussion
A previous study reported that RILPL2 expression was downregulated in breast cancer and correlated with poor prognosis, besides, RILPL2 regulated breast cancer cell proliferation and migration in vitro and in vivo [Citation9]. Another study indicated that low RILPL2 expression predicted poor prognosis in endometrial carcinoma, and RILPL2 played a critical role in regulating immune cell infiltration [Citation10]. Thus, it is worth exploring its role in NSCLC. As a result, we have found that RILPL2 is downregulated in NSCLC and related to prognosis and tumor immune microenvironment.
Tumor microenvironment refers to the microenvironment surrounding tumor cells, including blood vessels, immune cells, fibroblasts, bone marrow-derived inflammatory cells, various signaling molecules and extracellular matrix. The immune cells and their regulation play an important and complex role in the development and progression of cancer [Citation14]. The patients with high level of tumor infiltrating lymphocytes (TILs) may be more sensitive to checkpoint blockade inhibitors [Citation15]. The level of TILs is regarded as a predictor of survival across a range of cancer types [Citation16–18]. Our results showed that RILPL2 expression was positively correlated with the majority of immune cells, including B cells, CD8+T cells, CD4+T cells, which partly explained the prognostic value of RILPL2. Checkpoint PD-L1 as the critical signaling molecule has been used as a predictive biomarker for response to anti – PD-L1/PD-1 immunotherapy [Citation19]. It is generally recognized that higher PD-L1 expression predicts greater likelihood of response to immunotherapy [Citation19]. We found that RILPL2 was positively correlated with PD-L1, besides, the predictive value of RILPL2 was verified in the immunotherapy cohort with a small sample size. Combined with the GO analysis results, we concluded that RILPL2 was closely related to immune activity in NSCLC. Therefore, the mechanisms by which RILPL2 functions in the tumor immune microenvironment in NSCLC deserve further study.
To further investigate the molecular functions of RILPL2 in NSCLC, we conducted GSEA. The results revealed that low RILPL2 expression was significantly linked with “G2 M checkpoint”, “E2F targets”, “MYC targets”, “mitotic spindle”, “MTORC1 signaling”, “unfolded protein response”, “glycolysis”. “G2 M checkpoint”, “E2F targets”, “mitotic spindle” are the critical phases or components of cell cycle network [Citation20]. MYC amplification or overexpression has been reported in ~30–75% of NSCLC cases. MYC generally cooperates with other oncogenes to regulate metabolism pathways in tumor development [Citation21]. Unfolded protein response (UPR) is the process of clearing misfolded proteins in the endoplasmic reticulum under hypoxic and nutrient deprived circumstance. UPR contributes to angiogenesis through promoting the expression of pro-angiogenic factors under hypoxic stress; UPR supports metastasis through increasing epithelial to mesenchymal transition (EMT) transcription factor expression and reducing cell – cell junction markers [Citation22]. In addition, some studies suggest that UPR may mediate chemoresistance and the suppression of anti-tumor immune response [Citation23]. The mTORC1 signaling, as a main branch of mTOR signaling, is commonly activated in tumors. The mTORC1 signaling regulates mRNA translation and protein turnover. Besides, it is a master regulator of cellular metabolism, including nucleotide synthesis, lipid synthesis and glycolysis [Citation24]. Thus, it can be inferred that low RILPL2 expression may have an influence on cell proliferation or tumor development.
On the other side, high RILPL2 expression was significantly linked with “inflammatory response”,“IL-6/JAK/STAT3 signaling”,“interferon-gamma response”, “interferon- alpha response”, “complement”, “TNF-α signaling via NF-kB”, “KRAS signaling”, “bile acid metabolism”, “IL-2/STAT5 signaling”. Interleukin-6 (IL-6) is a multifunctional cytokine produced by various cell types, including tumor cells. IL-6/JAK/STAT3 signaling is involved in cell apoptosis, proliferation and survival [Citation25]. Interferon-alpha, interferon-gamma and complement are important immune molecules involved in immune response, immune regulation and inflammatory response. Activation of TNF-α/NF-kB signaling generally induces cytokines genes transcription [Citation26]. These information may provide us clues to further investigate the specific role of RILPL2 in the tumor immune microenvironment of NSCLC.
As we all know, one of the hallmarks of cancer is dysregulation of cellular energy metabolism [Citation27]. The previous studies have shown that glycolysis is quite active and efficient in malignant tumors even if oxygen supply is adequate [Citation28]. Glycolysis can supply more energy to tumor cells and then promote cell proliferation. The lactic acid generated in the process of glycolysis is transferred to the extracellular space to create an acidic microenvironment, which protects tumor cells from being killed by the host immune system or chemotherapy drugs [Citation28]. In our study, we found RILPL2 regulated glycolysis-related glucose uptake and lactate production in LUAD, which was consistent with the GSEA result. The expression of PKM2, HK2, LDHA were found negatively correlated with RILPL2. In addition, the risk score model constructed by RILPL2 and key glycolysis-related genes (PKM2, HK2, LDHA) showed an ability of predicting prognosis. The first step of glycolysis is activation of glucose by HK2. PKM2 is involved in producing pyruvate. LDHA catalyzes the interconversion of pyruvate and lactate. These three steps are important and rate-limiting in the process of glycolysis, which further affect tumor progression [Citation28]. To reveal the possible mechanism by which RILPL2 affects glycolysis in LUAD cells, we explored the changes in the PTEN/AKT pathway. We found that the overexpression of RILPL2 enhanced the expression of PTEN and reduced the phosphorylation level of AKT. PTEN is a protein tyrosine phosphatase and an important tumor suppressor, which negatively regulates the AKT/mTOR signaling pathway [Citation13]. AKT is closely related to glucose metabolism in cancer cells [Citation29]. Glycolysis plays an indispensable role in the development of cancers and demonstrates prognostic value. Thus, further research is needed to reveal the specific function of RILPL2 in glycolysis.
With regard to potential biological functions, our study has both similarities and differences compared with previous studies of RILPL2. Our GSEA result revealed that “G2 M checkpoint” was enriched in the LUAD patients with low RILPL2 expression. Similarly, KEGG pathway analysis of RILPL2 showed that “cell cycle” was the most significant pathway in endometrial carcinoma [Citation10]. Our study revealed that RILPL2 expression had remarkably positive correlations with primary immune cells in the tumor microenvironment, which is consistent with previous study [Citation10]. Besides, we also uncovered the relationship between RILPL2 and checkpoint PD-L1, glycolysis. This suggests that RILPL2 plays both common and different roles in different cancer types.
In conclusion, our study uncovered the potential biological role of RILPL2 in NSCLC. First, RILPL2 expression is downregulated in NSCLC. Second, RILPL2 expression is a prognostic factor for NSCLC patients. Third, RILPL2 expression is significantly correlated with immune cell infiltration, immune checkpoints and response to immunotherapy. Finally, RILPL2 may regulate glycolysis in LUAD. We will further explore the biological functions of RILPL2 in NSCLC.
Author contributions
Dongfang Chen and Hongyan Zhang contributed equally to this study. All authors read and approved the final manuscript.
Acknowledgments
We would like to thank all authors for their involvement in this study.
Disclosure statement
No potential conflict of interest was reported by the authors.
Data availability statement
The authors confirm that the data supporting the findings of this study are available within the article.
Additional information
Funding
References
- Alexander M, Kim SY, Cheng H. Update 2020: management of non-small cell lung cancer. Lung. 2020;198(6):897–907.
- Wang M, Herbst RS, Boshoff C. Toward personalized treatment approaches for non-small-cell lung cancer. Nat Med. 2021;27(8):1345–1356.
- Pitt JM, Marabelle A, Eggermont A, et al. Targeting the tumor microenvironment: removing obstruction to anticancer immune responses and immunotherapy. Ann Oncol. 2016;27(8):1482–1492.
- Chen J, Alduais Y, Chen B. Therapeutic and systemic adverse events of immune checkpoint inhibitors targeting the PD-1/PD-L1 axis for clinical management of NSCLC. Cell Transplant. 2021;30:9636897211041587.
- Barbee MS, Ogunniyi A, Horvat TZ, et al. Current status and future directions of the immune checkpoint inhibitors ipilimumab, pembrolizumab, and nivolumab in oncology. Ann Pharmacother. 2015;49(8):907–937.
- Dong A, Zhao Y, Li Z, et al. PD-L1 versus tumor mutation burden: which is the better immunotherapy biomarker in advanced non-small cell lung cancer? J Gene Med. 2021;23(2):e3294.
- Schaub JR, Stearns T. The Rilp-like proteins Rilpl1 and Rilpl2 regulate ciliary membrane content. Mol Biol Cell. 2013;24(4):453–464.
- Dolan PT, Zhang C, Khadka S, et al. Identification and comparative analysis of hepatitis C virus–host cell protein interactions. Mol Biosyst. 2013;9(12):3199–3209.
- Chen G, Sun L, Han J, et al. RILPL2 regulates breast cancer proliferation, metastasis, and chemoresistance via the TUBB3/PTEN pathway. Am J Cancer Res. 2019;9(8):1583–1606.
- Liu J, Xu M, Wu Z, et al. Low expression of RILPL2 predicts poor prognosis and correlates with immune infiltration in endometrial carcinoma. Front Mol Biosci. 2021;8:670893.
- Chen B, Cai HR, Xue S, et al. Bile acids induce activation of alveolar epithelial cells and lung fibroblasts through farnesoid X receptor-dependent and independent pathways. Respirology. 2016;21(6):1075–1080.
- Lin B, Du L, Li H, et al. Tumor-infiltrating lymphocytes: warriors fight against tumors powerfully. Biomed Pharmacother. 2020;132:110873.
- Martini M, De Santis MC, Braccini L, et al. PI3K/AKT signaling pathway and cancer: an updated review. Ann Med. 2014;46(6):372–383.
- Hinshaw DC, Shevde LA. The tumor microenvironment innately modulates cancer progression. Cancer Res. 2019;79(18):4557–4566.
- Lei X, Lei Y, Li JK, et al. Immune cells within the tumor microenvironment: biological functions and roles in cancer immunotherapy. Cancer Lett. 2020;470:126–133.
- Santoiemma PP, Powell DJ Jr. Tumor infiltrating lymphocytes in ovarian cancer. Cancer Biol Ther. 2015;16(6):807–820.
- Stanton SE, Disis ML. Clinical significance of tumor-infiltrating lymphocytes in breast cancer. J Immunother Cancer. 2016;4(1):59.
- Maibach F, Sadozai H, Seyed Jafari SM, et al. Tumor-infiltrating lymphocytes and their prognostic value in cutaneous melanoma. Front Immunol. 2020;11:2105.
- Patel SP, Kurzrock R. PD-L1 EXPRession as a preDICTive biomarker in cancer immunotHERAPY. Mol Cancer Ther. 2015;14(4):847–856.
- Williams GH, Stoeber K. The cell cycle and cancer. J Pathol. 2012;226(2):352–364.
- Masso-Valles D, Beaulieu ME, Soucek LM. MYCL, and MYCN as therapeutic targets in lung cancer. Expert Opin Ther Targets. 2020;24(2):101–114.
- Hsu SK, Chiu CC, Dahms HU, et al. Unfolded protein response (upr) in survival, dormancy, immunosuppression, metastasis, and treatments of cancer cells. Int J Mol Sci. 2019;20(10):2518.
- Madden E, Logue SE, Healy SJ, et al. The role of the unfolded protein response in cancer progression: from oncogenesis to chemoresistance. Biol Cell. 2019;111(1):1–17.
- Ben-Sahra I, BD M. mTORC1 signaling and the metabolic control of cell growth. Curr Opin Cell Biol. 2017;45:72–82.
- Guo Y, Xu F, Lu T, et al. Interleukin-6 signaling pathway in targeted therapy for cancer. Cancer Treat Rev. 2012;38(7):904–910.
- Balkwill F. TNF-α in promotion and progression of cancer. Cancer Metastasis Rev. 2006;25(3):409–416.
- Hanahan D. Hallmarks of cancer: new dimensions. Cancer Discov. 2022;12(1):31–46.
- Li XB, Gu JD, Zhou QH. Review of aerobic glycolysis and its key enzymes - new targets for lung cancer therapy. Thorac Cancer. 2015;6(1):17–24.
- Elstrom RL, Bauer DE, Buzzai M, et al. Akt stimulates aerobic glycolysis in cancer cells. Cancer Res. 2004;64(11):3892–3899.