
ABSTRACT
During eukaryotic cell division, organelles are distributed between daughter cells through a dynamic process to ensure that cells can differentiate and perform their functions correctly. Uncovering the mode of lipid droplet (LD) distribution may help reveal the mechanism of membrane remodeling during cell division and lipid droplet function. Our results showed that LDs were equally distributed in both daughter cells during cytokinesis. Further experiments demonstrated that the key factor regulating the movement of LDs is the microtubule (MT)-resident protein KIF5B. Because the KIF5B structure lacks a hydrophilic region, we believe that there are proteins that mediate the interaction between LDs and KIF5B. Mass spectrometric detection of KIF5B-interacting proteins on the surface of LDs demonstrated that LDs were first wrapped by intermediate filaments forming a meshwork and then contacted with MTs to mediate lipid droplet movement during cytokinesis. Disruption of the homogeneous distribution of LDs may hinder cell proliferation and even lead to apoptosis.
Introduction
Prior to mitosis, cells undergo several preparations to ensure that the two daughter cells are able to perform their functions properly. The replication and segregation of chromosomes have been the focus of many current studies, and lipid metabolism plays an important role in the division process[Citation1]. Lipid droplets (LDs), important subcellular structures involved in energy and lipid metabolism, must be properly inherited by daughter cells. However, little is known about the inheritance of LDs in cells[Citation2].
It is assumed that there are two modes of organelle inheritance, active and passive. Active segregation in postnatal animals occurs mainly through attached microtubules (MT); chromosomal inheritance is a prime example. In passive segregation, organelles are independent of the cytoskeleton, and a simple increase in their abundance is assumed to allow random and balanced inheritance to daughter cells [Citation3]. In yeast, some LDs move actively from the mother cell into the bud; meanwhile, LDs are mediated in the daughter cell by the molecular motor Myo2p, as well as the LD protein seipin. It has been suggested that LDs are actively distributed between daughter and mother cells rather than being recreated in daughter cells [Citation4–6]. However, the manner in which LDs are inherited by mammalian cells needs to be further investigated.
LDs exhibit multiple modes of motion, including free diffusion, confined Brownian motion, and directional motion along linear orbits. For the defined LDs, it is possible to switch between multiple motor states. However, a current study found that directional motion plays an important role in LD function Citation7,Citation8,]. The directional movement of LDs is usually mediated by the cytoskeleton through the motility-splice apparatus complex. The motility splice apparatus complex proteins that mediate LD movement include kinesin-1 (KHC), cytoplasmic dynein, and myosins. LD movements can facilitate or disrupt interactions with other organelles. MTs and microfilaments play an important role in the movement of intracellular LDs and their contact with other organelles [Citation8]. After depolymerization of intracellular MTs using nocodazole, a decrease in contact between LDs and mitochondria or peroxisomes is observed, along with a decrease in contact between LDs and peroxisomes and the Golgi apparatus. However, contacts between the LD, ER, and lysosomes are increased [Citation9]. The actin inhibitor latrunculin prevents the migration of LDs to the animal pole in zebrafish embryos as well as the correct distribution of LDs to spores of fission yeast [Citation10].
In mouse embryos, induction of forced lipophagy results in a reduction in LD size and number, and lowers triglyceride levels throughout embryonic development, ultimately leading to developmental delay [Citation11–13]. Mechanical removal of LDs from fertilized mouse eggs can lead to cell death in the offspring [Citation14]. LDs also play a key role in Drosophila oogenesis and DGAT1 is a key protein involved in LD synthesis. Inhibition of DGAT1 expression results in the absence of LD formation in Drosophila eggs, which ultimately leads to follicular death [Citation15,Citation16]. Thus, LDs play a very important role in cell development and differentiation. However, the mechanism by which the mother cell distributes LDs to the daughter cells during division is not well understood. This mechanism in animal cell lines can help to understand the function and role of LDs in cells and may provide new ideas for studying the developmental differentiation of embryonic cells in the future.
To date, it remains unclear how the distribution of LDs and their association with the cytoskeleton affect their distribution among daughter cells. When examining mitotic cells, we observed a marked change in the relationship between LDs and the MT network. We evaluated the possible mechanisms that actively control the LD distribution. In addition, we investigated the effects of the MT protein kinesin on LD distribution and the role of intermediate filaments (IF) mediating MT – LD attachment in promoting equal distribution of LDs among daughter cells. In conclusion, our results suggest that homogeneous distribution of LDs between daughter cells requires MT mediation.
Results
LDs are equally divided between daughter cells during mitosis
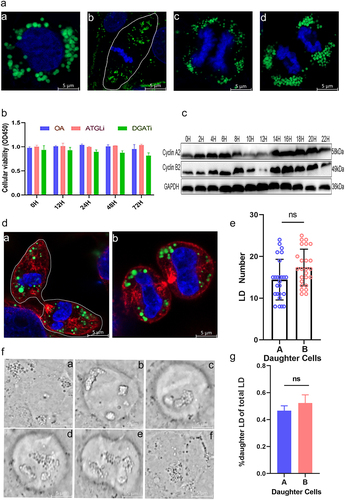
To determine the distribution pattern of LDs among daughter cells, laser confocal microscopy was used to observe the distribution pattern of LDs in HeLa cells during mitosis (). Only approximately 5% of cells in normal culture conditions are in the division phase when observed at any given time [Citation17,Citation18]. To improve the statistical efficiency of the observations, we used a double thymidine blocking method to synchronize HeLa cells () [Citation19]. The number of intracellular LDs was also increased to further improve observation efficiency by treating the cells with oleic acid 24 h before fixation [Citation20]. The cell viability did not change significantly after oleic acid treatment (). Subsequently, LD distribution during mitosis was determined. The results showed that there was no significant difference in the number of LDs present between the two daughter cells after mitosis () as well as between the newly formed daughter cells by live cell observation (). In conclusion, our results suggest that LDs divide equally between daughter cells during mitosis.
Figure 1. Equal distribution of LDs among daughter cells during mitosis. (a) Relative positions of LDs within the cell at different times of cell division. a: prophase. b: metaphase. c: anaphase. d: telophase. Blue: nucleus; green: LDs. (b) Cell viability assay. Cells were incubated with oleic acid (OA), ATGL inhibitor, and DGAT inhibitor to determine whether oleic acid treatment affected cell viability. (c) Synchronization of cell cycle efficiency by double thymidine blockade assay. A large number of cells were found to enter mitotic phase at the 12th h of treatment. (d) Equal distribution of LDs between daughter cells. a,b: telophase. Blue: chromosomes. Green: LDs. Red: MTs. (e) Number of LDs between daughter cells. “A” and “B” refer to two daughter cells that have just divided and formed. (f) Dynamic distribution of LDs during mitosis observed in live cells. a: prophase. b: metaphase. c: metaphase. d: anaphase. e: telophase. f: prometaphase. The special single-layer phospholipid membrane structure of LDs can be directly observed in the bright field. (g): Percentage of the number of LDs between daughter cells was observed using live cells. All values are shown as mean ± SEM.
LDs are released from MTs during cell division
We examined the relationship between the LDs and MT networks in HeLa cells using laser confocal microscopy (). These cells were synchronized using the double thymidine blocking method. During interphase mitosis, most LDs were associated with MTs, as confirmed in a variety of cells. During cytokinesis, LDs did not colocalize with the mitotic spindle (). This can be observed in fixed and living cells. The cells released LDs from the MTs as soon as they entered mitosis, and the LDs were repelled from the space occupied by the spindle. It can be seen by 3D reconstruction that the spindle and chromosome occupied the core of the cell and the LDs were distributed at the periphery. We counted the percentage of overlap between LDs and MTs during mitosis and found that it decreased significantly during mitosis (). The MTs that still colocalized with LDs during cytokinesis may result from incidental overlap during LD movement. Taken together, LDs appear to separate from MTs during cytokinesis.
Figure 2. No contact of LDs with microtubules (MTs) during interphase cytokinesis. (a) LDs in contact with MTs in different phases. a: prophase. b: metaphase. c: anaphase. d: telophase. Blue: chromosome. Green: LDs. Red: MTs. (b) Relative positions of LDs and MTs in the cell at different images were determined using the “Radial Profile”. a: prophase. b: metaphase. c: anaphase. d: telophase. (c) Percentage of LDs in contact with MTs at different simultaneous images. (d) Expression levels of MT proteins on LDs were measured at different simultaneous images. ***p < 0.01; all values are shown as mean ± SEM.
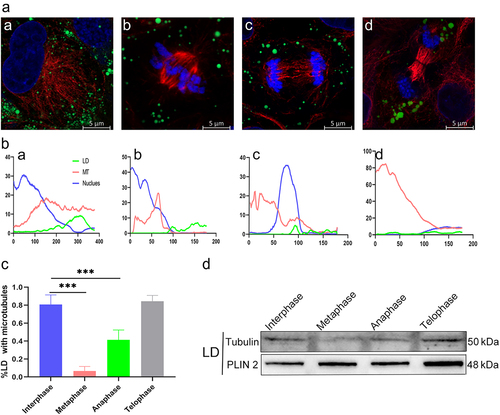
To determine the time of LD detachment from MTs, we analyzed live and fixed cells during mitosis. We used the ImageJ plugin “Radial Profile” to plot the signal distribution of DNA, MT proteins, and LDs relative to the DNA signal center () [Citation21]. During interphase, MT proteins and LDs had similar, existentially colocalized distribution profiles, which persisted as cells entered prophase mitosis. However, as the cell entered interphase, the MT network decondensed and shifted toward the center of the cell, forming a mitotic spindle. In contrast, there was no significant change in the relative positions of the LDs in the cell. However, during mitosis, the cell shrank and became round, with boundaries moving closer to the space where LDs were present. As a result, LDs that were stationary in relative positions appeared more peripheral to the cell, whereas spindle bodies formed in the central region where there were no LDs, that is, the former nuclear region. LDs did not rejoin MTs until late mitosis. Meanwhile, the cell cycle of HeLa cells was synchronized using a double thymidine blocking method, and cells were collected at different time points. Microtubulin on the surface of LDs was measured by extracting them, and the change in microtubulin content on the surface of LDs at different times was similar to the fluorescence image statistics (). Overall, we concluded that LDs localized at the cell periphery during mitosis were mainly released from reconstituted MTs.
LD contact with MTs is regulated by KIF5B
We examined the factors affecting LD distribution during cytokinesis. After observing close contact between MTs and LDs during interdivision, the colocalization of LDs and MTs was drastically reduced during division. Such drastic changes suggest that the proteins supporting this colocalization relationship have changed. MTs facilitate the movement of the latter into the cytoplasm by binding their resident proteins to other subcellular structures within the cell (). The KHC protein encoded by KIF5B assists MT transport in subcellular structures [Citation22,Citation23]. The cell cycle of HeLa cells was synchronized using the double-thymidine blocking method. Cells were fixed at different time points, and cells in different phases were obtained. Immunofluorescence observation of LDs, MTs, and KHC proteins revealed strong colocalization of the three proteins during interphase mitosis, but the colocalization was significantly weakened after entering metaphase.
Figure 3. Contact of LDs with MTs is regulated by KIF5B. (a) Diagram of the transport pattern of MTs involved in MT-to-cell subcellular structures by KIF5B. (b) Interference with KIF5B expression leads to reduced LD-MT contact in interphase. a: under normal conditions, LDs and MTs are in full contact. b: after interfering with KIF5B expression, the contact between LDs and MTs was reduced. Blue: nucleus. Green: LDs. Red: MTs. (C-G) Expression of interfering KIF5B leads to unequal distribution of LDs between daughter cells. (c) Immunofluorescence images of LD distribution between daughter cells. (d) Changes in intracellular KIF5B mRNA content after transfection with KIF5B interference fragments. (e) Detection of interfering KIF5B protein expression. (f) Live cell observation of the distribution of LDs between daughter cells when interfering with KIF5B-expressing cell division. a: prophase. b: metaphase. c: metaphase. d: anaphase. e: telophase. f: telophase. (g) Quantitative statistics of the distribution of LDs between daughter cells. (h) Statistics of the percentage distribution of LDs between daughter cells. ***p < 0.01; all values are shown as mean ± SEM.
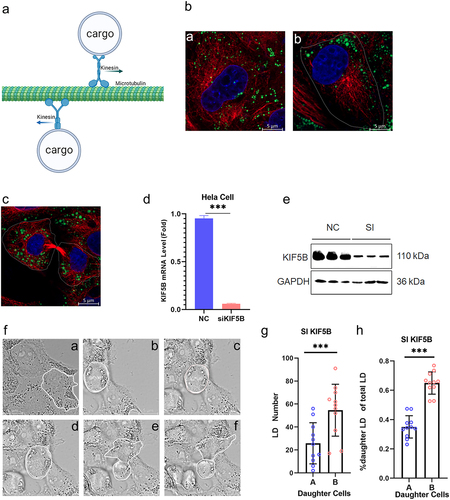
We further investigated whether KHC plays a key role in the interaction between MTs and LDs. After interference with KIF5B gene expression in HeLa cells, cellular proteins were extracted for western blotting assays and compared with cells transfected with vacuoles, and the interference effect was clear (). In this case, a reduction in LD and MT contact was also observed (). The simultaneous inhibition of KHC-expressing HeLa cells using double thymidine blocking assays was followed by counting the number of LDs in the two daughter cells that were divided and formed using immunofluorescence (). A highly significant difference in the number of LDs was found between daughter cells with interfered KHC expression (). The same phenomenon was observed when the interfering cells were observed using live-cell imaging (). Taken together, these results indicate that the contact between LDs and MTs is regulated by KIF5B, in contrast to the normal situation where LDs are equally distributed among daughter cells, suggesting that KIF5B plays an important role in promoting the uniform distribution of LDs among daughter cells.
LDs bind to KHC proteins via KRT proteins, which in turn connect to MTs
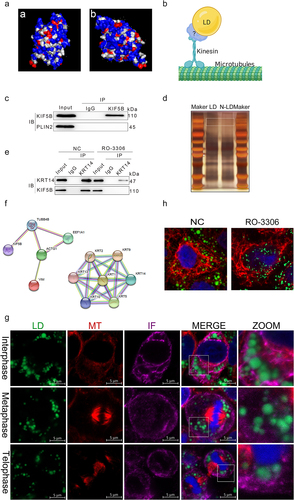
It has been determined that KIF5B plays an important role in the interaction of LDs with MTs. Based on structural analysis of the KHC protein, it was found that the KHC surface is highly hydrophilic and less hydrophobic (). LDs, as organelles formed by a single phospholipid membrane envelope, are highly hydrophobic, and it is difficult for KHC to anchor directly on the LD surface to play a linkage role. We suggest that KHC attachment to LDs requires the mediation of intermediate proteins (). To identify proteins on the LD surface that directly interact with KHC, active LDs were extracted from the cytoplasm of HeLa cells after incubation with oleic acid for 24 h. Subsequently, the KHC protein was used as the target protein, and immunoprecipitation techniques were used to mobilize the proteins attached to the KHC protein on the LD surface (). Subsequently, the proteins attached to the KHC protein on the LD surface were identified by LC-MS/MS. The mass spectrometry results showed that there were 15 proteins interacting with KHC proteins on the LD surface (), which could be classified into two categories: MT proteins, IF KRT family proteins, and proteins that did not correspond to LD-surface-resident proteins. We subsequently incubated HeLa cells with oleic acid for 24 h and then extracted the active LDs from the cytoplasm again, followed by the KRT14 protein identified by mass spectrometry as the target protein. Immunoprecipitation was used to mobilize the proteins linked to the KHC proteins, and the inclusion of KHC proteins in the samples was detected using western blotting. Combining the mass spectrometry and WB results, we concluded that intracellular LDs first interact with IF proteins, which in turn are linked to MTs via KHC proteins (). However, in the absence of LD-surface-resident proteins in the mass spectrometry results, it is still necessary to explain by which means LDs interconnect with IFs. The HeLa cell cycle was synchronized using a double thymidine blocking method, and the interactions between KRT14, LDs, and MTs were detected by immunofluorescence. IFs seemed to interact with LDs by forming a mesh-like structure to wrap them (). We conclude that the functional realization of the KRT5/14 protein in cytokinesis is dependent on its phosphorylation. Treatment of cells with KRT14 protein inhibitors showed similar results to those of KIF5B expression. After the inhibition of KRT14 protein phosphorylation, the difference in the number of LDs between daughter cells was highly significant, and the distribution of LDs between daughter cells was unequal ().
Figure 4. Lds bind to KIF5B via KRT proteins, which in turn connect to MTs. (a) Predicted hydrophobicity of the KIF5B protein. The hydrophobic structural domain on the surface of the KHC protein was predicted using protein structure prediction software. Owing to the hydrophobic nature of the LD surface, only proteins with a certain number of hydrophobic structural domains present are likely to be anchored to the LD surface. This method was used to predict the ability of KHC proteins to bind to the LD surface. Red and blue represent the hydrophobic and hydrophilic domains of the protein surface. (b) Prediction of the LD-MT binding model. (c) Immunoprecipitation detection of KIF5B on the LD surface.(d) Protein abundance assay. Results were mobilized to identify protein abundance after silver staining of KIF5B on the LD surface. (e) Interacting protein assay on the LD surface with KIF5B. Mass spectrometry results show that most of the KIF5B-interacting proteins belonged to the KRT protein family. (f) Interacting protein validation. The presence of KRT14 protein on the surface of LDs was determined to investigate whether it interacts with KIF5B. (g) Inhibition of KRT14 protein phosphorylation leads to a decrease in LD-mediated filament attachment. Blue: nucleus. Green: LDs. Red: KRT14 protein. (h) Immunofluorescence maps of the interactions between LDs, MTs, and IFs at different times of mitosis. Green: LDs. Red: MTs. Purple: IFs.
Discussion
LDs are a ubiquitous class of organelles that serve as hubs for lipid metabolism and transport in cells [Citation11]. Lipid metabolism, facilitated by LDs in cells, plays an important role in cell maintenance, renewal, differentiation, and pathogenesis of inherited diseases [Citation24–26]. Current research has focused on the role of stem cell lipid metabolism in cell division. In hematopoietic stem cells (HSC), the peroxisome proliferator-activated receptor delta (PPARδ) - fatty acid oxidation (FAO) pathway plays an important role in the maintenance of HSC. Inhibition of Ppard or Pml gene expression or FAO results in the inability of HSC to divide asymmetrically normally. Conversely, activation of the PPARδ pathway activates asymmetric division of HSC [Citation27,Citation28]. Satellite cells are the precursors for muscle differentiation. When intracellular fatty acid oxidation decreases and glycolytic metabolism increases, undifferentiated satellite cells proliferate in response to body needs [Citation29]. Neural stem/progenitor cells (NSPCs) produce a steady stream of new neuronal cells in adulthood. LDs are abundant in adult mouse NSPCs, and there is a marked change in the number of LDs when NSPCs differentiate. NSPC proliferation is influenced by LD accumulation, catabolism, and asymmetric inheritance during mitosis [Citation30]. In studies on budding yeast, it was found that during mitotic exit, cell division and effective cell separation can only proceed accurately if excess lipids are converted to neutral lipids and stored in LDs [Citation31]. In a study of the fission yeast “cut” mutant, it was found that promoting LD production by exogenous supplementation with ammonium chloride alleviates mutants exhibiting defects in the coordination of nuclear division with cytokinesis timing and reduced abnormal mitosis and lethality [Citation32]. Histones are essential for chromatin packaging; however, free histones that are not incorporated into chromatin are toxic. Early Drosophila embryos contain large amounts of LDs, and histones are stored by sequestration of LDs to avoid the toxicity of free histones. During embryonic development, high-demand histones are supplied to the chromatin [Citation33,Citation34]. LDs play an important role in cell division, and studying the mechanism of LD distribution between daughter and mother cells may provide a new perspective for understanding the mechanisms of cell growth and differentiation.
During cell division, the cytoskeleton and membrane system undergo rapid, complex, and orderly remodeling. In addition to the replicative division of chromatin, membrane organelles and nuclear membranes undergo depolymerization and remodeling, whereas smaller organelles such as mitochondria and LDs are rationally distributed to daughter cells [Citation35]. LDs and mitochondria are the hubs of energy metabolism in cells. In our study of the distribution mechanism of LDs in daughter cells, we concluded that there may be a similar distribution mechanism of LDs to that of the mitochondria. There are two hypotheses for mitochondrial partitioning. One is passive partitioning with cytoplasmic flow. This distribution model emphasizes that mitochondria are pre-divided by CDK1 and aurora A (AurA), which activate the fission protein DRP1, which in turn assembles at sites of endoplasmic reticulum (ER) and mitochondrial interactions [Citation36]. RalA is activated by AurA, and together with its effector protein RALBP1, is involved in the localization of DRP1 to the fission site [Citation35,Citation37,Citation38]. DRP1-mediated fission produces fragmented mitochondria [Citation39]. A large number of fragmented mitochondria are dispersed in the cytoplasm, not in contact with the spindle, which occupies the center of the cell or the outermost cell membrane, and passively enter the daughter cell as the cell divides. Super-resolution imaging has also been used to define the mechanism for the organization and active inheritance of mitochondria into daughter cells during mitosis. Three forms of microfilament assembly around mitochondria were identified: first, the microfilaments form a lattice organization to hold the mitochondria and ER in place to maintain their relatively uniform distribution; in an actin wave, most mitochondria are wrapped in an actin cloud, which suddenly ruptures symmetrically to form comet tails that drive the mitochondria to move long distances, disorganizing the organelles [Citation40].
Lipid droplets are the primary site of intracellular lipid metabolism and play a crucial role in maintaining normal cell growth and division. During mitosis, lipid droplets are mobilized through lipolysis or lipophagy to promote proper lipid metabolism, membrane biosynthesis, and normal cell growth [Citation41–43]. In addition, during cell division, lipid droplets can store free histones in cells, reducing the risk of proteotoxicity, and provide histones for chromatin assembly during nuclear remodeling [Citation33,Citation34,Citation44]. However, if the distribution of lipid droplets between daughter cells is not equal, it can disrupt chromatin function and inhibit normal cell growth [Citation11,Citation45–47]. It’s important that lipid droplets are equally distributed between daughter cells during division to ensure proper cell growth.
Prior to this study, few studies have reported the distribution of LDs between daughter cells and the interaction of LDs with cytoskeletal proteins. Previous studies have found that kinesin-1 protein plays an important role in lipid metabolism. When mouse liver insulin expression is upregulated, kinesin-1 protein is recruited to the surface of LDs, which are subsequently transported to the surface of the smooth ER for catabolism, thereby facilitating the release of triglycerides from the liver [Citation48]. Interestingly, fasting results in the inhibition of kinesin-1 recruitment to LDs in mouse hepatocytes, while hindering hepatic triglyceride secretion [Citation49]. Adipose-specific Kif5b knockout mice show exacerbated diet-induced obesity and insulin resistance, suggesting that the kinesin-1 protein is associated with abnormal lipid metabolism in mouse adipocytes [Citation50]. Our results suggest that MT movement mediates LD distribution between daughter cells. During the entire cell cycle, LDs are wrapped by a meshwork structure formed by IFs, which, in turn, interact with MTs via KHC proteins. During mitosis, MTs form spindle aggregates at the center of the cell to mediate homogeneous chromosome partitioning. During mid-mitosis, MT – LD interactions are greatly reduced, and LDs aggregate into clusters and flow with the cytoplasm. From late mitosis, the interactions between LDs and MTs increase again until the end of mitosis, when LDs move with MTs to both sides of the cell, until two daughter cells are formed. We found that KHC proteins play a key role in the MT-mediated LD distribution between daughter cells. After interfering with the expression of the KHC protein, the LDs, which are aggregated into clusters at the end of mitosis, do not come into contact with the MTs, but enter the two daughter cells randomly with cytoplasmic flow; in this case, the LDs are not equally distributed between the daughter cells.
Our study showed that LDs enter daughter cells during mitosis by an equal distribution of kinesin-1 protein regulation. The interaction between LDs and MTs was disrupted when the cells entered mitosis (). Some of the discrepancies may result from the fact that, under fluorescence microscopy, the MT-rich core overlaps with the surrounding LDs in a two-dimensional image, but there is actually no interaction. Furthermore, we found that the peripheral distribution of LDs was a passive result of MT release. Whether LDs are actively transported away from the spindle or bolus to the peripheral actin or the ER remains to be further investigated. Although other LD associations may also be disrupted during this period, our focus is on the mechanism of MT release followed by LD reorganization at the terminal stage and how MTs assist in LD inheritance.
In summary, LDs are sites of cellular lipid storage as well as centers of energy homeostasis. The biogenesis and degradation of LDs, as well as the interaction between LDs and other organelles, play important roles in cellular metabolism and are essential for buffering lipotoxicity [Citation11]. During cell division, LDs store free histones in the cells and alleviate proteotoxicity. Additionally, LDs provide histones for chromatin assembly during nuclear remodeling [Citation33,Citation34,Citation44]. During cell division, the mother cells must pass organelles from the cytoplasm to daughter cells. However, the mechanism by which cells pass LDs to their daughter cells remains unclear. In this study, we demonstrated that the distribution of LDs among daughter cells is homogeneous and mediated by MT kinesin-1 and the IF protein KRT-14. Our findings reveal new aspects of LD motility and lay the foundation for studying their function during mitosis. They also provide insights for studying the distribution of other organelles during cell division.
Materials and methods
Immunofluorescence
Cells were fixed with 4% paraformaldehyde for 10 min, washed three times, permeabilized with diluted Triton X-100 at a ratio of 1:1000 for 10 min, washed, and then closed with 1% BSA at 37°C for 1 h. Cells were treated with anti-α-tubulin (AC012; ABclonal; Wuhan, China), anti-KIF5B (A20928; ABclonal; Wuhan, China), and anti-cytokeratin 14 (KRT14) (A19039; ABclonal; Wuhan, China) as primary antibodies at a ratio of 1:200 in 1% BSA containing PBS, and incubated overnight, followed by three washes. The cells were incubated with ABflo® 647-conjugated Goat Anti-Rabbit IgG (H+L) (AS060; ABclonal; Wuhan, China) and Cy3 Goat Anti-Mouse IgG (H+L) (AS008; ABclonal; Wuhan, China) secondary antibodies at 37°C for 1 h at a ratio of 1:1000 and then washed three times. The LD dye BODIPY and the nuclear dye DAPI were incubated at dilutions of 1:8000 and 1:2000, respectively, for 10 min at room temperature, followed by three washes. Photographs were obtained using a Zeiss LSM 800 laser confocal microscope with a 63× lens. Images were processed using the ImageJ software to make linear adjustments for color and contrast.
Cell culture and transfection
Cell culture: cells were placed in an incubator containing 5% CO2 at 37°C and cultured in DMEM supplemented with 10% fetal bovine serum (FBS), penicillin, and streptomycin (Life Technologies).
Transfection of RNA interference fragments: siRNA fragments were wrapped with Lipofectamine 2000 (Life Technologies) and subsequently added to normal cell culture medium to incubate the cells. The cells were collected two days later. Kif5b protein expression was detected in cells.
siRNA sequence information
Sequence information of kif5b siRNA: GGAACGTCTAAGAGTAGAA.
Western blotting
Cells cultured in six-well plates were washed three times with PBS. PMSF was prepared with RAPI at a ratio of 1:100, and then 100 μL was added to each well of the six-well plates, followed by collection of cells and incubation on ice for 30 min. Finally, the supernatant was collected by centrifugation at 10,000 rpm for 10 min using a precooled centrifuge at 4°C. SDS was added to the supernatant at a ratio of 1:4, and the collected samples were used for western blotting after 10 min in a metal bath at 98°C. The antibodies used in the experiments were as follows: anti-KIF5B (A20928; ABclonal; Wuhan, China), anti-cytokeratin 14 (KRT14) (A19039; ABclonal; Wuhan, China), and HRP Goat Anti-Rabbit IgG (H+ L) (AS014; ABclonal; Wuhan, China).
Live cell observation
Cell division was observed in bright field using a Zeiss Live Cell Workstation at a cell density of approximately 80%, with one image taken every 30 s. Three fields of view were selected per shot. Filming was continued for 24 h to observe the complete cell cycle.
Synchronization and drug treatment
The cells were treated with 2 mM thymidine nucleoside for 14 h, followed by 9 h in fresh medium, and then treated with thymidine nucleoside for 14 h. At this time, the released cells were at the S/G2 phase junction and then treated with fresh medium for 8 h for mitotic imaging, and observation of terminal cells required another 2 h treatment with fresh medium. For KRT protein phosphorylation, after a second adenosine nucleoside treatment for 14 h, cells were treated with fresh medium containing 20 nM RO-3306 for 8 h after observation.
LD extraction
LD extraction reagent Buffer A: Tricine (1.9 g) was added to 400 mL deionized water, pH was adjusted to 7.8 with potassium hydroxide, 50 mL of 2.5 M sucrose was added, the volume was adjusted to 500 mL, and sterilized at 4°C. LD extraction reagent Buffer B: HEPES (0.95 g), 1.9 g KCl, and 0.038 g MgCl2 were dissolved in 180 mL deionized water, pH was adjusted to 7.4 with potassium hydroxide, the total volume was adjusted to 200 mL, sterilized, and stored at 4°C.
The cells were lysed for 10 min using 500 μL Buffer A, transferred to a 1.5 mL centrifuge tube using a cell scraper, mixed three times, transferred to a mortar and ground three times, then transferred to a new centrifuge tube, cleaned with Buffer B, transferred to a new centrifuge tube, and leveled using Buffer B. The solution was centrifuged for 1 h at 4°C/15000 rpm and divided into three layers, with the upper white layer containing the LDs. The centrifugation step was repeated to increase LD concentration.
Immunoprecipitation
Preparation of extracted LDs in advance. Fifty μL protein A/G magnetic was added to a 1.5 mL centrifuge tube and washed three times using binding buffer, followed by transferring 10 μL KIF5B antibody/KRT14 antibody and incubating with the magnetic beads for 30 min in an ice bath. The beads were then washed three times with binding buffer and the LDs prepared in advance were added to the centrifuge tubes. The centrifuge tubes were incubated overnight on a shaker at 50 rpm at 4°C. Finally, the magnetic beads were washed three times with binding buffer and stored in SDS buffer for analysis by western blotting.
Statistical analysis
Data statistics: LDs in daughter cells were counted using ImageJ; specifically, the green channel (representing LDs) in the fluorescent image was saved as a separate image.
Open the image using the Image J File-Open function
Convert the image to 8-bit using Image-Type-8-bit.
Adjust the threshold using Image-Adjust-Threshold to remove the background.
Use Process-Binary-Watershed to interrupt the overlapping part of the nuclei.
Use Analyze-Analyze Particles to automatically analyze and count out the number of lipid droplets.
“Radial Profile” in Image J was used to perform quantitative counts of LD and MT interactions at different time periods.
Data analysis: LD counting was performed for cells that were about to complete division into two daughter cells, and the number of LDs of these two daughter cells was divided into two groups, A and B, in the order of smallest to largest. Thirty cell groups were counted. Differences between the data from groups A and B were detected using the t-test, error bars using standard error of mean(SEM) representation.
Acknowledgements
The authors would like to acknowledge the support provided by the Large Instrument Open Sharing Platform at Huazhong Agricultural University, Wuhan, Hubei, China. We appreciate their assistance and contribution to our research work.
Disclosure statement
No potential conflict of interest was reported by the authors.
Additional information
Funding
References
- Yi M, et al . Emerging role of lipid metabolism alterations in Cancer stem cells. J Exp Clin Cancer Res. 2018;37(1).
- Storck EM, Özbalci C, Eggert US, et al. Lipid Cell Biology: A Focus on Lipids in Cell Division. Annu. Rev. Biochem.2018;87(1):839–869. DOI:10.1146/annurev-biochem-062917-012448
- Symens N, Soenen SJ, Rejman J, et al. Intracellular partitioning of cell organelles and extraneous nanoparticles during mitosis. Adv Drug Delivery Rev. 2012;64(1):78–94.
- Knoblach B, Rachubinski RA. Transport and retention mechanisms govern lipid droplet inheritance in Saccharomyces cerevisiae. Traffic. 2015;16(3):298–309.
- Wolinski H, Kolb D, Hermann S, et al. A role for seipin in lipid droplet dynamics and inheritance in yeast. J Cell Sci. 2011;124(Pt 22):3894–3904.
- Yang H-J, Osakada H, Kojidani T, et al. Lipid droplet dynamics during Schizosaccharomyces pombe sporulation and their role in spore survival. Biol Open. 2017;6(2):217–222.
- Norregaard K, Metzler R, Ritter CM, et al. Manipulation and Motion of Organelles and Single Molecules in Living Cells. Chem. Rev. 2017;117(5):4342–4375. DOI:10.1021/acs.chemrev.6b00638
- Kilwein MD, Welte MA. Lipid droplet motility and organelle contacts. Contact (Thousand Oaks (Ventura County, Calif)). 2019;2. DOI:10.1177/2515256419895688
- Valm AM, Cohen S, Legant WR, et al. Applying systems-level spectral imaging and analysis to reveal the organelle interactome. Nature. 2017;546(7656):162–167.
- Dutta A, Kumar Sinha D. Turnover of the actomyosin complex in zebrafish embryos directs geometric remodelling and the recruitment of lipid droplets. Sci Rep. 2015;5:13915.
- Olzmann JA, Carvalho P. Dynamics and functions of lipid droplets. Nat Rev Mol Cell Biol. 2019;20(3):137–155.
- Thiam AR, Farese RV, Walther TC. The biophysics and cell biology of lipid droplets. Nat Rev Mol Cell Biol. 2013;14(12):775–786.
- Tatsumi T, Takayama K, Ishii S, et al. Forced lipophagy reveals that lipid droplets are required for early embryonic development in mouse. Development. 2018;145(4).
- Arena R, Bisogno S, Gąsior Ł, et al. Lipid droplets in mammalian eggs are utilized during embryonic diapause. Proc Natl Acad Sci USA. 2021;118(10).
- Giedt MS, Tootle TL. The vast utility of drosophila oogenesis. Methods Mol Biol. 2023;2626:1–36.
- Buszczak M, Lu X, Segraves WA, et al. Mutations in the midway gene disrupt a Drosophila acyl coenzyme A: diacylglycerol acyltransferase. Genetics. 2002;160(4):1511–1518.
- Ma HT, Poon RY. Synchronization of hela cells. Methods mol biol. 2017;1524:189–201.
- Ma HT, Poon RY. Synchronization of HeLa cells. Methods Mol Biol. 2011;761:151–161.
- Yao Y, Zhang Y, Liu W, et al. Highly efficient synchronization of sheep skin fibroblasts at G2/M phase and isolation of sheep Y chromosomes by flow cytometric sorting. Sci Rep. 2020;10(1):9933.
- Tie F, Ding J, Hu N, et al. Kaempferol and Kaempferide attenuate oleic acid-induced lipid accumulation and oxidative stress in HepG2 cells. Int J Mol Sci. 2021;22(16). DOI:10.3390/ijms22168847
- Chung Jarom Y-M, Steen Judith A, Schwarz Thomas L. Phosphorylation-induced motor shedding is required at mitosis for proper distribution and passive inheritance of mitochondria. Cell Rep. 2016;16(8):2142–2155.
- Ferro LS, Fang Q, Eshun-Wilson L, et al. Structural and functional insight into regulation of kinesin-1 by microtubule-associated protein MAP7. Science. 2022;375(6578):326–331.
- Zorgniotti A, Ditamo Y, Arce CA, et al. Irreversible incorporation of L-dopa into the C-terminus of α-tubulin inhibits binding of molecular motor KIF5B to microtubules and alters mitochondrial traffic along the axon. Neurobiol Dis. 2021;147:105164.
- Herker E, Vieyres G, Beller M, et al. Lipid droplet contact sites in health and disease. Trends Cell Biol. 2021;31(5):345–358.
- Thiam AR, Ikonen E. Lipid droplet nucleation. Trends Cell Biol. 2021;31(2):108–118.
- Ralhan I, Chang C-L, Lippincott-Schwartz J, et al. Lipid droplets in the nervous system. J Cell Bio. 2021;220(7). DOI:10.1083/jcb.202102136
- Ito K, Carracedo A, Weiss D, et al. A PML–PPAR-δ pathway for fatty acid oxidation regulates hematopoietic stem cell maintenance. Nat Med. 2012;18(9):1350–1358.
- Yusuf RZ, Scadden DT. Fate through fat: lipid metabolism determines stem cell division outcome. Cell Metab. 2012;16(4):411–413.
- Ryall JG, Dell’orso S, Derfoul A, et al. The NAD(+)-dependent SIRT1 deacetylase translates a metabolic switch into regulatory epigenetics in skeletal muscle stem cells. Cell Stem Cell. 2015;16(2):171–183.
- Ramosaj M, Madsen S, Maillard V, et al. Lipid droplet availability affects neural stem/progenitor cell metabolism and proliferation. Nat Commun. 2021;12(1):7362.
- Yang P-L, Hsu T-H, Wang C-W, et al. Lipid droplets maintain lipid homeostasis during anaphase for efficient cell separation in budding yeast. Mol Biol Cell. 2016;27(15):2368–2380.
- Zach R, Tvaružková J, Schätz M, et al. Mitotic defects in fission yeast lipid metabolism ‘cut’ mutants are suppressed by ammonium chloride. FEMS Yeast Res. 2018;18(6). DOI:10.1093/femsyr/foy064
- Li Z, Thiel K, Thul PJ, et al. Lipid droplets control the maternal histone supply of Drosophila embryos. Curr Biol. 2012;22(22):2104–2113.
- Li Z, Johnson MR, Ke Z, et al. Drosophila lipid droplets buffer the H2Av supply to protect early embryonic development. Curr Biol. 2014;24(13):1485–1491.
- Carlton JG, Jones H, Eggert US. Membrane and organelle dynamics during cell division. Nat Rev Mol Cell Biol. 2020;21(3):151–166.
- Labbé K, Murley A, Nunnari J. Determinants and functions of mitochondrial behavior. Annu Rev Cell Dev Biol. 2014;30:357–391.
- Kashatus DF, Lim K-H, Brady DC, et al. RALA and RALBP1 regulate mitochondrial fission at mitosis. Nat Cell Biol. 2011;13(9):1108–1115.
- Walczak CE, Cai S, Khodjakov A. Mechanisms of chromosome behaviour during mitosis. Nat Rev Mol Cell Biol. 2010;11(2). DOI:10.1038/nrm2832
- Kanfer G, Kornmann B. Dynamics of the mitochondrial network during mitosis. Biochem Soc Trans. 2016;44(2):510–516.
- Moore AS, Coscia SM, Simpson CL, et al. Actin cables and comet tails organize mitochondrial networks in mitosis. Nature. 2021;591(7851):659–664.
- Zechner R, Madeo F, Kratky D. Cytosolic lipolysis and lipophagy: two sides of the same coin. Nat Rev Mol Cell Biol. 2017;18(11):671–684.
- Schulze RJ, Sathyanarayan A, Mashek DG. Breaking fat: the regulation and mechanisms of lipophagy. Biochimica et Biophysica Acta (BBA) - Mol Cell Biol Lipids. 2017;1862(10, Part B):1178–1187.
- Martinez-Lopez N, Singh R. Autophagy and Lipid Droplets in the Liver. Annu Rev Nutr. 2015;35:215–237.
- Johnson MR, Stephenson RA, Ghaemmaghami S, et al. Developmentally regulated H2Av buffering via dynamic sequestration to lipid droplets in Drosophila embryos. Elife. 2018;7. DOI:10.7554/eLife.36021
- Kim UJ, Han M, Kayne P, et al. Effects of histone H4 depletion on the cell cycle and transcription of Saccharomyces cerevisiae. Embo J. 1988;7(7):2211–2219.
- Han M, Chang M, Kim U-J, et al. Histone H2B repression causes cell-cycle-specific arrest in yeast: effects on chromosomal segregation, replication, and transcription. Cell. 1987;48(4):589–597.
- Gunjan A, Verreault A. A Rad53 kinase-dependent surveillance mechanism that regulates histone protein levels in S. cerevisiae. Cell. 2003;115(5):537–549.
- Kumar M, Ojha S, Rai P, et al. Insulin activates intracellular transport of lipid droplets to release triglycerides from the liver. J Cell Bio. 2019;218(11):3697–3713.
- Schulze RJ, McNiven MA. Fasting inhibits the recruitment of kinesin-1 to lipid droplets and stalls hepatic triglyceride secretion. Hepatology. 2019;69(1):444–446.
- Cui J, Pang J, Lin Y-J, et al. Adipose-specific deletion of exacerbates obesity and insulin resistance in a mouse model of diet-induced obesity. Faseb J. 2017;31(6):2533–2547.