
ABSTRACT
The Fragile Histidine Triad Diadenosine Triphosphatase (FHIT) gene is located in the Common Fragile Site FRA3B and encodes an enzyme that hydrolyzes the dinucleotide Ap3A. Although FHIT loss is one of the most frequent copy number alterations in cancer, its relevance for cancer initiation and progression remains unclear. FHIT is frequently lost in cancers from the digestive tract, which is compatible with being a cancer driver event in these tissues. However, FHIT loss could also be a passenger event due to the inherent fragility of the FRA3B locus. Moreover, the physiological relevance of FHIT enzymatic activity and the levels of Ap3A is largely unclear. We have conducted here a systematic pan-cancer analysis of FHIT status in connection with other mutations and phenotypic alterations, and we have critically discussed our findings in connection with the literature to provide an overall view of FHIT implications in cancer.
Introduction
Genome instability is a feature of cancer cells that leads to the accumulation of mutations that contribute to tumorigenesis initiation and progression [Citation1]. Within the genome, Common Fragile Sites (CFSs) are regions prone to having genomic alterations and are frequently deleted in cancer [Citation2]. These genomic regions harbor long genes that replicate late in the cell cycle. The common fragile site 3B (FRA3B) is among the most fragile ones, and it contains the gene Fragile Histidine Triad Diadenosine Triphosphatase (FHIT) (). FHIT is a long gene spanning 1.5Mb located on Chromosome 3. It has 10 exons – separated by unusually long introns – of which only 5 are coding exons (5 to 9). The FHIT (Bis(5”−adenosyl)-triphosphatase) protein has 147aa and is found in the cytoplasm [Citation3,Citation4], but also in the nucleus [Citation4] and mitochondria [Citation5]. FHIT belongs to a branch of the histidine triad (HIT) family proteins, which have a specific sequence HφHφHφφ where φ is a hydrophobic amino acid, and they have nucleotide hydrolase and transferase activity [Citation6] (). FHIT is a homodimer-forming enzyme [Citation7] with the active site in the His-96 [Citation8] and has hydrolase activity that catalyzes the cleavage of P1-P3-bis(5‘−adenosyl) triphosphate (Ap3A) into AMP and ADP [Citation9,Citation10] (). Furthermore, FHIT binds, although with lower affinity, P1-P4-bis(5’−adenosyl) tetraphosphate (Ap4A) and hydrolyzes it into ATP and AMP [Citation7,Citation9,Citation11]. It has also been proposed that FHIT may hydrolyze other substrates such as natural metabolites adenosine 5’-phosphosulphate and adenosine 5’monophosphoramidate [Citation12,Citation13]. The biological relevance and functionality of these enzymatic reactions and metabolites are still unclear.
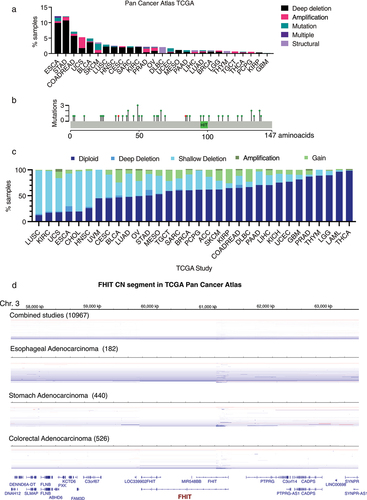
Figure 1. (a) Schematic representation of the FHIT gene. The exons are depicted as vertical lines in blue for the untranslated region and in red for the coding exons. FHIT is located in the chromosome 3 and spans over 1.5Mb at positions 59,747,277 –61,251,452 in the reverse strand. Transcript ID ENST00000492590.6 is shown. It has 3116bp and codes for a small protein of 147aa (accession CCDS2894, A0A024R366 and P49789). Its RefSeq ID is NM_002012.4. The length of the 5´UTR is 363bp and of the 3´UTR 2308bp. Adapted from Ensembl. (b) Schematic representation of the FHIT protein. The FHIT (Bis(5”−adenosyl)-triphosphatase) protein has 147aa and a molecular mass of 16.733 kDa (UniProt). The aminoacid sequence is shown and several features are highlighted: the histidine triad motif (HVHVVLH aa 94 to 100) is shown as a blue bar; the active site in His96 is shown as a red circle, phosphotyrosines are indicated with blue triangles and the secondary structure is depicted as ping bars for the beta strands and green bars for the helixes. Adapted from uniprot. (c) Schematic representation of FHIT enzymatic reaction. P [Citation1], P [Citation3-]bis(5”−adenosyl) triphosphate (Ap3a) is hydrolyzed into ADP, AMP and a proton. Reaction ID in RHEA is 13,893.
![Figure 1. (a) Schematic representation of the FHIT gene. The exons are depicted as vertical lines in blue for the untranslated region and in red for the coding exons. FHIT is located in the chromosome 3 and spans over 1.5Mb at positions 59,747,277 –61,251,452 in the reverse strand. Transcript ID ENST00000492590.6 is shown. It has 3116bp and codes for a small protein of 147aa (accession CCDS2894, A0A024R366 and P49789). Its RefSeq ID is NM_002012.4. The length of the 5´UTR is 363bp and of the 3´UTR 2308bp. Adapted from Ensembl. (b) Schematic representation of the FHIT protein. The FHIT (Bis(5”−adenosyl)-triphosphatase) protein has 147aa and a molecular mass of 16.733 kDa (UniProt). The aminoacid sequence is shown and several features are highlighted: the histidine triad motif (HVHVVLH aa 94 to 100) is shown as a blue bar; the active site in His96 is shown as a red circle, phosphotyrosines are indicated with blue triangles and the secondary structure is depicted as ping bars for the beta strands and green bars for the helixes. Adapted from uniprot. (c) Schematic representation of FHIT enzymatic reaction. P [Citation1], P [Citation3-]bis(5”−adenosyl) triphosphate (Ap3a) is hydrolyzed into ADP, AMP and a proton. Reaction ID in RHEA is 13,893.](/cms/asset/2f4a485c-fa9f-4f77-af52-7c29d48acf76/kccy_a_2304509_f0001_oc.jpg)
Diadenosine polyphosphates (ApnA) were discovered in the 1960s [Citation14] and they are present in a variety of organisms. How these molecules are synthesized is not completely clear but they are believed to be by-products of various aminoacyl-tRNA synthetases [Citation15,Citation16]. In the first step of the reaction aminoacyl-AMP is formed, then it is attached by the cognate tRNA forming the correctly loaded aminoacyl-tRNA or, alternatively, by ADP or ATP resulting in the formation of Ap3A or Ap4A, respectively [Citation17]. In complex organisms, ApnAs are present in the intracellular and extracellular environments. In the extracellular environment, they are involved in regulating the function of various physiological systems, such as the cardiovascular system [Citation18], or in insulin-secretory activity [Citation19]. Ap3A and Ap4A are stored in high concentration in the platelet and released, upon activation, in the plasma, inducing prothrombotic or antithrombotic effects to maintain blood homeostasis [Citation20,Citation21]. Instead, the intracellular functions of ApnA are still poorly defined. Changes in Ap3A and Ap4A levels have been associated with cell differentiation and apoptosis [Citation22]. In particular, the increase in Ap3A induces the interaction with FHIT, resulting in a pro-apoptotic signaling complex [Citation23]. In line with that, the restoration of FHIT in cancer cell lines and mice suppresses tumorigenesis and induces apoptosis [Citation24–26]. Recently, using a chemical proteomic approach, it has been reported that upon stress, a stable complex FHIT-Ap3A is formed and blocks translation, leading to a reduction of cell viability [Citation27]. In addition, Ap3A and Ap4A are considered “alarmones” and their cellular concentrations increase upon cellular stress, like temperature change [Citation28], exposure to ethanol, cadmium, or arsenite [Citation29], oxidative damage via hydrogen peroxide and the DNA damaging agent mitomycin C [Citation30] suggesting a role in cellular stress and damage response pathways. Furthermore, a number of proteins interacting with Ap3A and Ap4A have been recently described [Citation30,Citation31]. Nevertheless, it is still controversial whether ApnA are functional molecules with specific signaling and regulatory functions, or simply by-products of metabolism, with potential toxicity that must be controlled by enzymes that degrade them [Citation32].
FHIT alterations in cancer were first described in 1996 in gastric cancer [Citation33], lung cancer [Citation34], Merkel cell carcinoma [Citation35], breast cancer [Citation36], and head and neck squamous cell carcinomas [Citation37]. In these studies, deletions affecting several of FHIT coding exons were identified using RT – PCR and cDNA sequencing of tumor samples. These discoveries were first encountered with some controversy as the Vogelstein laboratory reported a lower percentage of FHIT-altered samples in a panel of colon cancer cell lines and xenografts [Citation38]. However, soon after, numerous independent groups reported findings supporting FHIT loss as a frequent cancer event in pancreatic cancer [Citation39], breast cancer [Citation40,Citation41], and head and neck cancer [Citation42], contributing to a solid foundation for FHIT deletion being a recurrent event in human cancer. However, whether FHIT loss is a driver event or a passenger event that does not impact tumor evolution is still an open question. One could speculate that the fragile nature of FHIT locus can translate into an elevated frequency of alterations, especially in cancers with high levels of replication stress and chromosomal instability, even if those alterations are not positively selected [Citation43]. FHIT Copy Number Alterations (CNAs) are approximately equally distributed in small hemizygous deletions and homozygous deletions [Citation43], suggesting its passenger role. In contrast, hemizygous deletions in CNAs affecting known recessive cancer genes, like NF1, PTEN, or CDKN2A, represent only a small proportion, with the majority being homozygous deletions [Citation43]. Likewise, in bona fide tumor suppressor genes, alternative inactivating mechanisms like point mutations usually occur in the retained allele, as another source of gene inactivation. Again, FHIT point mutations are scarce [Citation44].
On the other hand, two Fhit knockout mouse models showed increased tumorigenesis [Citation45–47], indicating a driver role of FHIT loss in cancer. Of note, both mouse models target exon 5 of the Fhit gene, which harbors the translation initiation codon (and hence abolish the expression of FHIT protein) but they do not mimic the partial or whole deletion of the FHIT locus observed in human cancer.
Besides, the transcription-replication conflict in the root of the locus fragility is highlighted by recent findings suggesting that the transcription of FHIT gene is required for the locus to be fragile since its silencing suppresses the occurrence of copy number alterations [Citation48].
Over the years, cumulative data from cancer genomics has increased the available information on FHIT status in cancer. In this article, we have systematically analyzed available information extracted from databases and a published meta-analysis of FHIT in cancer.
Results
FHIT is frequently altered in human cancer of esophagogastric and bowel origin
First, we analyzed the data available from different sources to get an insight into the frequency of FHIT alterations in human cancer. We analyzed FHIT alterations in whole exome sequences of 10,953 TCGA patients from the Cancer Genome Atlas Pan-Cancer project that includes 32 different cancer types [Citation49] using cBioportal [Citation50]. Three percent of the patients studied (279 patients out of 10,953) harbored FHIT alterations. These alterations include mutations, deep deletions (deep loss, possibly a homozygous deletion), amplifications (high-level amplification, more copies, often focal), and structural variations. The frequency of FHIT alterations was not equally distributed among cancers. Esophageal adenocarcinoma with 12.09% of samples harboring alteration in FHIT (9.89% being deep deletions) and stomach adenocarcinoma with 12.05% of samples harboring alterations in FHIT (10.68% being deep deletions) exhibit the highest frequencies. Next is colorectal adenocarcinoma with 7.07% of FHIT-altered samples (5.72% being deep deletions) ( and Supplementary Table 1). Mutations (including missense, truncating, or affecting splicing) and structural alterations are less common than copy number alterations.
Figure 2. (a) For each cancer type grouped by TCGA study, relative fractions of deep deletions, amplifications, mutations, multiple alterations, and structural variations are indicated. Only those studies where some samples harbor FHIT alterations are shown. TCGA abbreviations are esophageal carcinoma (ESCA), stomach adenocarcinoma (STAD), colorectal adenocarcinoma (COADREAD), uterine carcinosarcoma (UCS), bladder urothelial carcinoma (BLCA), skin cutaneous melanoma (SKCM), lung squamous cell carcinoma (LUSC), head and neck squamous cell carcinoma (HNSC), cervical squamous cell carcinoma and endocervical adenocarcinoma (CESC), sarcoma (SARC), kidney renal clear cell carcinoma (KIRC), prostate adenocarcinoma (PRAD), ovarian serous cystadenocarcinoma (OV), lymphoid neoplasm diffuse large B-cell lymphoma (DLBC), uterine corpus endometrial carcinoma (UCEC), mesothelioma (MESO), pancreatic adenocarcinoma (PAAD), liver hepatocellular carcinoma (LIHC), lung adenocarcinoma (LUAD), breast invasive carcinoma (BRCA), brain lower grade glioma (LGG), thymoma (THYM), testicular germ cell tumors (TGCT), thyroid carcinoma (THCA), pheochromocytoma and paraganglioma (PCPG), kidney renal papillary cell carcinoma (KIRP) and glioblastoma multiforme (GBM). (b) Schematic representation of point mutations in FHIT gene from TCGA pan-cancer studies. In green, missense mutations. In red, splice mutations. (c) FHIT copy number proportions including deep deletion, shallow deletion, diploid, gain and amplification are shown for 32 TCGA pan-cancer studies. The stacked proportion bar chart is sorted by increasing diploid fraction. (d) Segmented copy number data for combined studies (n = 10967), stomach adenocarcinoma (n = 440), esophageal adenocarcinoma (n = 182) and colorectal adenocarcinoma (n = 526) samples from cBioportal. Genomic regions surrounding FHIT locus is shown (chr3:57,472,814 –63,497,314). Red: CN gain. Blue = CN Loss.
Within cBioportal, a bigger cohort of patients can be explored, including studies that are not part of the Pan-Cancer Atlas Project. In a curated set of non-redundant studies (Supplementary Table 11), that includes 65,853 patients, FHIT was altered in 709 (1%) (Data by cancer study in Supplementary Table 2 and by Cancer Type in Supplementary Table 3). Again, we observed differences among tissues. FHIT is deep deleted in 12.72% of esophagogastric tumors and 4.94% of colorectal tumors. In contrast, its amplification is less frequent (0.90% in esophagogastric and 0.32% in colorectal). In both cases, the ratio of deep deletion/amplification is bigger than 10 (14.1 for esophagogastric and 15.4 for colorectal), suggesting that there may be a selective pressure for FHIT deletions.
COSMIC database, the Catalogue Of Somatic Mutations In Cancer (https://cancer.sanger.ac.uk) [Citation51] is another useful source of genomic data that includes mutations from 1.4 million tumor samples curated from TCGA, ICGC, and literature including over 26,000 publications. It includes coding mutations, non-coding mutations, gene fusions, copy number variants (CNV), and drug-resistance mutations. FHIT is included in the COSMIC Cancer Gene Census (CGC), as a tier 1 (a gene must possess a documented activity relevant to cancer) with impact in two cancer hallmarks: suppresses genome instability and mutations; and suppresses invasion and metastasis. Within COSMIC, esophagogastric tumors are again the ones harboring more frequently CNV alterations in FHIT, with 33.3% of tested samples harboring FHIT loss, and 9.92% of colorectal tumors. In this case, the ratio of Loss/Gain is greater than 25 for both esophagogastric and colorectal. In this database, cervix and urinary/bladder tumors rank second and third, with 19.9% and 11.4% of samples with FHIT loss respectively (Supplementary Table 4).
The differences in the frequencies of FHIT alterations obtained between cBioportal and COSMIC can be attributed to the different sources of genomic data used. While COSMIC contains data from TCGA, ICGC, and the literature, cBioportal includes cancer studies by AMC, BCCRC, BGI, British Columbia, Broad, Broad/Cornell, CCLE, CLCGP, Genentech, ICGC, JHU, Michigan, MKSCC, MKSCC/Broad, NCCS, NUS, PCGP, Pfizer UHK, Riken, Sanger, Singapore, TCGA, TSP, UTokyo, Yale [Citation52].
Overall, genomic data from both cBioportal and COSMIC show that FHIT alterations in cancer are more frequently copy number alterations than point mutations or structural alterations. Hence, we dived into a meta-analysis in which somatic copy number alterations were analyzed in Pan-Cancer dataset unified across all lineages [Citation53]. The authors described 70 regions or peaks recurrently amplified and 70 peaks recurrently deleted. A peak containing FHIT ranked 17th in the deleted peaks among all cancers. In addition, when focusing on specific tissues, the highest frequency of FHIT was found in colorectal cancer, where FHIT peak ranked 5th (after RBFOX1, FAM190A, PARK2, and MACROD2; and before WWOX). Of note, 22 of the 140 identified regions contained one of the 100 largest genes in the genome. Interestingly, they were not distributed symmetrically between deletions and amplifications. While 21 out of the 70 most significantly deleted peaks harbored long genes only 2 of the amplified top peaks did. Hence, the tendency of FHIT to get lost in cancer is not unique among long genes. In this same study, FHIT and ERBB2 CNAs were significantly anti-correlated (q value 0.021). The existence of significant correlations with FHIT CNAs may support a driver role of FHIT alteration.
While FHIT copy number alterations are frequent, point mutations in FHIT are scarce. In the curated set of non-redundant studies of cBioportal aforesaid only 84 samples out of 42,053 harbor FHIT point mutations. These are mostly missense mutations distributed along the gene without any hotspot of mutation clustering. In the TCGA Pan-Cancer study, there are 41 FHIT mutations described, showing the same pattern (). However, we should keep in mind that even though FHIT gene spans over 1.5Mb, the exons are quite short and code for a small 17KDa protein. Interestingly, López-Bigas laboratory has curated mutated genes in cancer using data from cBioPortal, pediatric cBioPortal, ICGC, TCGA, PCAWG, Hartwig Medical Foundation, TARGET, St. Jude, and literature gathered sequencing projects and seven methods accounting for mutation count bias, significant clustering of mutations and the functional impact bias of the observed mutations [Citation54]. In their database, Intogen.org, FHIT is indeed classified as a driver in Diffuse large B-cell lymphoma and Stomach Adenocarcinoma by the combination of the methods. This is especially relevant since the copy number alterations are not taken into consideration in this study. Hence, despite being rare, FHIT mutations may be significantly enriched in some cancers [Citation54].
FHIT is not frequently involved in translocations. Only 13 protein fusions involving FHIT were described in the Pan-Cancer Atlas across different cancers, without any observed enrichment (Supplementary Table 5). Out of the 13 fusions, 6 involved genes located, as FHIT, in chromosome 3, i.e., a FOXP1-FHIT fusion was found in a thymic epithelial tumor, while the other 7 involved genes from other chromosomes, like a RPAIN-FHIT fusion identified in a breast invasive ductal adenocarcinoma tumor.
FHIT is a hotspot for FRA3B CNAs
FHIT alteration in cancer is associated with the instability of its locus, located within the CFS FRA3B. Samples can be classified according to FHIT putative copy number alterations values from the algorithm GISTIC (Genomic Identification of Significant Targets in Cancer) [Citation55] available in cBioportal in diploid (0 = neutral/no change), deep deletion (−2 = homozygous deletion), shallow deletion (−1 = hemizygous deletion), gain (1 = low-level gain, a few additional copies, often broad), and amplification (2 = high-level amplification, more copies, often focal). The proportion of FHIT samples in each copy number category across the 32 TCGA Pan-Cancer studies is shown in (). Overall, 59% of the samples are diploid for FHIT, 1.75% have deep deletion of FHIT, 29.82% shallow deletion, 9.05% gain, and 0.38% high-level amplification. Shallow or hemizygous deletion is the most prominent copy number alteration and the ratio of Deep/Shallow deletions is 0.059. Across studies, lung squamous cell carcinoma (LUSC) has the lowest proportion of diploid samples, with the majority (84.19%) of the samples having shallow or hemizygous FHIT deletion. On the contrary, thyroid Carcinoma (THCA) has 98.39% of diploid samples. An increased proportion of homozygous or deep deletions is found in three cancer types: Stomach Adenocarcinoma (STAD) with 10.73% of samples with FHIT homozygous deletion and a ratio of Deep/Shallow deletions of 0.35, Colorectal Adenocarcinoma (COADREAD) with 5.74% of samples with homozygous FHIT deletion and a ratio of Deep/Shallow deletions of 0.33 and Esophageal Adenocarcinoma (ESCA) with 10.44% of samples with homozygous FHIT deletion and a ratio of Deep/Shallow deletions of 0.17. Representations of segmented copy number data show that FHIT gene is a hotspot within the FRA3B locus for CNA, with some alterations spanning the whole gene and others clustering between exons 1 and 3 (). The first coding exon of FHIT is exon 5, but it can be predicted that deletion of the first exons will affect the transcription and stability of FHIT mRNA.
FHIT expression and copy number alterations
Next, we compared the expression of FHIT in tumors and the corresponding normal tissue at http://firebrowse.org/ (). The biggest FHIT expression reduction in the tumor is found in sarcomas, head and neck squamous cell carcinoma, and esophageal carcinoma. In others like uterine corpus endometrial carcinoma (UCEC) and prostate adenocarcinoma (PRAD) there is increased expression in the tumor.
Figure 3. (a) RSEM mRNAseq FHIT expression profiles for normal tissues and tumors of the same tissue. The center line of the box represents the median, box ends represent respectively the first and third quartiles. Data from Firebrowse. (b) Distribution of FHIT copy number alterations across cancer types in relation with FHIT expression in normal tissue. Each TCGA pan-cancer study is represented as a single dot in the scatter plot. The horizontal axis represents the expression of FHIT in normal tissue from consensus dataset (nTPM) in Human Protein Atlas Database, and the vertical axis represents percentage of samples with copy number alterations in cancers originating from each tissue. From left to right, representation of percentage of samples with any copy number alteration, deep deletions, shallow deletions, gain or amplification. (c) Scatter plot between FHIT Log2 copy number (horizontal axis) and WWOX Log2 copy number (vertical axis) in different TCGA pan-cancer studies.
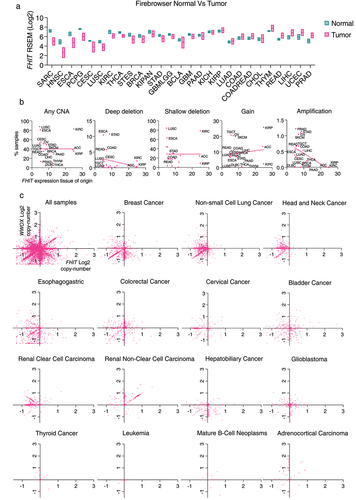
It has been previously reported that the fragility of the FHIT locus relies on its transcription [Citation48]. We hypothesized that if FHIT loss was a passenger event consequence of the inherent fragility of the site, FHIT copy number alterations would be more frequent in tumors that arise from tissues with the highest FHIT expression. To explore this possibility, we have analyzed the frequency of FHIT copy number alterations based on the Pan-Cancer TCGA studies and FHIT expression based on the consensus dataset from Human Protein Atlas. The matched tissue and cancer type can be found in Supplementary Table 6. First, we plotted in a scatter plot the relationship between FHIT expression, in the horizontal axis, and the percentage of samples that have any copy number alteration for FHIT for a given cancer type (). We observed no correlation between the data. Thus, higher expression of FHIT did not translate into a higher frequency of copy number alterations across cancer types. We also looked at the relationship between FHIT expression and specific FHIT copy number alterations (deep deletion, shallow deletion, gain, or amplification). Surprisingly, there was no significant correlation in deep deletions, shallow deletions, or gains. There was a significant anti-correlation between FHIT expression and the percentage of samples harboring amplifications (R squared 0.2693 and p-value 0.0191).
We have also compared the copy number value of FHIT with the copy number value of WWOX (WW Domain Containing Oxidoreductase), in the same samples. WWOX is a gene located within the CFS FRA16D. The copy number alterations in CFSs can be considered a signature of replication stress [Citation56,Citation57]. A representation of all the samples from the TCGA Pan-Cancer study in a scatter plot showing the Log2 of FHIT copy number value in the horizontal axis and the Log2 of WWOX copy number value in the vertical axis shows a cloud of dots with some clusters showing correlation of FHIT and WWOX copy number, others showing anti-correlation, and other values that show independency of the two events (). Interestingly, we identified different scenarios in specific cancer types. In breast and non-small cell lung cancer, a fraction of samples shows a high correlation between FHIT and WWOX loss. In addition, there is another fraction of samples in breast cancer that have lost WWOX without any copy number change in FHIT, and the opposite was found in non-small cell lung cancer. In esophagogastric, colorectal, cervical, and bladder cancer, there is no clustering of correlated samples. Renal clear cell carcinoma shows a peculiar pattern with many samples having FHIT copy number loss, with no change in WWOX. Contrary, many hepatobiliary cancer and glioblastoma samples have WWOX copy number loss, with no change in FHIT. Last, some cancer types have few copy number alterations for both WWOX and FHIT. The fact that FHIT and WWOX are frequently co-altered may reflect a general increase in CFS instability in some tumors due to high levels of replication stress. On the other hand, the fact that other cancer samples do not show this correlation may suggest a selective pressure for the loss of FHIT or WWOX in specific tumors or a different intrinsic fragility possibly related to the expression of the loci.
Tumors harboring FHIT CNAs are enriched in TP53 mutations and CNAs of other common fragile sites
We explored genomic alterations in cBioPortal relative to FHIT status. First, we searched for events enriched in those samples harboring FHIT copy number alterations in a curated set of non-redundant studies (213 studies, 69,223 samples and 65,853 patients). We found that TP53 is the most significantly enriched mutated gene in FHIT copy number altered tumor samples relative to FHIT copy number unaltered. The log ratio is 0.89 and the q-value is 2.80 × 10−40 with 65.59% of FHIT-altered samples harboring a mutation in TP53 in contrast to the 35.34% of TP53 mutant samples in the unaltered group (, Supplementary Table 7). Similar results were obtained in the TCGA Pan-Cancer data (10,967 samples), as TP53 is the most enriched mutated gene with 64.77% in FHIT copy number altered versus 36.80% in FHIT copy number unaltered, with a q-value of 1.20 × 10⁻¹⁰ (Supplementary Table 8).
Figure 4. (a) Genes with mutations significantly enriched in samples with FHIT harboring a copy number alteration in comparison with samples not having FHIT copy number alterations. Percentage of mutated samples in each group is shown per gene. Analysis performed in 65,853 patients from 213 studies (curated set of non-redundant studies by cBioportal; molecular profiles: copy number alterations). (b) Mutation count in tumor samples grouped by FHIT altered or non-altered in TCGA pan-cancer. (c) Percentage of FHIT altered samples in the TCGA pan cancer study divided by quartiles of mutation count. (d) Mutation count in tumor samples grouped by FHIT copy number status in different TCGA pan-cancer studies. (e) Tumor mutation burden (nonsynonymous mutations) in tumor samples grouped by FHIT copy number status in different TCGA studies.
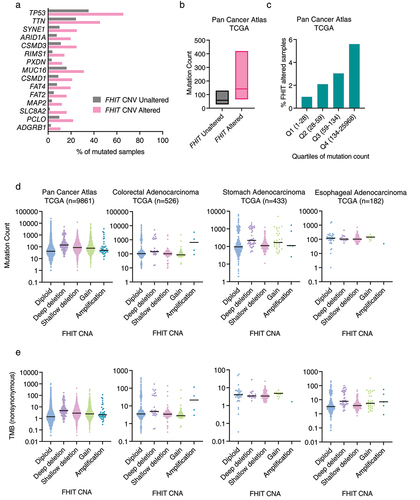
When focusing on the genes altered by CNA (rather than point mutation) enriched in FHIT-altered tumor samples relative to FHIT unaltered, the 38 most enriched genes are in the same cytoband as FHIT, 3p14, suggesting that they are altered due to copy number alterations that affect FHIT together with neighbor genes in cytoband 3p14 (like, for example, PTPRG, and CADPS which are the immediate neighbors downstream of FHIT) (Supplementary Table 9). Next, there are genes located in cytoband 3p13 (FOXP1 and MITF) and 3p21 (like PBRM1, BAP1, and CHDH). The 3p21 cytoband is not considered to be a fragile site. However, it has been described as a loss of heterozygosity region harboring potential tumor suppressor in lung cancer [Citation58]. If genes located in chromosome arm 3p are left out of consideration, the top CNA altered gene enriched in FHIT altered group is WWOX, located in cytoband 16q23.1-q23.2 (fragile site FRA16D). WWOX is with FHIT among the most studied genes located in fragile sites and lost in cancer [Citation2]. WWOX is altered in 34.05% of FHIT copy number altered samples and only in 3.52% of FHIT copy number unaltered ones (q-value 5.09 × 10−99). This enrichment points toward either a similar mechanism underlying the loss of both genes or a selective pressure favoring the co-occurrence of both events. However, as discussed in the previous section, some cancer types do not show a clear correlation in alterations of these two genes. Next on the list is CCSER1 (Coiled-Coil Serine Rich Protein 1), located in cytoband 4q22.1 (fragile site FRA4F) (23.85% versus 2.78%), ASXL1, located in cytoband 20q11.21 (22.88% versus 1.99%), MACROD2 (Mono-ADP Ribosylhydrolase 2), located in 20p12.1 (fragile site FRA20B) and several genes from the 20q11–13 including SRC (SRC Proto-Oncogene, Non-Receptor Tyrosine Kinase), TOP1 (DNA Topoisomerase I), and AURKA (Aurora Kinase A). Hence, among the most frequently co-deleted genes, we found an overrepresentation of genes located within CFSs. Similar results were found in the Pan-Cancer cohort (Supplementary Table 10).
FHIT CNAs correlate with increased tumor mutational burden
Tumor Mutational Burden (TMB) is a measure of the mutation count defined as the number of somatic mutations per megabase of a given tumor. This property varies across malignancies, for example, the highest levels of TMB are found in skin melanoma and lung small cell carcinoma (most likely explained by the exposure to the mutagenic sources UV light and tobacco respectively), while lower values correspond to tumors like thymus adenocarcinoma, testis cancer, thymoma, and chromophobe renal cell carcinoma [Citation59]. Lately, tumor mutational burden has been extensively discussed as a potential biomarker predictive of the outcome of immunotherapy [Citation59].
FHIT-altered samples have significantly increased mutation count compared to FHIT wildtype samples in the Pan-Cancer Atlas cohort (q-value <10−10) (). In addition, FHIT alterations are significantly enriched in the quartile with the highest mutation count (q-value <10−10) (). Although not significant, the highest mutation count is found in samples with FHIT deep deletion. The increase is significant in FHIT shallow deletion (where there is a higher number of samples) (). Moreover, this increase is not explained by a bias in the tumor type composition of the populations, since it is also present if only samples of stomach origin are considered (). However, there are no significant differences in tumors from esophageal and colorectal origin, when samples are clustered by copy number status.
FHIT CNAs correlate with increased microsatellite instability in colorectal cancer
Microsatellite Instability (MSI) is the molecular fingerprint consequence of a defective mismatch repair machinery [Citation60]. Approximately 15% of colorectal cancers (CRC) exhibit microsatellite instability. Most are sporadic CRC and the MSI is caused by hypermethylation of the MLH1 promoter, while 2–3% of all CRCs are caused by germline mutations in one of the mismatch repair genes (MLH1, MSH2, MSH6, and PMS2) [Citation60].
According to data from the Pan-Cancer project, tumors that have altered FHIT copy number, are enriched in microsatellite instable samples, assessed by the MSI MANTIS Score (). This enrichment is found in tumors with deep or homozygous deletion of FHIT, but not in those with shallow or hemizygous deletion. Samples that have an MSI MANTIS Score above 0.6 are considered MSI, a score below 0.4 corresponds to MSS (Microsatellite Stable Samples) and those between 0.4 and 0.6 are uncertain. Enrichment is also observed in those samples harboring FHIT amplification, especially in colorectal and stomach cancer.
Figure 5. (a) Percentage of samples with Microsatellite Instability I MANTIS score status determined as microsatellite stable (MSS), microsatellite instable (MSI) or unknown, sorted by FHIT copy number status in different TCGA pan-cancer studies. (b) Percentage of samples harboring mutations in genes known to induce MSI in FHIT altered and non-altered samples in colorectal adenocarcinoma (TCGA, Pan-Cancer atlas, 594 samples). (c) Methylation of the promoter of the MLH1 gene at the position cg00893636 in COADREAD samples grouped by FHIT copy number alteration. (d) Aneuploidy score in tumor samples grouped by FHIT copy number status in different TCGA studies. (e) Buffa Hypoxia score in the pan cancer atlas TCGA samples (left) or TCGA colorectal adenocarcinoma.
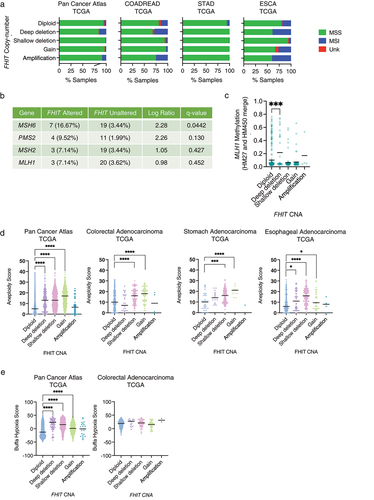
Mutations in MMR genes and MLH1 hypermethylation are sources of MSI. In the Pan-Cancer TCGA Colorectal adenocarcinoma cohort, there is a significant enrichment for MSH6 mutations in FHIT altered group in comparison to FHIT wildtype, and a non-significant enrichment for mutations in other MMR genes like PMS2, MSH2, and MLH1 (). In addition, there is a significant increase in the methylation levels around the MLH1 TSS in FHIT altered samples ().
FHIT alterations correlate with higher aneuploidy scores
Aneuploidy score accounts for the number of chromosome arms with arm-level copy number alterations in a sample and ranges from 0 to 39 [Citation61]. In the Pan-Cancer Atlas, samples with FHIT CNAs, including deep deletion, shallow deletion, and gain have significantly higher aneuploidy scores (). Similar results are obtained for esophageal and stomach adenocarcinoma. However, in colorectal adenocarcinoma, samples with FHIT deep deletion show lower, albeit non-significant, aneuploidy scores than the diploid ones. These results are similar to the obtained if comparing WWOX-altered colorectal samples with WWOX non-altered (aneuploidy score median of 2 in WWOX altered versus 12 in WWOX non-altered, q-Value <10−10). This is opposite to what is found when looking at TP53 altered samples in colorectal adenocarcinoma, in which case, the median aneuploidy score is significantly higher in TP53-altered than in TP53 non-altered (16 versus 8. q-Value <10−10).
FHIT CNA significantly correlates with hypoxia in cancer
According to cBioportal, FHIT CNA samples have higher Buffa hypoxia score (indicative of more hypoxia) than FHIT non-altered samples (). This tendency was also found in colorectal cancer samples, although non-significant when clustered by copy number status ().
FHIT silencing by DNA methylation
Epigenetic changes impact gene expression in cancer cells and frequently contribute to tumorigenesis. Indeed, hypermethylation of FHIT promoter has been described in many cancers, including Epstein–Barr virus-associated gastric carcinomas [Citation62], human papillomavirus positive oropharyngeal squamous cell carcinomas [Citation63], cervical carcinoma [Citation64], acute lymphoblastic leukemia [Citation65], clear cell renal carcinomas [Citation66], bladder cancer [Citation67], breast cancer [Citation68] and non-small cell lung cancer [Citation69,Citation70]. It has been reported that FHIT CpG island hypermethylation is the second hit event in FHIT inactivation together with loss-of-heterozygosity [Citation68,Citation70] in breast and non-small cell lung cancer.
Here, we have examined the hypermethylation of the CpG sites within a CpG island found in the promoter region of FHIT, which can be an alternative method of FHIT inactivation through transcriptional repression. First, we looked at the correlation between FHIT mRNA expression and the methylation level of different CpGs within the CpG island in its promoter region. Considering all the samples from the TCGA project, those samples with higher levels of methylation (particularly above 0.2 β-value) have lower FHIT expression. Values are shown for CpG positions cg19049316 () and cg24796403 (), and similar results are obtained for other CpGs within the region.
Figure 6. (a) Scatter plot and the simple linear regression trendline (blue) showing between FHIT mRNA expression (RSEM, batch normalized from Illumina HiSeq_RNASeqV2) (vertical axis) and the methylation of CpG position cg19049316 (β-value, HM27 and HM450 merge). (b) Scatter plot and the simple linear regression trendline (blue) showing between FHIT mRNA expression (RSEM, batch normalized from Illumina HiSeq_RNASeqV2) (vertical axis) and the methylation of CpG position cg24796403 (β-value, HM27 and HM450 merge). (c) Heatmap showing for each TCGA study the methylation change in tumor samples compared to matched normal tissue in the indicated CpG sites within the FHIT promoter CpG island, and the average change in the 8 CpG sites in the aggregated column. (d) Average methylation β-values of the 8 CpG probes within the FHIT promoter CpG island in matched normal (green) and tumor (magenta) samples from the indicated TCGA studies. The % of tumors with a β-value higher than 0.2 is indicated above.
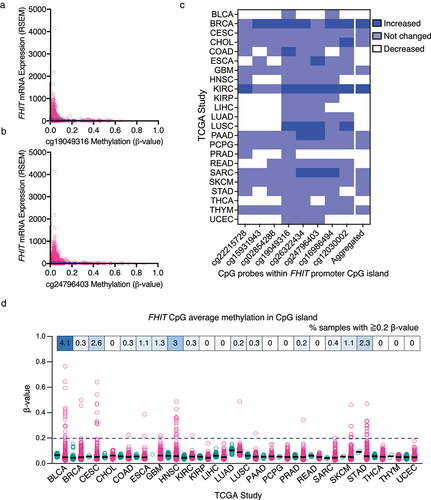
Next, we compared the methylation levels in matched normal and tumor samples from the TCGA project. We have used the DNA methylation data of TCGA evaluated by Illumina Human Methylation 450K BeadChip accessed through the SMART (Shiny Methylation Analysis Resource Tool) [Citation71] webpage. We included the methylation levels of 8 CpGs located within the CpG island found in the proximity of FHIT promoter in those studies that had available data for matched normal tissue. Some CpGs had significantly increased methylation in tumor samples relative to the matched normal tissue (shown in dark blue), while others remained similar (light blue) or significantly decreased (white) (). The aggregated data, where the average methylation across the 8 CpGs is analyzed, is included in the last column. Only breast cancer (BRCA) and kidney renal clear cell carcinoma (KIRC) show a significant overall increase in DNA methylation. However, other cancer types, such as lung squamous cell carcinoma (LUSC), pancreatic adenocarcinoma (PAAD), and sarcoma (SARC) show a significant DNA methylation increase in more than two CpG sites.
Within each study, there is a lot of heterogeneity among tumor samples. To get an overview of that, we have plotted the methylation levels of the individual tumor samples for each TCGA Study with available methylation data for matched normal and cancer samples (). The percentage of samples with 0.2 or higher β-value is indicated in the upper boxes. Bladder urothelial carcinoma (BLCA) with 4.1%, head and neck squamous cell carcinoma (HNSC) with 3%, and cervical squamous cell carcinoma and endocervical adenocarcinoma (CESC) with 2.6% are the ones with a higher proportion of samples showing methylation higher than 0.2. Combining all the cancer samples, 0.9% of the tumor samples have 0.2 or higher β-value of average methylation for the 8 CpGs studied. Overall, these data indicate that FHIT inactivation via DNA methylation of its promoter is less frequent than FHIT loss by genetic deletion, but it may have an important contribution in some tumors.
FHIT status does not impact prognosis
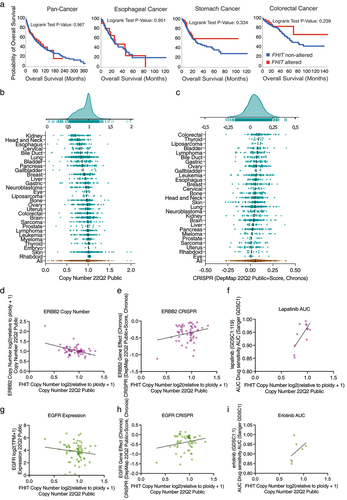
FHIT alterations have no impact on survival in the Pan-Cancer cohort (). Similarly, patients with FHIT alterations in esophageal, stomach, or colorectal cancer of the TCGA project have no differences in survival with those without FHIT alterations ().
Figure 7. (a) FHIT alterations do not impact overall survival. Representation of overall survival of patients with (red line) or without (blue line) alterations in FHIT. (b) FHIT copy number status in cancer cell lines. Each dot represents a cell line. Cell lines grouped by cell line tissue of origin. Data from genomic characterization data from the CCLE project. Area chart (top) summarizes all data. (c) CRISPR DepMap score for FHIT in cancer cell lines. Cell lines grouped by tissue of origin. Data from perturbation effect from the DepMap 22Q2 public chronos project. Area chart (top) summarizes all data. (d) Scatter plot showing ERBB2 copy number in the Y-axis and FHIT copy number in the X-axis. Each dot represents a colorectal adenocarcinoma cell line. Data from 22Q2 Public+Score (chronos) extracted from DepMap. (e) Scatter plot showing ERBB2 gene effect from DepMap 22Q2 Public+Score (chronos) in the Y-axis and FHIT copy number in the X-axis. Each dot represents a colorectal adenocarcinoma cell line. Data from depmap. (f) Scatter plot showing lapatinib area under the curve (AUC) sensitivity (Sanger GDSC1) in the Y-axis and FHIT copy number in the X-axis. Each dot represents a colorectal adenocarcinoma cell line. Data from DepMap. (g) Scatter plot showing EGFR expression in the Y-axis and FHIT copy number in the X-axis. Each dot represents a colorectal adenocarcinoma cell line. Data from 22Q2 Public+Score (chronos) extracted from DepMap. (h) Scatter plot showing EGFR gene effect from DepMap 22Q2 Public+Score (chronos) in the Y-axis and FHIT copy number in the X-axis. Each dot represents a colorectal adenocarcinoma cell line. Data from DepMap. (i) Scatter plot showing erlotinib area under the curve (AUC) sensitivity (Sanger GDSC1) in the Y-axis and FHIT copy number in the X-axis. Each dot represents a colorectal adenocarcinoma cell line. Data from Depmap.
FHIT status, consequences of FHIT depletion and drug sensitivity in cancer cell lines
The Cancer Dependency Map (DepMap) Project has profiled hundreds of cancer cell lines for genomic information as well as sensitivity to genetic (CRISPR/Cas9 and RNAi) and small molecule perturbations. First, the analysis of FHIT copy number in the panel of cell lines used in the DepMap project shows a tendency toward FHIT loss (). The lowest values correspond to cell lines of the kidney, head and neck, and esophagus, indicating that FHIT is more frequently lost in these cell lines.
Notably, the effect of FHIT depletion by CRISPR on the cell lines tends to give a proliferative advantage (), being the strongest effect in colorectal cancer.
Finally, we analyzed co-dependencies with FHIT copy number in colorectal adenocarcinoma. We manually curated correlations for which a similar observation was found with different approaches. First, FHIT absolute copy number is anticorrelated with ERBB2 absolute copy number (). Moreover, FHIT copy number also anticorrelated with the effect of ERBB2 depletion by CRISPR () and the sensitivity to Lapatinib, which is an ERBB2 inhibitor (). Similarly, FHIT copy number is anticorrelated with EGFR expression (). Furthermore, FHIT copy number is anticorrelated with the effect of EGFR depletion by CRISPR () and the sensitivity to Erlotinib, which is an EGFR inhibitor ().
Materials and methods
Study design
All data were sourced from publicly available databases.
Data
The following data was extracted from TCGA Pan-Cancer Atlas studies and also from a set of non-redundant studies as defined by cBioportal, as indicated in the text, from https://www.cbioportal.org/: mutation data, copy number data, mutation count, tumor mutational burden, MSI MANTIS score, MLH1 (cg00893636) methylation (HM27 and HM450 merge), aneuploidy score, Buffa hypoxia score, and overall survival were downloaded from cBioportal.
Expression analysis
Expression data for FHIT in normal and tumor samples was extracted from Firebrowse (http://firebrowse.org/). FHIT expression from tissues used in the scatter plot with FHIT copy number alterations was obtained from The Human Protein Atlas (https://www.proteinatlas.org/). We used the consensus dataset that consists of normalized expression (nTPM) levels created by combining the HPA and GTEx transcriptomics datasets using the HPA internal normalization pipeline.
Graphs representation and statistics
Dot blots and scatter plots were done with Prism Version 9.5.0 (525).
DNA methylation
DNA methylation data for FHIT in matched normal and tumor samples was extracted from the SMART (Shiny Methylation Analysis Resource Tool) [Citation71] http://www.bioinfo-zs.com/smartapp/ webpage. FHIT mRNA Expression (RSEM) and CpG methylation from tumors in the TCGA project and CpG methylation plotted in () were obtained from cBioportal.
DepMap
Copy Number values for FHIT were obtained from the 22Q2 Public dataset for all the cell lines used in the DepMap project grouped by type. CRISPR effect values were obtained from the DepMap 22Q2 Public + Score Chronos dataset.
Discussion
Since 1996, when alterations of FHIT in cancer were first described [Citation33], more than a thousand articles have been published about FHIT in cancer, many of them highlighting the high prevalence of its alterations, however, FHIT is not included as a cancer driver gene in most of the consensus lists [Citation44,Citation72,Citation73]. There is a need for a better understanding of FHIT contribution to cancer development. Here, we present a comprehensive analysis of FHIT status in cancer using several databases including cBioportal, COSMIC Database, Intogen, Firebrowse, and DepMap.
We have found that the frequency of FHIT alterations in cancer overall is low (3% in the Pan-Cancer Atlas study). However, it increases in cancers of the digestive system (esophagogastric and colorectal cancer). Alterations are mostly CNAs with a predominance of FHIT loss.
There are also point mutations affecting FHIT, as well as translocations, and even though not very frequent, they are significantly enriched in some cancer types.
Many important questions about FHIT in cancer remain unanswered, mainly whether its copy number alterations, frequently found in cancers, particularly those of the digestive tract, are driver or passenger events.
The high rate of hemizygous deletions of FHIT may point toward this alteration being a passenger event [Citation43], in contrast to the prevalence of homozygous deletions found in canonical tumor suppressor genes. Indeed, the high rate of FHIT hemizygous deletions may be due to the fragile nature of the locus, and only in those tumors where the loss of the gene gives a selective advantage, the loss of the second allele is selected. Interestingly, the frequency of homozygous deletions is enriched only in some cancer types, especially those arising from the gastrointestinal tract. Moreover, regarding some features, tumors with shallow deletion show similar properties to diploid and different to homozygously deleted ones, for instance in the MSI MANTIS score or the methylation of the MLH1 promoter in colorectal adenocarcinoma, where samples with FHIT homozygous deletion have increased MSI MANTIS score and MLH1 promoter methylation, while samples with hemizygous FHIT deletion show values similar to those in FHIT diploid.
It has been proposed that the fragility of the FHIT locus relies on the expression of FHIT gene [Citation48]. We could speculate, that the frequency of FHIT copy number alterations in cancer may match the expression levels of FHIT in the tissue of origin. We matched each tumor type to the expression levels of in the corresponding tissue according to the consensus dataset from Human Protein Atlas. A limitation of this approach is that it does ignore the heterogeneity of FHIT expression within the different cell types in a tissue. The lack of correlation between the proportion of FHIT alterations and its expression in the tissue of origin suggests that FHIT expression levels cannot explain FHIT fragility in cancer. These analyses also indicate how tumor types with the higher frequencies of homozygous deletions (esophagus, stomach, colorectal) do not correspond with the tissues with the highest expression levels (kidney or pancreas). We also compared FHIT CNAs with CNAs of WWOX, another gene located within a CFS frequently altered in cancer, to infer the overall CFS instability of the samples, which may reflect the levels of replication stress undertaken by the tumor cells during their evolution. For that, we plotted FHIT and WWOX copy number values for each sample within a tumor type. We found some cancer types that had interesting patterns. Breast cancer and non-small cell lung cancer have a large portion of samples with high correlation between FHIT and WWOX copy number status. In contrast, renal clear cell carcinoma has many samples with reduced FHIT copy number without changes in WWOX. This may indeed reflect the high expression levels of FHIT in kidney preferentially affecting FHIT fragility in comparison to other CFSs. For those tumor types where homozygous deletion of FHIT is more frequent, like those of the gastrointestinal tract, we observe samples that have reduced FHIT and/or reduced WWOX copy number, but the correlation between both is not clear. These data suggest that FHIT homozygous deletions in colorectal are not only explained by an overall increased CFS fragility but also may be selected because they provide a protumoral advantage. Of note, this hypothesis agrees with the proliferation advantage phenotype observed in the DepMap portal for colorectal cell lines depleted for FHIT with CRISPR/Cas9 ().
We have found that samples with FHIT CNAs are significantly enriched for TP53 mutations. It has been reported that the culture of mouse kidney Fhit KO cells led to the mutation of Trp53 [Citation74], suggesting that FHIT loss may promote TP53 mutations. However, an alternative explanation for this enrichment would be that TP53 mutant tumors have increased genomic instability or replication stress and this leads to FHIT loss. Further studies are required to determine whether FHIT and TP53 mutations cooperate in cancer development.
Furthermore, FHIT alterations correlate with increased tumor mutational burden across all cancers and, particularly, in colorectal cancer. Again, it is unclear if FHIT loss could be a cause or a consequence of the hypermutation status. This rise in the mutation burden may be due to the fact that samples with FHIT copy number alteration are enriched for point mutations in TP53, which inactivation leads to increased genomic instability. Alternatively, the association of FHIT alterations with increased tumor mutational burden opens the question of whether FHIT loss may induce the accumulation of mutations. This idea is in line with reports indicating that mouse tissues deficient for FHIT have an increased number of small insertions, deletions, and point mutations [Citation74,Citation75]. Moreover, FHIT loss has been proposed as the cause of a specific mutational signature [Citation76]. The proposed mechanism is that in the absence of FHIT, Thymidine kinase 1 protein levels are reduced and lead to a nucleotide imbalance that causes replication stress and increased mutagenesis [Citation77].
On the other hand, FHIT copy number alterations are correlated with increased microsatellite instability in colorectal cancer. In line with this observation, there is previous evidence in the literature indicating that in human gastric [Citation78] and human colorectal [Citation79,Citation80] cancer, FHIT loss is associated with MSI. Whether microsatellite instability is the cause or consequence of FHIT loss, if they are both consequences of a common cause, or if one of the events is positively selected in the presence of the other one, is not known. Of note, it has been suggested that defective MMR, which generates MSI, can also cause deletions affecting genes in CFSs [Citation81,Citation82].
Aneuploidy is another manifestation of genomic instability. FHIT CNAs correlate with decreased aneuploidy. In contrast to this observation, normal kidney cells established from Fhit KO mice displayed an increase in aneuploidy [Citation77]. Of note, it has been described that mutational burden and aneuploidy are positively correlated in tumors without microsatellite instability. On the other hand, in tumors with high MSI, like colon adenocarcinoma, the mutation rate is inversely correlated to aneuploidy. Remarkably, within colorectal adenocarcinoma, FHIT-altered samples have higher MSI and higher mutation burden than FHIT non-altered, which agrees with the lower aneuploidy [Citation61]. Whether FHIT loss is the cause or consequence of the high MSI, high mutation count, and low aneuploidy is not understood yet.
FHIT-altered tumors show increased hypoxia. Hypoxia significantly associates with increased genomic instability in some cancers [Citation83], which may suggest that hypoxia can induce genomic instability leading to FHIT alterations. However, we did not find an association in colorectal adenocarcinoma, indicating that other factors should account for the fragility detected in this cancer.
The hypermethylation of the FHIT promoter is an epigenetic mechanism that can lead to FHIT silencing. Although not a frequent event, it can play a role in FHIT inactivation in some cancers, either by itself or in combination with the deletion of the other allele.
The effect of FHIT depletion by CRISPR/Cas9 in a panel of cancer cell lines was analyzed in DepMap. The Cancer Dependency Map project aims to identify dependencies, essential genes, in cancer cell lines, specifically to identify those genes that, when targeted, reduce viability and or proliferation of the cells. Interestingly, FHIT depletion leads to an overall increase in proliferation or viability of the cancer cell lines, which is more evident in colorectal cancer cell lines. A similar result is found for canonical tumor suppressor genes like TP53 or PTEN.
Interestingly, two different unbiased analyses connected FHIT and ERBB2. On the one hand, FHIT and ERBB2 CNAs were significantly anticorrelated in a study using copy number data from the Pan-Cancer atlas project [Citation53]. On the other hand, the same observation was found in DepMap where cancer cell lines are used. Moreover, this association had been described before in the literature, as a FHITlow, phospho-ERBB2high signature has been reported to be predictive of anti-ERBB2 (irbinitinib and trastuzumab) efficacy in non-small cell lung cancer [Citation84]. Neither irbinitinib nor trastuzumab sensitivity is included in the DepMap data. In addition, EGFR activation induces FHIT protein degradation by the proteasome in different human cell lines [Citation85] adding complexity to their relationship.
In conclusion, we have identified that FHIT homozygous deletions are particularly frequent in esophageal, stomach, and colorectal cancers. This fragility is not distinctly related to FHIT expression or general CFS instability, which may point to a driver, or, at least, modulator effect of FHIT loss in these cancers. Moreover, we have identified correlations between FHIT alterations and relevant cancer features such as mutation burden, MSI, aneuploidy, and hypoxia. This article provides a panoramic view of FHIT status in cancer, which should help to design future studies and develop novel diagnostic and therapeutic tools based on FHIT status in cancer.
Author contributions
L.S.-C. and A.J.L.-C. designed the study. L.S.-C. and E.P. analyzed the data and prepared the figures. L.S.-C., A.J.L.-C. and E.P. wrote the manuscript. All authors read and approved the final manuscript.
Additional information
Correspondence should be addressed to L.S.-C. or A.J.L.-C.
Supplemental Material
Download MS Excel (4.9 MB)Disclosure statement
No potential conflict of interest was reported by the author(s).
Supplementary material
Supplemental data for this article can be accessed online at https://doi.org/10.1080/15384101.2024.2304509
Additional information
Funding
References
- Hanahan D, Weinberg RA. Hallmarks of cancer: the next generation. Cell. 2011;144(5):646–674. doi: 10.1016/j.cell.2011.02.013
- Glover TW, Wilson TE, Arlt MF. Fragile sites in cancer: more than meets the eye. Nat Rev Cancer. 2017;17(8):489–501. doi: 10.1038/nrc.2017.52
- Pekarsky Y, Garrison PN, Palamarchuk A, et al. Fhit is a physiological target of the protein kinase Src. Proc Natl Acad Sci. 2004;101(11):3775–3779. doi: 10.1073/pnas.0400481101
- Nishizaki M, Sasaki J-I, Fang B, et al. Synergistic tumor suppression by coexpression of FHIT and p53 coincides with FHIT-Mediated MDM2 inactivation and p53 stabilization in human non-small cell lung cancer cells. Cancer Res. 2004;64(16):5745–5752. doi: 10.1158/0008-5472.CAN-04-0195
- Rimessi A, Marchi S, Fotino C, et al. Intramitochondrial calcium regulation by the FHIT gene product sensitizes to apoptosis. Proc Natl Acad Sci. 2009;106(31):12753–12758. doi: 10.1073/pnas.0906484106
- Brenner CH. Hint, Fhit, and GalT: function, structure, evolution, and mechanism of three branches of the histidine triad superfamily of nucleotide hydrolases and transferases. Biochemistry. 2002;41(29):9003–9014. doi: 10.1021/bi025942q
- Pace HC, Garrison PN, Robinson AK, et al. Genetic, biochemical, and crystallographic characterization of fhit–substrate complexes as the active signaling form of fhit. Proc Natl Acad Sci. 1998;95(10):5484–5489. doi: 10.1073/pnas.95.10.5484
- Lima CD, Klein MG, Hendrickson WA. Structure-based analysis of catalysis and substrate definition in the HIT protein family. Science. 1997;278(5336):286–290. doi: 10.1126/science.278.5336.286
- Barnes LD, Fhit, a Putative Tumor Suppressor in Humans, Is a Dinucleoside 5',5' ''-P 1,P 3 -Triphosphate Hydrolase. Biochemistry. 1996;35(36):11529–11535. doi: 10.1021/bi961415t
- Draganescu A, Hodawadekar SC, Gee KR, et al. Fhit-nucleotide specificity probed with novel fluorescent and fluorogenic substrates. J Biol Chem. 2000;275(7):4555–4560. doi: 10.1074/jbc.275.7.4555
- Brenner C, Pace HC, Garrison PN, et al. Purification and crystallization of complexes modeling the active state of the fragile histidine triad protein. Protein Eng Des Sel. 1997;10(12):1461–1463. doi: 10.1093/protein/10.12.1461
- Guranowski A, Wojdyła AM, Pietrowska-Borek M, et al. Fhit proteins can also recognize substrates other than dinucleoside polyphosphates. FEBS Lett. 2008;582(20):3152–3158. doi: 10.1016/j.febslet.2008.07.060
- Wojdyła-Mamoń AM, Guranowski A. Adenylylsulfate–ammonia adenylyltransferase activity is another inherent property of fhit proteins. Biosci Rep. 2015;35(4):e00235. doi: 10.1042/BSR20150135
- Zamecnik PG, Stephenson ML, Janeway CM, et al. Enzymatic synthesis of diadenosine tetraphosphate and diadenosine triphosphate with a purified lysyl-sRNA synthetase. Biochem Biophys Res Commun. 1966;24(1):91–97. doi: 10.1016/0006-291X(66)90415-3
- Goerlich O, Foeckler R, Holler E. Mechanism of synthesis of Adenosine(5’)tetraphospho(5’)adenosine (AppppA) by Aminoacyl-tRNA Synthetases. Eur J Biochem. 1982;126(1):135–142. doi: 10.1111/j.1432-1033.1982.tb06757.x
- Brevet A, Chen J, Lévêque F, et al. In vivo synthesis of adenylylated bis(5’-nucleosidyl) tetraphosphates (Ap4N) by Escherichia coli aminoacyl-tRNA synthetases. Proc Natl Acad Sci. 1989;86(21):8275–8279. doi: 10.1073/pnas.86.21.8275
- Merkulova T, Kovaleva G, Kisselev LP. P1 , P3 -bis(5’-adenosyl)triphosphate (ap 3 A) as a substrate and a product of mammalian tryptophanyl-tRNA synthetase. FEBS Lett. 1994;350(2–3):287–290. doi: 10.1016/0014-5793(94)00764-0
- Flores NA, Stavrou BM, Sheridan DJ. The effects of diadenosine polyphosphates on the cardiovascular system. Cardiovasc Res. 1999;42(1):15–26. doi: 10.1016/S0008-6363(99)00004-8
- Verspohl EJ, Johannwille B. Diadenosine polyphosphates in insulin-secreting cells: interaction with specific receptors and degradation. Diabetes. 1998;47(11):1727–1734. doi: 10.2337/diabetes.47.11.1727
- Luthje J, Ogilvie A. Catabolism of Ap3A and Ap4A in human plasma. Purification and characterization of a glycoprotein complex with 5’-nucleotide phosphodiesterase activity. Eur J Biochem. 1985;149(1):119–127. doi: 10.1111/j.1432-1033.1985.tb08901.x
- Rubino A, Burnstock G. Possible role of diadenosine polyphosphates as modulators of cardiac sensory-motor neurotransmission in guinea-pigs. J Physiol. 1996;495(2):515–523. doi: 10.1113/jphysiol.1996.sp021611
- Vartanian A, Alexandrov I, Prudowski I, et al. Ap 4 A induces apoptosis in human cultured cells. FEBS Lett. 1999;456(1):175–180. doi: 10.1016/S0014-5793(99)00956-4
- Fisher DI, McLennan AG. Correlation of intracellular diadenosine triphosphate (Ap3A) with apoptosis in fhit-positive HEK293 cells. Cancer Lett. 2008;259(2):186–191. doi: 10.1016/j.canlet.2007.10.007
- Siprashvili Z, Sozzi G, Barnes LD, et al. Replacement of fhit in cancer cells suppresses tumorigenicity. Proc Natl Acad Sci. 1997;94(25):13771–13776. doi: 10.1073/pnas.94.25.13771
- Roz L, Gramegna M, Ishii H, et al. Restoration of fragile histidine triad (FHIT) expression induces apoptosis and suppresses tumorigenicity in lung and cervical cancer cell lines. Proc Natl Acad Sci. 2002;99(6):3615–3620. doi: 10.1073/pnas.062030799
- Trapasso F, Krakowiak A, Cesari R, et al. Designed FHIT alleles establish that fhit-induced apoptosis in cancer cells is limited by substrate binding. Proc Natl Acad Sci. 2003;100(4):1592–1597. doi: 10.1073/pnas.0437915100
- Herzog D, Jansen J, Mißun M, et al. Chemical proteomics of the tumor suppressor fhit covalently bound to the cofactor Ap3 a elucidates its inhibitory action on translation. J Am Chem Soc. 2022;144(19):8613–8623. doi: 10.1021/jacs.2c00815
- Lee PC, Bochner BR, Ames BN. AppppA, heat-shock stress, and cell oxidation. Proc Natl Acad Sci. 1983;80(24):7496–7500. doi: 10.1073/pnas.80.24.7496
- Baker JC, Jacobson MK. Alteration of adenyl dinucleotide metabolism by environmental stress. Proc Natl Acad Sci. 1986;83(8):2350–2352. doi: 10.1073/pnas.83.8.2350
- Krüger L, Albrecht CJ, Schammann HK, et al. Chemical proteomic profiling reveals protein interactors of the alarmones diadenosine triphosphate and tetraphosphate. Nat Commun. 2021;12(1):5808. doi: 10.1038/s41467-021-26075-4
- Albrecht CJ, Stumpf FM, Krüger L, et al. Chemical proteomics reveals interactors of the alarmone diadenosine triphosphate in the cancer cell line H1299†. J Pept Sci. 2023;29(3). doi: 10.1002/psc.3458
- McLennan AG. Dinucleoside polyphosphates—friend or foe? Pharmacol Ther. 2000;87(2–3):73–89. doi: 10.1016/S0163-7258(00)00041-3
- Ohta M, Inoue, H., Cotticelli, M. G.,The FHIT gene, spanning the chromosome 3p14.2 fragile site and Renal Carcinoma–associated t(3;8) breakpoint, is abnormal in digestive tract cancers. Cell. 1996;84(4):587–597. doi: 10.1016/S0092-8674(00)81034-X
- Sozzi G, Veronese ML, Negrini M, et al. The FHIT gene at 3p14.2 is abnormal in lung cancer. Cell. 1996;85(1):17–26. doi: 10.1016/S0092-8674(00)81078-8
- Sozzi G, Alder, H., Tornielli, S,Aberrant FHIT transcripts in Merkel cell carcinoma. Cancer Res. 1996;56(11):2472–2474.
- Negrini M, Monaco, C, Vorechovsky, I. The FHIT gene at 3p14.2 is abnormal in breast carcinomas. Cancer Res. 1996;56(14):3173–3179.
- Virgilio L, Shuster M, Gollin SM, et al. FHIT gene alterations in head and neck squamous cell carcinomas. Proc Natl Acad Sci. 1996;93(18):9770–9775. doi: 10.1073/pnas.93.18.9770
- Thiagalingam S, Lisitsyn, NA, Hamaguchi, M. Evaluation of the FHIT gene in colorectal cancers. Cancer Res. 1996;56(13):2936–2939.
- Shridhar R, Shridhar V, Wang X. Frequent breakpoints in the 3p14.2 fragile site, FRA3B, in pancreatic tumors. Cancer Res. 1996;56(19):4347–4350.
- Man S, Ellis IO, Sibbering M, et al. High levels of allele loss at the FHIT and ATM genes in non-comedo ductal carcinoma in situ and grade I tubular invasive breast cancers. Cancer Res. 1996;56(23):5484–5489.
- Panagopoulos I, Pandis, N, Thelin, S. The FHIT and PTPRG genes are deleted in benign proliferative breast disease associated with familial breast cancer and cytogenetic rearrangements of chromosome band 3p14. Cancer Res. 1996;56(21):4871–4875.
- Mao L, Fan YH, Lotan R, et al. Frequent abnormalities of FHIT, a candidate tumor suppressor gene, in head and neck cancer cell lines. Cancer Res. 1996;56(22):5128–5131.
- Bignell GR, Greenman CD, Davies H, et al. Signatures of mutation and selection in the cancer genome. Nature. 2010;463(7283):893–898. doi: 10.1038/nature08768
- Futreal PA, Coin L, Marshall M, et al. A census of human cancer genes. Nat Rev Cancer. 2004;4(3):177–183. doi: 10.1038/nrc1299
- Fong LYY, Fidanza V, Zanesi N. Muir–Torre-like syndrome in Fhit-deficient mice. Proc Natl Acad Sci. 2000;97(9):4742–4747. doi: 10.1073/pnas.080063497
- Zanesi N, Fidanza V, Fong LY, et al. The tumor spectrum in FHIT-deficient mice. Proc Natl Acad Sci. 2001;98(18):10250–10255. doi: 10.1073/pnas.191345898
- Fujishita T, Doi Y, Sonoshita M, et al. Development of spontaneous tumours and intestinal lesions in fhit gene knockout mice. Br J Cancer. 2004;91(8):1571–1574. doi: 10.1038/sj.bjc.6602182
- Park SH, Bennett-Baker, P., Ahmed, S., Locus-specific transcription silencing at the FHIT gene suppresses replication stress-induced copy number variant formation and associated replication delay. Nucleic Acids Res. 2021;49(13):7507–7524. doi: 10.1093/nar/gkab559
- Weinstein JN, Collisson EA, Mills GB, et al. The cancer genome atlas pan-cancer analysis project. Nat Genet. 2013;45(10):1113–1120. doi: 10.1038/ng.2764
- Cerami E, Gao J, Dogrusoz U, et al. The cBio cancer genomics portal: an open platform for exploring multidimensional cancer genomics data. Cancer Discov. 2012;2(5):401–404. doi: 10.1158/2159-8290.CD-12-0095
- Tate JG, Bamford S, Jubb HC, et al. COSMIC: the catalogue of somatic mutations in cancer. Nucleic Acids Res. 2019;47(D1):D941–D947. doi: 10.1093/nar/gky1015
- Klonowska K, Czubak K, Wojciechowska M, et al. Oncogenomic portals for the visualization and analysis of genome-wide cancer data. Oncotarget. 2016;7(1):176–192. doi: 10.18632/oncotarget.6128
- Zack TI, Schumacher SE, Carter SL, et al. Pan-cancer patterns of somatic copy number alteration. Nat Genet. 2013;45(10):1134–1140. doi: 10.1038/ng.2760
- Martínez-Jiménez F, Muiños F, Sentís I, et al. A compendium of mutational cancer driver genes. Nat Rev Cancer. 2020;20(10):555–572. doi: 10.1038/s41568-020-0290-x
- Beroukhim R, Getz G, Nghiemphu L, et al. Assessing the significance of chromosomal aberrations in cancer: methodology and application to glioma. Proc Natl Acad Sci. 2007;104(50):20007–20012. doi: 10.1073/pnas.0710052104
- Durkin SG, Glover TW. Chromosome fragile sites. Ann Rev Genet. 2007;41(1):169–192. doi: 10.1146/annurev.genet.41.042007.165900
- Tsantoulis PK, Kotsinas A, Sfikakis PP, et al. Oncogene-induced replication stress preferentially targets common fragile sites in preneoplastic lesions. A genome-wide study. Oncogene. 2008;27(23):3256–3264. doi: 10.1038/sj.onc.1210989
- Marsit CJ. Loss of heterozygosity of chromosome 3p21 is associated with mutant TP53 and Better Patient Survival in non–small-Cell lung cancer. Cancer Res. 2004;64(23):8702–8707. doi: 10.1158/0008-5472.CAN-04-2558
- Sha D, Jin Z, Budczies J, et al. Tumor mutational burden as a predictive biomarker in solid tumors. Cancer Discov. 2020;10(12):1808–1825. doi: 10.1158/2159-8290.CD-20-0522
- Vilar E, Gruber SB. Microsatellite instability in colorectal cancer—the stable evidence. Nat Rev Clin Oncol. 2010;7(3):153–162. doi: 10.1038/nrclinonc.2009.237
- Taylor AM, Shih J, Ha G, et al. Genomic and functional approaches to understanding cancer aneuploidy. Cancer Cell. 2018;33(4):676–689.e3. doi: 10.1016/j.ccell.2018.03.007
- He D, Zhang Y-W, Zhang N-N, et al. Aberrant gene promoter methylation of p16, FHIT, CRBP1, WWOX, and DLC-1 in Epstein–barr virus-associated gastric carcinomas. Med Oncol. 2015;32(4):92. doi: 10.1007/s12032-015-0525-y
- Inokawa Y, Hayashi M, Begum S, et al. High-risk HPV infection-associated hypermethylated genes in oropharyngeal squamous cell carcinomas. BMC Cancer. 2022;22(1):1146. doi: 10.1186/s12885-022-10227-w
- Ki K-D, Lee S-K, Tong S-Y, et al. Role of 5’-CpG island hypermethylation of the FHIT gene in cervical carcinoma. J Gynecol Oncol. 2008;19(2):117. doi: 10.3802/jgo.2008.19.2.117
- Yang Y, Takeuchi S, Hofmann WK, et al. Aberrant methylation in promoter-associated CpG islands of multiple genes in acute lymphoblastic leukemia. Leuk Res. 2006;30(1):98–102. doi: 10.1016/j.leukres.2005.06.002
- Kvasha S, Gordiyuk V, Kondratov A, et al. Hypermethylation of the 5’CpG island of the FHIT gene in clear cell renal carcinomas. Cancer Lett. 2008;265(2):250–257. doi: 10.1016/j.canlet.2008.02.036
- Maruyama R, Toyooka S, Toyooka KO., Aberrant promoter methylation profile of bladder cancer and its relationship to clinicopathological features. Cancer Res. 2001;61(24):8659–8663.
- Yang Q, Nakamura M, Nakamura Y. Two-hit inactivation of FHIT by loss of heterozygosity and hypermethylation in breast cancer. Clin Cancer Res Off J Am Assoc Cancer Res. 2002;8:2890–2893.
- Kim JS, Kim JW, Han J, et al. Cohypermethylation of p16 and FHIT promoters as a prognostic factor of recurrence in surgically resected stage I non–small cell lung cancer. Cancer Res. 2006;66(8):4049–4054. doi: 10.1158/0008-5472.CAN-05-3813
- Wali A, Srinivasan R, Shabnam MS, et al. Loss of fragile histidine triad gene expression in advanced lung cancer is consequent to allelic loss at 3p14 locus and promoter methylation. Mol Cancer Res. 2006;4(2):93–99. doi: 10.1158/1541-7786.MCR-05-0070
- Li Y, Ge D, Lu C. The SMART app: an interactive web application for comprehensive DNA methylation analysis and visualization. Epigenet Chromatin. 2019;12(1):71. doi: 10.1186/s13072-019-0316-3
- Vogelstein B, Papadopoulos N, Velculescu VE, et al. Cancer genome landscapes. Science. 2013;339(6127):1546–1558. doi: 10.1126/science.1235122
- Bailey MH, Tokheim C, Porta-Pardo E, et al. Comprehensive characterization of cancer Driver genes and mutations. Cell. 2018;173(2):371–385.e18. doi: 10.1016/j.cell.2018.02.060
- Miuma S, Saldivar JC, Karras JR, et al. Fhit deficiency-induced global genome instability promotes mutation and clonal expansion. PLoS One. 2013;8(11):e80730. doi: 10.1371/journal.pone.0080730
- Paisie CA, Schrock, M. S., Karras, J. R., Exome‐wide single‐base substitutions in tissues and derived cell lines of the constitutive fhit knockout mouse. Cancer Sci. 2016;107(4):528–535. doi: 10.1111/cas.12887
- Volinia S, Druck T, Paisie CA, et al. The ubiquitous ‘cancer mutational signature’ 5 occurs specifically in cancers with deleted FHIT alleles. Oncotarget. 2017;8(60):102199–102211. doi: 10.18632/oncotarget.22321
- Saldivar JC, Miuma S, Bene J, et al. Initiation of genome instability and preneoplastic processes through loss of fhit expression. PLoS Genet. 2012;8(11):e1003077. doi: 10.1371/journal.pgen.1003077
- Huiping C, Kristjansdottir S, Bergthorsson JT, et al. High frequency of LOH, MSI and abnormal expression of FHIT in gastric cancer. Eur J Cancer. 2002;38(5):728–735. doi: 10.1016/S0959-8049(01)00432-4
- Andachi H, Yashima K, Koda M, et al. Reduced fhit expression is associated with mismatch repair deficiency in human advanced colorectal carcinoma. Br J Cancer. 2002;87(4):441–445. doi: 10.1038/sj.bjc.6600501
- Sarli L, Bottarelli L, Azzoni C, et al. Abnormal fhit protein expression and high frequency of microsatellite instability in sporadic colorectal cancer. Eur J Cancer. 2004;40(10):1581–1588. doi: 10.1016/j.ejca.2004.02.021
- Vernole P, Muzi A, Volpi A, et al. Common fragile sites in colon cancer cell lines: role of mismatch repair, RAD51 and poly(ADP-ribose) polymerase-1. Mutat Res Mol Mech Mutagen. 2011;712(1–2):40–48. doi: 10.1016/j.mrfmmm.2011.04.006
- Jahid S, Sun J, Gelincik O, et al. Inhibition of colorectal cancer genomic copy number alterations and chromosomal fragile site tumor suppressor FHIT and WWOX deletions by DNA mismatch repair. Oncotarget. 2017;8(42):71574–71586. doi: 10.18632/oncotarget.17776
- Bhandari V, Hoey C, Liu LY, et al. Molecular landmarks of tumor hypoxia across cancer types. Nat Genet. 2019;51(2):308–318. doi: 10.1038/s41588-018-0318-2
- Da Silva J, Jouida A, Ancel J. FHIT low / pHER2 high signature in non-small cell lung cancer is predictive of anti-HER2 molecule efficacy. J Pathol. 2020;251(2):187–199. doi: 10.1002/path.5439
- Bianchi F, Magnifico A, Olgiati C, et al. FHIT-proteasome degradation caused by mitogenic stimulation of the EGF receptor family in cancer cells. Proc Natl Acad Sci. 2006;103(50):18981–18986. doi: 10.1073/pnas.0605821103