
ABSTRACT
Our previous findings confirmed the high enrichment of Bacteroides fragilis (BF) in fecal samples from patients with colorectal cancer (CRC). The intestinal mucosal barrier is the first defense of the organism against commensal flora and intestinal pathogens and is closely associated with the occurrence and development of CRC. Therefore, this study aimed to investigate the molecular mechanisms through which BF mediates intestinal barrier injury and CRC progression. SW480 cells and a Caco2 intestinal barrier model were treated with entero-toxigenic BF (ETBF), its enterotoxin (B. fragilis toxin, BFT), and non-toxigenic BF (NTBF). Cell counting kit-8, flow cytometry, wound healing and transwell assays were performed to analyze the proliferation, apoptosis, migration, and invasion of SW480 cells. Transmission electron microscopy, FITC-dextran, and transepithelial electrical resistance (TEER) were used to analyze damage in the Caco2 intestinal barrier model. The Azoxymethane/Dextran Sulfate Sodium (AOM/DSS) animal model was established to evaluate the effect of ETBF on intestinal barrier injury and CRC progression in vivo. ETBF and BFT enhanced the viability, wound healing ratio, invasion, and EMT of SW480 cells. In addition, ETBF and BFT disrupted the tight junctions and villus structure in the intestinal barrier model, resulting in increased permeability and reduced TEER. Similarly, the expression of intestinal barrier-related proteins (MUC2, Occludin and Zo-1) was restricted by ETBF and BFT. Interestingly, the STAT3/ZEB2 axis was activated by ETBF and BFT, and treatment with Brevilin A (a STAT3 inhibitor) or knockdown of ZEB2 limited the promotional effect of ETBF and BFT on the SW480 malignant phenotype. In vivo experiments also confirmed that ETBF colonization accelerated tumor load, carcinogenesis, and intestinal mucosal barrier damage in the colorectum of the AOM/DSS animal model, and that treatment with Brevilin A alleviated these processes. ETBF-secreted BFT accelerated intestinal barrier damage and CRC by activating the STAT3/ZEB2 axis. Our findings provide new insights and perspectives for the application of ETBF in CRC treatment.
1. Introduction
Colorectal cancer (CRC) is the third most common malignancy worldwide, usually originating in the mucosal layer of the colon and rectum, invading deeper tissues, and spreading to other organs, such as the lungs, liver, and peritoneum, over time [Citation1]. As a disease of the intestinal tract, damage to the intestinal barrier plays an important role in the progression of CRC. The intestinal barrier is a physical barrier consisting of tight junctions between cells on the surface of the intestinal mucosa that prevents the invasion of external toxins, microorganisms, and other harmful substances into the intestine [Citation2]. When the intestinal barrier is damaged, harmful external substances and bacteria can enter the body through the intestinal wall, leading to metabolic disorders that accelerate the formation and development of CRC [Citation2,Citation3]. Furthermore, the intestinal mucosal barrier plays an important role in tumor immunosurveillance by facilitating the recognition and clearance of CRC cells by the autoimmune system. Disruption of barrier function can lead to uncontrolled autoimmunity or immune tolerance, allowing CRC cells to escape immunosurveillance and increase the risk of their development and spread [Citation2,Citation4]. Therefore, exploring the mechanisms that regulate the integrity and function of the intestinal barrier is essential to prevent the occurrence and progression of CRC.
In recent years, an increasing number of studies have suggested that intestinal microbial “cross-border communication” plays a crucial role in intestinal mucosal barrier function and CRC [Citation5,Citation6]. Fusobacterium nucleatum, Escherichia coli, inflammatory Enterobacteriaceae, and Streptococcus gallolyticus are well-studied intestinal microorganisms, that contribute to CRC development by mediating reactive oxygen species (ROS), DNA damage, inflammatory responses, and immune responses [Citation7,Citation8]. Understanding the microbiome characteristics and individual microbial profiles may support the individualized treatment of patients with CRC. With the development of microbiomics, complex interactions between the host and its microbiota have been increasingly revealed [Citation9,Citation10]. Notably, our previous research on 52 patients with CRC and 55 healthy controls using metagenomic sequencing showed a significant increase in Bacteroides fragilis (BF) in patients with CRC [Citation11]. BF is a Gram-negative, short bacillus that is mainly present in the colon and is a component of human intestinal commensal bacteria [Citation12]. BF is classified into entero-toxigenic BF (ETBF) and non-toxigenic BF (NTBF) based on its ability to synthesize and secrete toxins [Citation12]. Although, studies have demonstrated the promoting role of BF in CRC [Citation13,Citation14], the specific molecular mechanisms remain to be explored.
Therefore, the present study aimed to reveal the detailed molecular mechanisms by which ETBF and NTBF affect on the integrity of the intestinal mucosal barrier and the malignant behavior of CRC cells and animals. This study aims to identify new perspectives and ideas for the clinical treatment of CRC.
2. Materials and methods
2.1 Azoxymethane (Aom)/dextran sulfate sodium (DSS) model
Male C57BL/6 mice (18–22 g) were obtained from the Experimental Animal Center of the Kunming Medical University. C57BL/6 mice were randomly divided into the Model (AOM/DSS model), ETBF (AOM/DSS model colonized with ETBF), and Brevilin A (AOM/DSS model colonized with ETBF and treated with Brevilin A) groups. There were six mice in each group comprising 18 mice. The AOM/DSS model was constructed as described previously [Citation15]. Briefly, C57BL/6 mice were intraperitoneally injected with 12.5 mg/kg AOM (A5486; Sigma-Aldrich, USA). After one week, 2.5% DSS (31404; Sigma-Aldrich) was continuously added to the drinking water for seven days. Subsequently, normal water intake was resumed for 14 d. The above procedure is a cycle and is repeated twice. C57BL/6 mice in the ETBF and Brevilin A groups were fed drinking water containing 1 g/L ampicillin (BS923; Biosharp, China) and 0.5 g/L metronidazole (B300250; Aladdin, China) for four weeks before modeling. Subsequently, the strains were colonized by gavage at 1 × 10 [Citation8] CFU ETBF (BNCC314741; BNCC, China) during DSS feeding, with three cycles of 7 d each. C57BL/6 mice in the Brevilin A group were injected intraperitoneally with 0.1 ml Brevilin A (10 mg/kg; HY-N2959; MedChem Express, USA) after 1 h of strain gavage, with three cycles of 7 d each.
The body weights of the C57BL/6 mice were recorded daily, starting with ampicillin and metronidazole treatments. Moreover, feces of mice were collected on days 0, 14, 35, and 56 at the start of modeling for qPCR to detect the ETBF DNA copy number. Forward primer: TCRGGAAGAAAGCTTGCT. Reverse primer: CATCCTTTACCGGAATCCT. Subsequently, all the mice were euthanized by intraperitoneal injection of 2% sodium pentobarbital (160 mg/kg). Colorectal tissues of the mice were photographed, and the number of tumors and tumor diameter were counted to calculate the tumor load. The tumor load was calculated as the sum of the diameters of each tumor. This study followed the ARRIVE guidelines to minimize the number of animals and their suffering. This study was approved by the Ethics Committee of the Chengdu Fifth People’s Hospital.
2.2 Pathological staining
Briefly, HE and PAS samples were fixed using 4% paraformaldehyde, and 8 µm thick sections were prepared. Sections were dewaxed with xylene and ethanol and stained with HE and PAS with using a hematoxylin and eosin staining kit (G1120; Solarbio, China) and AB-PAS staining kit (G1285; Solarbio). For transmission electron microscopy (TEM) samples, fixation was performed using 2.5% glutaraldehyde (P1126; Solarbio) and 1% osmic acid. After dehydration using a gradient of ethanol and acetone, the samples were embedded in epoxy resin. Subsequently, 70 nm-thick sections were prepared using an EM UC7 ultrathin sectioning machine (Leica, Germany). Finally, sections were stained with 3% uranyl acetate-lead citrate. HE and PAS-stained sections were imaged using a B×53microscope (Olympus, Japan), and TEM-stained sections were imaged using a JEM-2100 Plus (JEOL, Japan).
2.3 Cell and bacterial cultures
SW480 (Item No.: CL-0223B) and Caco2 cells (Item No.: CL-0050) were purchased from Wuhan Procell Co., Ltd. SW480 and Caco2 cells were inoculated in DMEM medium (G4552; Servicebio, China) containing 10% FBS and cultured in a CIB-191C cell culture chamber (Crystal; USA) at 37°C, 5% CO2. For the intestinal barrier model, Caco2 cells were inoculated in transwell chambers at a concentration of 5 × 10 [Citation4] per well, and 2 ml of cell culture medium was added to the lower chamber. Twenty-one days after the inoculation, the transepithelial electrical resistance (TEER) of the model was measured using an EVOM2 transmembrane cell resistivity meter (WPI, USA). When TEER > 400 Ω/cm [Citation2], the model is successfully constructed. ETBF and NTBF (NCC336948; BNCC) were inoculated into 50 mL of brain-heart infusion medium (B8130; Solarbio), and incubated anaerobically for 48 h. After centrifugation and filtration through an ultrafiltration membrane, the supernatant was collected for the BFT ELISA Kit (11-45-727; Mlbio, China) to detect the BFT concentration. The ETBF, NTBF and BFT concentrations were adjusted to 2 × 10 [Citation5] CFU, 2 × 10 [Citation5] CFU and 5.0 nM, respectively. They were co-cultured with SW480 cells or intestinal mucosal barrier model for 48 h and the cells were used for subsequent experiments.
2.4 Cell proliferation and apoptosis assay
Cell proliferation and apoptosis assays were performed using a cell counting kit-8 (CCK-8) (CK04; Dojindo Laboratories, Japan) and an Annexin V FITC/PI apoptosis assay kit (A005–4; 7sea Biotech, China), respectively. For cell proliferation assay, SW480 cells were inoculated in 96-well plates, and 10 µl CCK-8 solution was added to each well. The optical density (OD) of each well was measured at 450 nm using an ELX800 ELISA plate reader (Bio-Tek, China). For cell apoptosis assay, SW480 cells were stained with 5 µl Annexin V FITC for 15 min, and stained with 10 µl PI for 5 min. Finally, cells were assayed for apoptosis using NovoCyte Advanteon Flow Cytometer Systems (Agilent, China).
2.5 Migration and invasion assay
Cell migration and invasion were detected using wound healing and transwell assays, respectively. For the wound healing assay, SW480 cells were inoculated in Ibidi inserts (Ibidi, Germany) at a concentration of 2.5 × 10 [Citation4] cells/ml. The following day, the Ibidi inserts were removed and the cells were observed and photographed at 0, 12, and 24 h for wound healing. For the transwell assay, SW480 cells were inoculated at a concentration of 1 × 10 [Citation5] cells/ml in the upper chamber of a transwell, which was lined with Matrigel (354277; Corning, USA). The lower chamber was added to DMEM medium containing FBS. After 48 h, cells were fixed with 4% paraformaldehyde and stained with 0.1% crystal violet. Images were collected under a B×53microscope (Olympus, Japan), and measurements of the wound healing area and number of invading cells were performed using Image J 1.0 software (NIH, USA).
2.6 Western blotting assay
Total protein from SW480 cells and Caco2 cells was extracted using RIPA lysis buffer (P0013B; Beyotime Biotechnology, China), and total protein concentrations were determined using an EzDrop 1000 spectrophotometer (Blue-Ray, China). Each sample was subjected to SDS-PAGE electrophoresis with 60 µg of total protein, and transferred to PVDF membrane. After blocking with 5% skim milk powder, PVDF membranes were supplemented with STAT3 (ab68153; Abcam, USA), p-STAT3 (ab32143; Abcam), ZEB2 (PAM-20980; Therm, USA), E-cadherin (ab231303; Abcam), N-cadherin (ab98952; Abcam), MUC2 (PA5–103083; Therm), Zo-1 (ab96587; Abcam), Occludin (ab216327; Abcam), and GAPDH (P30008M; Abmart, China) primary antibody for incubation. The following day, Goat Anti Mouse IgG-HRP (M21001L; Abmart) or Goat Anti Rabbit IgG-HRP (M21002L; Abmart) was added to the PVDF membrane, and incubated for 2 h at room temperature. PVDF membranes were developed using the BeyoECL Plus kit (P0018S; Beyotime Biotechnology), and images were acquired using a 5200Multi gel imager (Tanon, China). Gel blots were analyzed using Image J 1.0 software for grayscale values.
2.7 Immunofluorescence (IF) assay
SW480 and Caco2 cells were fixed with 4% paraformaldehyde to prepare cell slides, which were permeabilized with 0.2% Triton X-100 at room temperature for 20 min. Colon tissue samples were added to citrate buffer, and the antibody was repaired at a high temperature in a microwave oven for 20 min. After blocking with 5% goat serum for 30 min, the cell slides and tissue sections were incubated with primary and secondary antibodies against the target proteins. Information on the primary and secondary antibodies used is described in the western blotting assay. Finally, an anti-quenching blocker (containing DAPI) (ZLI-9557; ZSGB-BIO, China) was added dropwise to the sections for nuclear staining and blocking. Sections were imaged using a B×53microscope, and the mean fluorescence intensity of the target protein was analyzed using Image J 1.0 software.
2.8 Statistical analysis
All experiments were repeated at least three times, and data are expressed as mean±SD. GraphPad Prism 8.3 software (GraphPad Software, USA) was used to perform statistical analyses based on the t-test, Mann – Whitney U test, one/two-way analysis of variance, Kruskal – Wallis H test, and visualization. p < 0.05 was considered statistically significant.
3. Results
3.1 ETBF and BFT facilitate CRC proliferation and metastasis
Considering our previous finding that BF is significantly enriched in patients with CRC, we explored the effects of ETBF and NTBF on the malignant phenotype of CRC cells. The CCK-8 assay results revealed a significant increase in SW480 cell viability after 24 h of ETBF and BFT treatment (). Although SW480 cell viability increased after NTBF treatment, the difference was not statistically significant (). Moreover, treatment with ETBF and BFT significantly reduced the apoptosis of SW480 cells compared to the Con group, whereas NTBF had no significant effect (). We also explored the effect of BF on SW480 cell metastasis. As illustrated in , ETBF significantly enhanced the wound healing ability of SW480 cells at 12 and 24 h. Similar results were observed in the BFT group. Notably, treatment with ETBF and BFT also increased the number of SW480 cells invading the lower chamber of the Transwell; however, the effect of NTBF was not significant (). The expression of E-cadherin was significantly lower in the ETBF and BFT groups than in the Con group. The opposite was observed for N-cadherin, and there was no significant change in the NTBF group (). IF staining yielded consistent results (). This suggests that ETBF and its metabolite BFT promote proliferation and metastasis and inhibit apoptosis of CRC cells, whereas the effect of NTBF is not significant.
Figure 1. ETBF and BFT facilitate CRC cell proliferation and metastasis. a: cell viability of SW480 cells at 12, 24, and 48 h after 2 × 10 [Citation5] CFU ETBF, 2 × 10 [Citation5] CFU NTBF, and 5.0 nM BFT treatments. b: early and late apoptosis rates of cells when ETBF, NTBF, and BFT were co-cultured with SW480 cells for 24 h. c: Representative pictures of SW480 cell migration at 0, 12, and 24 h and statistical analysis of wound healing ratio. Scale bar: 200 µm. d: Representative images of transwell and statistical analysis of the number of invading cells in SW480 cells after 24 h of treatment with ETBF, NTBF, and BFT. Scale bar: 200 µm. e: Representative gel blot images of EMT (E-cadherin and N-cadherin)-related proteins and statistical analysis of grayscale values. f: IF staining was performed to detect the localization and fluorescence intensity of N-cadherin in SW480 cells of each group. Scale bar: 50 µm. Compared to the Con group, “a” represents p < 0.05 and ns represents no significant difference.
![Figure 1. ETBF and BFT facilitate CRC cell proliferation and metastasis. a: cell viability of SW480 cells at 12, 24, and 48 h after 2 × 10 [Citation5] CFU ETBF, 2 × 10 [Citation5] CFU NTBF, and 5.0 nM BFT treatments. b: early and late apoptosis rates of cells when ETBF, NTBF, and BFT were co-cultured with SW480 cells for 24 h. c: Representative pictures of SW480 cell migration at 0, 12, and 24 h and statistical analysis of wound healing ratio. Scale bar: 200 µm. d: Representative images of transwell and statistical analysis of the number of invading cells in SW480 cells after 24 h of treatment with ETBF, NTBF, and BFT. Scale bar: 200 µm. e: Representative gel blot images of EMT (E-cadherin and N-cadherin)-related proteins and statistical analysis of grayscale values. f: IF staining was performed to detect the localization and fluorescence intensity of N-cadherin in SW480 cells of each group. Scale bar: 50 µm. Compared to the Con group, “a” represents p < 0.05 and ns represents no significant difference.](/cms/asset/19c3483e-cd22-45e5-96d7-df23e3bbc7b6/kccy_a_2309005_f0001_oc.jpg)
3.2 ETBF and BFT contribute to disruption of the intestinal mucosal barrier model in vitro
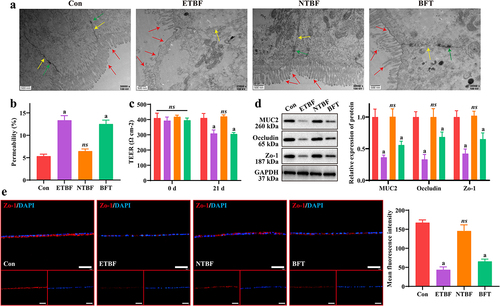
Injury to the intestinal mucosal barrier injury is closely associated with the CRC development process. We constructed an in vitro intestinal mucosal barrier model to explore the roles of ETBF, NTBF, and BFT. As shown in , the cell structure was normal with tight junctions and the villi were densely and neatly arranged in the Con and NTBF groups. In both the ETBF and BFT groups, the cells exhibited obvious edema, partial breakage of tight junctions, decreased density of desmosomes, fewer villi, and sparseness. Moreover, Caco2 cells exhibited higher permeability and lower TEER in the ETBF and BFT groups than in the Con group, whereas no significant changes were observed in the NTBF group cells (). Furthermore, we examined changes in intestinal mucosal barrier-related proteins (MUC2, Occludin and Zo-1). The expression of MUC2, Occludin and Zo-1 was significantly weaker in the ETBF and BFT groups than in the Con group, and NTBF treatment had no significant effect on their expression (). IF staining also indicated that treatment with ETBF or BFT significantly reduced the fluorescence intensity of Zo-1 in Caco2 cells (). This demonstrates that ETBF and its metabolite BFT disrupt the intestinal barrier, which may be a key pathway leading to CRC development and progression.
Figure 2. ETBF and BFT contribute to the disruption of the intestinal mucosal barrier model in vitro. a: changes of SW480 cell ultrastructure in each group were observed by TEM. Scale bar: 500 nm. Red arrows indicate villi; yellow arrows denote tight junctions; green arrows mean desmosomes. b: permeability of Caco2 intestinal barrier models obtained by FITC-dextran (40 kDa) assay. c: TEER of the Caco2 intestinal barrier model at 0 and 21 d. d: effect of ETBF, NTBF and BFT treatment on the expression of barrier-related proteins (MUC2, Occludin and zo-1) in the Caco2 intestinal mucosal barrier model was measured by western blotting. e: Representative if images and comparison of mean fluorescence intensity of zo-1 in Caco2 cells from each group. Scale bar: 50 µm. Compared to the Con group, “a” represents p < 0.05 and ns represents no significant difference.
3.3 STAT3/ZEB2 axis is the downstream target of BFT
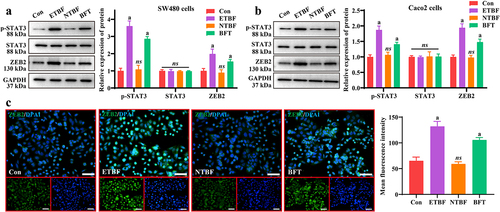
To further clarify the possible molecular mechanisms underlying the actions of ETBF and BFT, we examined their effects of ETBF and BFT on the STAT3/ZEB2 axis. After ETBF and BFT treatment, the expression of p-STAT3 and ZEB2 proteins significantly increased in SW480 cells; however, NTBF treatment was not effective (). Notably, consistent results were observed in the intestinal mucosal barrier model in vitro (). Furthermore, the mean fluorescence intensity of ZEB2 was significantly higher in the ETBF and BFT groups (). This indicates that ETBF and its metabolite, BFT, activate the STAT3/ZEB2 axis in CRC cells and an intestinal mucosal barrier model in vitro.
Figure 3. The STAT3/ZEB2 axis is the downstream target of BFT. a: Representative gel-blot images of p-STAT3, STAT3 and ZEB2 and statistical analysis of their grayscale values. b: the STAT3/ZEB2 axis was activated in the ETBF and BFT groups in the Caco2 intestinal barrier model. c: effects of ETBF, NTBF and BFT treatment on ZEB2 localization and fluorescence intensity in SW480 cells, as determined by if staining. Scale bar: 50 µm. Compared to the Con group, “a” represents P<0.05 and ns represents no significant difference.
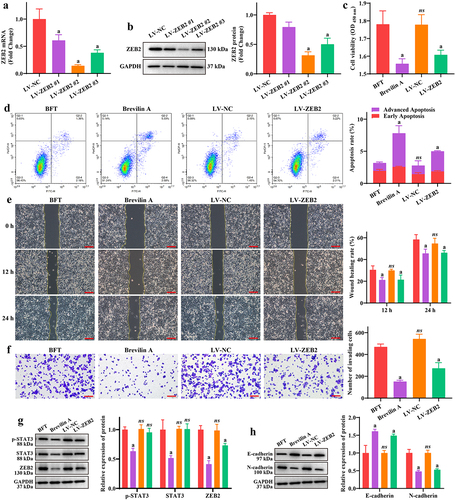
Furthermore, we treated cells with Brevilin A (STAT3 pathway inhibitor) or ZEB2 knockdown in addition to BFT treatment, to explore whether the functions of ETBF and BFT are achieved through the STAT3/ZEB2 axis. SW480 cells infected with the interfering lentiviruses were effective in reducing the mRNA and protein expression of ZEB2, with Lv-ZEB2 #2 showing the best effect (). Therefore, we selected LV-ZEB2 #2 cells for ZEB2 knockdown in subsequent experiments. The proliferation viability of SW480 cells in the Brevilin A and LV-ZEB2 groups was significantly reduced compared to that in the BFT group (). Additionally, treatment with Brevilin A and LV-ZEB2 significantly reduced the regulatory effect of BFT on SW480 cell apoptosis (). Notably, the wound healing ratio of SW480 cells at 12 and 24 h was significantly lower in the Brevilin A and LV-ZEB2 groups than that in the BTF group (), as was the number of invading cells in the lower chamber of the Transwell (). As expected, Brevilin A treatment significantly decreased the expression of p-Stat, Stat and ZEB2, and ZEB2 knockdown only limited the expression of ZEB2 but had no effect on the expression of p-STAT3 and STAT3 in SW480 cells (). Similarly, treatment with Brevilin A and LV-ZEB2 significantly enhanced the expression of E-cadherin and reduced the expression of N-cadherin compared to the BFT group (). This demonstrates that ETBF and BFT contribute to CRC cell proliferation and metastasis, at least through activation of the STAT3/ZEB2 axis.
Figure 4. BFT promotes CRC cell proliferation and metastasis by activating the STAT3/ZEB2 axis. a-b: changes in the expression of ZEB2 mRNA and protein after lentivirus interference were detected by (a) RT-qPCR and (b) western blotting in SW480 cells, respectively. c: effect of brevilin a treatment and ZEB2-interfering lentivirus on SW480 cell viability using the CCK-8 assay. d: flow cytometry was performed to analyze the percentage of early and late apoptosis in each group of SW480 cells. e: effect of brevilin a and LV-ZEB2 on SW480 cell migration was analyzed by the wound healing assay. Scale bar: 200 µm. f: brevilin a and LV-ZEB2 restricted the promotion effect of BFT on SW480 cell invasion. Scale bar: 200 µm. g: Representative gel blot images of p-STAT3, STAT3, and ZEB2. h: brevilin a and LV-ZEB2 were beneficial for E-cadherin expression, and inhibited N-cadherin expression in SW480 cells. Compared to the BFT group, ‘a’ represents p<0.05 and ns represents no significant difference.
3.4 ETBF promotes CRC process and intestinal mucosal barrier injury in vivo
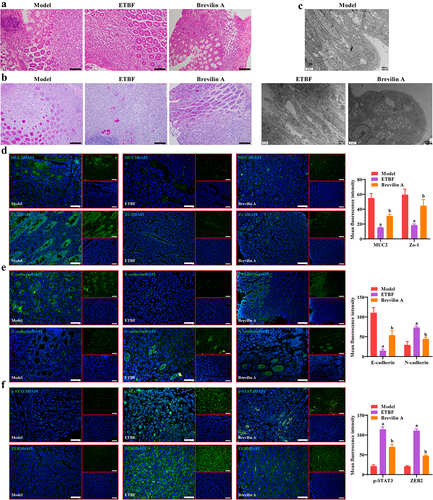
To further explore the effect of ETBF on the CRC development process and the intestinal mucosal barrier in vivo, we constructed an AOM/DSS model with ETBF colonization. Animal procedures used in this study are shown in . The general macrograph of the colorectum revealed that ETBF treatment significantly increased the tumor number and load in the AOM/DSS model, and Brevilin A treatment alleviated the promotion effect of ETBF on colorectal carcinogenesis (). Moreover, from the beginning of modeling (day 0), a significant decrease in body weight was observed in each group, and there was no significant difference in body weight among the three groups at each time point (). This result is consistent with the changes in the body weight of mice in the AOM/DSS model [Citation15], and treatment with ETBF and Brevilin A did not affect the body weight of mice. The fluorescent yellow assay revealed a significant increase in the permeability in the intestinal mucosal barrier of the ETBF group compared to the Model group, which was alleviated by Brevilin A treatment (). The copy number of ETBF DNA showed no significant change in the ETBF and Brevilin A groups and increased with each passing day (). Similarly, the fluorescence intensity of the ETBF FISH probe was enhanced in the ETBF and Brevilin A groups (). This indicates that Brevilin A did not affect ETBF growth in the AOM/DSS model. As shown in , the colon tissue in the Model group was cancerous, with deformed crypts, reduced cupped cells, thinned mucosal layers, and muscle layers accompanied by massive inflammatory cell infiltration. These pathological features were further aggravated in the colon tissues of the ETBF and Brevilin A groups, and were more severe in the ETBF group. TEM revealed that the villus structure and tight junctions of the colon tissue were intact in the Model group (). The colon tissue in the ETBF group exhibited marked edema, with a near disappearance of villus structures and tight junctions and the lesions improved after Brevilin A treatment (). Furthermore, ETBF colonization limited the mean fluorescence intensity of MUC2, Zo-1, E-cadherin and enhanced that of N-cadherin, p-STAT3 and ZEB2 in AOM/DSS model (). Notably, Brevilin A treatment significantly restricted the effect of ETBF on these proteins (). This suggests that ETBF facilitates CRC progression and intestinal mucosal barrier injury by activating the STAT3/ZEB2 axis in vivo.
Figure 5. ETBF promotes the CRC development process and intestinal mucosal barrier injury in vivo. a: flowchart of the animal procedures in this study. b: a representative picture of the colorectum in general. The red arrow indicates the tumor on the colorectum. c: statistical analysis of the tumor number in each colorectum. d: the tumor load of each colorectal group. The tumor load was the sum of the diameters of all tumors. e: change curve of mice body weight during the whole animal procedure. f: intestinal permeability was obtained based on fluorescent yellow assay. g: copy number of ETBF DNA in the mice feces of each group was detected by qPCR. h: FISH combined with if staining was performed to observe the localization and fluorescence intensity of the ETBF probe and its co-localization with MUC2. Scale bar: 50 µm. Compared to the Model group, “a” represents p < 0.05; compared to the ETBF group, “b” represents p < 0.05; and ns represents no significant difference.
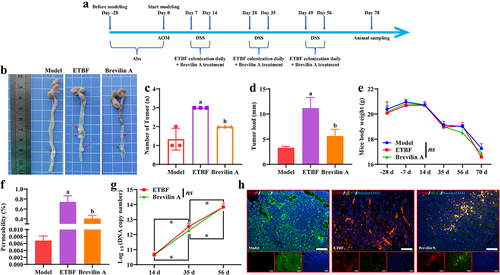
Figure 6. Effect of ETBF on colonic histopathology and protein expression. a: HE staining was performed to observe the pathological changes of colonic tissue in each group. Scale bar: 100 µm. b: changes in the number of goblet cells in colonic tissue were observed in each group using PAS staining. Scale bar: 100 µm. c: Representative TEM images of colon tissue from each group. Scale bar: 2 µm. d-f: effect of ETBF colonization and brevilin a treatment on the localization and fluorescence intensity of (d) intestinal mucosal barrier-related proteins (MUC2 and zo-1), (e) EMT-related proteins (E-cadherin and N-cadherin) and (f) STAT3/ZEB2 axis were observed by if staining in colon tissues. Scale bar: 50 µm. Compared to the Model group, ‘a’ represents p<0.05; compared to the ETBF group, ‘b’ represents p<0.05; and ns represents no significant difference.
4. Discussion
Previous studies have suggested that damage to the intestinal mucosal barrier is an important factor in the development and progression of CRC. Moreover, the interaction between intestinal microorganisms and the intestinal barrier may influence CRC development. BF is the only species consistently enriched in the intestinal flora of patients with CRC worldwide. In the present study, we found that ETBF and its metabolite BFT facilitated the malignant biological behavior (growth and metastasis) of CRC cells and damaged the intestinal mucosal barrier model in vitro, while NTBF had no such effect. Furthermore, ETBF increased the tumor load and permeability of the intestinal mucosal barrier in the colorectum in the AOM/DSS model. Notably, the promotional effects of ETBF and BFT on intestinal mucosal barrier damage and the CRC development process were achieved by activating the STAT3/ZEB2 axis.
The roles of ETBF, NTBF, and BFT in the integrity of the intestinal mucosal barrier and the CRC development process have been reported. The positivity rates of ETBF were 67.3%, 72.7% and 100% for colonoscopic biopsy samples from healthy, early, and advanced CRC patients [Citation16], suggesting a trend of ETBF enrichment with CRC progression. ETBF has also been demonstrated to accelerate CRC development and progression by regulating inflammatory responses [Citation17], dryness [Citation18], and polyp formation [Citation19,Citation20]. BFT secretion is one of the main pathways through which ETBF facilitates the CRC development process [Citation19,Citation21–23]. Our results confirm these findings, further strengthening the rationale for limiting ETBF abundance and BFT secretion during CRC treatment. Notably, Lee et al. [Citation24] indicated that NTBF had a restrictive effect on the occurrence of CRC in the AOM/DSS model. Similar results were reported by Chan et al. [Citation25]. Although the present study did not analyze the role of NTBF in the AOM/DSS model, we found that NTBF did not significantly inhibit CRC cell malignancy in vitro. This finding contradicts those of previous studies. We believe that the concentration of NTBF used in this study may be insufficient, and that the current concentration has a certain inhibitory effect on the proliferation of SW480 cells. It is possible that NTBF does not affect CRC cell proliferation or metastasis in vitro. In contrast, we further explored the roles of ETBF, NTBF, and BFT in the integrity of the intestinal mucosal barrier. Jeon et al. [Citation26] revealed that BFT secreted by ETBF facilitated the upregulation of MMP-7 and release of syndecan-2 in intestinal epithelial cells, which disrupted the intestinal mucosal barrier. Similar results have been reported by Patterson et al. [Citation27]. NTBF has no effect on the intestinal mucosal barrier model in vitro, but can prevent damage to the intestinal mucosal barrier by limiting the translocation of Salmonella Heidelberg [Citation28]. Our results are consistent with these findings, but we did not further analyze the reparative role of NTBF under conditions of damage to the intestinal mucosal barrier model. In contrast, we found that the STAT3/ZEB2 axis was a downstream target of ETBF and BFT.
STAT3 is an important member of the tyrosine kinase signaling and transcriptional activator family, which acts as a bridge between extracellular signaling and cellular response, and can play a transcriptional activation role in the nucleus and participate in the signaling process of many cytokines [Citation29,Citation30]. It is well known that STAT3 is an important signaling pathway mediating the growth and metastasis of CRC cells [Citation31,Citation32] and is also involved in damage to the intestinal mucosal barrier [Citation33,Citation34]. Therefore, we explored the roles of ETBF and BFT in STAT3 pathway activation. ETBF and BFT promoted STAT3 phosphorylation, which was restricted by Brevilin A (a STAT3 inhibitor). This result was confirmed in a study by Wick et al. [Citation35]. Interestingly, we also found that STAT3 phosphorylation regulates ZEB2 expression, and ZEB2 knockdown limited the effects of ETBF and BFT on intestinal mucosal barrier damage and the malignant biological behavior of CRC cells. ZEB family proteins are involved in the regulation of EMT under both physiological and pathological conditions; ZEB2 can bind to the E2 box on the promoter of the E-cadherin-encoding gene to repress E-cadherin transcription and contribute to the development of EMT [Citation36]. Furthermore, ZEB2-associated molecular mechanisms disrupt the integrity of the intestinal barrier, allowing bacterial infiltration into tissues to trigger an inflammatory response and promote the invasive metastasis of CRC [Citation37]. Our findings further suggest that the activation of the STAT3/ZEB2 axis is responsible for ETBF and BFT mediating intestinal mucosal barrier damage and CRC progression.
The present study extends previous findings [Citation11]. Nevertheless, the role of NTBF in the integrity of the intestinal mucosal barrier and the CRC development process is controversial and needs to be further investigated. In conclusion, our findings reveal the molecular mechanisms by which ETBF and BFT mediate intestinal mucosal barrier injury and growth and metastasis of CRC cells. This will help provide a theoretical basis for the development of future treatment strategies for CRC in response to ETBF.
Authors’ contributions
Conceived and designed the experiments: J.Y. and J.L.; Performed the experiments: J.Y., T.H., G.C., B.J., and G.Z.; Analyzed the data: J.Y., X.W., and H.H.; Resources: J.L.; Data Curation: T.H.; Writing – Original Draft: J.Y. and X.W.; Writing – Review & Editing: T.H., H.H., G.C., B.J., G.Z., J.L.
Availability of data and materials
All data in this research are available with the corresponding author upon reasonable request.
Ethics approval
This study was approved by the Ethics Committee of the Chengdu Fifth People’s Hospital.
Disclosure statement
No potential conflict of interest was reported by the author(s).
Additional information
Funding
References
- Biller LH, Schrag D. Diagnosis and treatment of metastatic colorectal cancer: a review. JAMA. 2021;325(7):669–85. doi: 10.1001/jama.2021.0106
- Di Tommaso N, Gasbarrini A, Ponziani FR. Intestinal barrier in human health and disease. Int J Environ Res Public Health. 2021;18(23):18. doi: 10.3390/ijerph182312836
- Song C, Chai Z, Chen S, et al. Intestinal mucus components and secretion mechanisms: what we do and do not know. Exp Mol Med. 2023;55(4):681–91. doi: 10.1038/s12276-023-00960-y
- An J, Liu Y, Wang Y, et al. The role of intestinal mucosal barrier in autoimmune disease: a potential target. Front Immunol. 2022;13:871713. doi: 10.3389/fimmu.2022.871713
- Quaglio AEV, Grillo TG, De Oliveira ECS, et al. Gut microbiota, inflammatory bowel disease and colorectal cancer. World J Gastroenterol. 2022;28(30):4053–4060. doi: 10.3748/wjg.v28.i30.4053
- Karpiński TM, Ożarowski M, Stasiewicz M. Carcinogenic microbiota and its role in colorectal cancer development. Semin Cancer Biol. 2022;86:420–30. doi: 10.1016/j.semcancer.2022.01.004
- Song M, Chan AT, Sun J. Influence of the gut microbiome, diet, and environment on risk of colorectal cancer. Gastroenterology. 2020;158(2):322–40. doi: 10.1053/j.gastro.2019.06.048
- Pothuraju R, Chaudhary S, Rachagani S, et al. Mucins, gut microbiota, and postbiotics role in colorectal cancer. Gut Microbes. 2021;13(1):1974795. doi: 10.1080/19490976.2021.1974795
- Shanahan F, Ghosh TS, O’Toole PW. The healthy microbiome—what is the definition of a healthy gut microbiome? Gastroenterology. 2021;160(2):483–494. doi: 10.1053/j.gastro.2020.09.057
- Manos J. The human microbiome in disease and pathology. APMIS: acta pathologica, microbiologica, et immunologica Scandinavica. APMIS. 2022;130(12):690–705. doi: 10.1111/apm.13225
- Yang J, Li D, Yang Z, et al. Establishing high-accuracy biomarkers for colorectal cancer by comparing fecal microbiomes in patients with healthy families. Gut Microbes. 2020;11(4):918–29. doi: 10.1080/19490976.2020.1712986
- Carrow HC, Batachari LE, Chu H, et al. Strain diversity in the microbiome: lessons from bacteroides fragilis. PLOS Pathogens. 2020;16(12):e1009056. doi: 10.1371/journal.ppat.1009056
- Cheng Y, Ling Z, Li L. The intestinal microbiota and colorectal cancer. Front Immunol. 2020;11:615056. doi: 10.3389/fimmu.2020.615056
- Clay SL, Fonseca-Pereira D, Garrett WS. Colorectal cancer: the facts in the case of the microbiota. J Clin Investig. 2022;132(4):132. doi: 10.1172/JCI155101
- Tanaka T, Kohno H, Suzuki R, et al. A novel inflammation-related mouse colon carcinogenesis model induced by azoxymethane and dextran sodium sulfate. Cancer Sci. 2003;94(11):965–73. doi: 10.1111/j.1349-7006.2003.tb01386.x
- Boleij A, Hechenbleikner EM, Goodwin AC, et al. The bacteroides fragilis toxin gene is prevalent in the colon mucosa of colorectal cancer patients. Clin Infect Dis. 2015;60(2):208–15. doi: 10.1093/cid/ciu787
- Shao X, Sun S, Zhou Y, et al. Bacteroides fragilis restricts colitis-associated cancer via negative regulation of the NLRP3 axis. Cancer Lett. 2021;523:170–81. doi: 10.1016/j.canlet.2021.10.002
- Liu QQ, Li CM, Fu LN, et al. Enterotoxigenic bacteroides fragilis induces the stemness in colorectal cancer via upregulating histone demethylase JMJD2B. Gut Microbes. 2020;12(1):1788900. doi: 10.1080/19490976.2020.1788900
- Hwang S, Lee CG, Jo M, et al. Enterotoxigenic Bacteroides fragilis infection exacerbates tumorigenesis in AOM/DSS mouse model. Int J Med Sci. 2020;17(2):145–152. doi: 10.7150/ijms.38371
- Lee YP, Huang WC, Lin TJ, et al. Toll-like receptor 4 prevents AOM/DSS-induced colitis-associated colorectal cancer in bacteroides fragilis gnotobiotic mice. Hum Exp Toxicol. 2021;40(4):622–633. doi: 10.1177/0960327120954249
- Mootien S, Kaplan PM, Pizzo SV. Monoclonal antibodies specific for bacteroides fragilis enterotoxins BFT1 and BFT2 and their use in immunoassays. PloS One. 2017;12(3):e0173128. doi: 10.1371/journal.pone.0173128
- Purcell RV, Permain J, Keenan JI. Enterotoxigenic bacteroides fragilis activates IL-8 expression through Stat3 in colorectal cancer cells. Gut Pathog. 2022;14(1):16. doi: 10.1186/s13099-022-00489-x
- Xie X, Jiang D, Zhou X, et al. Recombinant bacteroides fragilis enterotoxin-1 (rBFT-1) promotes proliferation of colorectal cancer via CCL3-related molecular pathways. Open Life Sciences. 2021;16(1):408–18. doi: 10.1515/biol-2021-0043
- Lee YK, Mehrabian P, Boyajian S, et al. The protective role of bacteroides fragilis in a murine model of colitis-associated colorectal cancer. mSphere. 2018;3(6):3. doi: 10.1128/mSphere.00587-18
- Chan JL, Wu S, Geis AL, et al. Non-toxigenic bacteroides fragilis (NTBF) administration reduces bacteria-driven chronic colitis and tumor development independent of polysaccharide a. Mucosal Immunol. 2019;12(1):164–77. doi: 10.1038/s41385-018-0085-5
- Jeon JI, Lee KH, Kim JM. Bacteroides fragilis enterotoxin upregulates matrix metalloproteinase-7 expression through MAPK and AP-1 activation in intestinal epithelial cells, leading to syndecan-2 release. Int J Mol Sci. 2021;22(21):22. doi: 10.3390/ijms222111817
- Patterson L, Allen J, Posey I, et al. Glucosylceramide production maintains colon integrity in response to Bacteroides fragilis toxin-induced colon epithelial cell signaling. FASEB J. 2020;34(12):15922–15945. doi: 10.1096/fj.202001669R
- Vernay T, Cannie I, Gaboriau F, et al. Bacteroides fragilis prevents Salmonella Heidelberg translocation in co-culture model mimicking intestinal epithelium. Benef Microbes. 2020;11(4):391–401. doi: 10.3920/BM2020.0004
- Kim M, Morales LD, Jang IS, et al. Protein tyrosine phosphatases as potential regulators of STAT3 signaling. Int J Mol Sci. 2018;19(9):2708. doi: 10.3390/ijms19092708
- Zou S, Tong Q, Liu B, et al. Targeting STAT3 in cancer immunotherapy. Mol Cancer. 2020;19(1):145. doi: 10.1186/s12943-020-01258-7
- Malki A, ElRuz RA, Gupta I, et al. Molecular mechanisms of colon cancer progression and metastasis: recent insights and advancements. Int J Mol Sci. 2020;22(1):22. doi: 10.3390/ijms22010130
- Zhong Q, Fang Y, Lai Q, et al. CPEB3 inhibits epithelial-mesenchymal transition by disrupting the crosstalk between colorectal cancer cells and tumor-associated macrophages via IL-6R/STAT3 signaling. J Exp Clin Cancer Res. 2020;39(1):132. doi: 10.1186/s13046-020-01637-4
- Wu X, Wei S, Chen M, et al. P2RY13 exacerbates intestinal inflammation by damaging the intestinal mucosal barrier via activating IL-6/STAT3 pathway. Int J Biol Sci. 2022;18(13):5056–5069. doi: 10.7150/ijbs.74304
- Yan B, Mao X, Hu S, et al. Spermidine protects intestinal mucosal barrier function in mice colitis via the AhR/Nrf2 and AhR/STAT3 signaling pathways. Int Immunopharmacol. 2023;119:110166. doi: 10.1016/j.intimp.2023.110166
- Wick EC, Rabizadeh S, Albesiano E, et al. Stat3 activation in murine colitis induced by enterotoxigenic bacteroides fragilis. Inflamm Bowel Dis. 2014;20(5):821–34. doi: 10.1097/MIB.0000000000000019
- Tania M, Khan MA, Fu J. Epithelial to mesenchymal transition inducing transcription factors and metastatic cancer. Tumor Biol. 2014;35(8):7335–7342. doi: 10.1007/s13277-014-2163-y
- Slowicka K, Petta I, Blancke G, et al. Zeb2 drives invasive and microbiota-dependent colon carcinoma. Nat Cancer. 2020;1(6):620–634. doi: 10.1038/s43018-020-0070-2