Abstract
Objective: It is commonly agreed that active safety will have a significant impact on reducing accident figures for pedestrians and probably also bicyclists. However, chances and limitations for active safety systems have only been derived based on accident data and the current state of the art, based on proprietary simulation models. The objective of this article is to investigate these chances and limitations by developing an open simulation model.
Methods: This article introduces a simulation model, incorporating accident kinematics, driving dynamics, driver reaction times, pedestrian dynamics, performance parameters of different autonomous emergency braking (AEB) generations, as well as legal and logical limitations. The level of detail for available pedestrian accident data is limited. Relevant variables, especially timing of the pedestrian appearance and the pedestrian's moving speed, are estimated using assumptions. The model in this article uses the fact that a pedestrian and a vehicle in an accident must have been in the same spot at the same time and defines the impact position as a relevant accident parameter, which is usually available from accident data. The calculations done within the model identify the possible timing available for braking by an AEB system as well as the possible speed reduction for different accident scenarios as well as for different system configurations.
Results: The simulation model identifies the lateral impact position of the pedestrian as a significant parameter for system performance, and the system layout is designed to brake when the accident becomes unavoidable by the vehicle driver. Scenarios with a pedestrian running from behind an obstruction are the most demanding scenarios and will very likely never be avoidable for all vehicle speeds due to physical limits. Scenarios with an unobstructed person walking will very likely be treatable for a wide speed range for next generation AEB systems.
Introduction
This article proposes a simulation model that allows the identification of chances and limits for automatic emergency braking (AEB) for pedestrians. It takes basic physical properties into account and is designed to be as transparent as possible. Therefore, it is limited to perpendicular accident configurations with generally constant motion of the vehicle and the pedestrian.
The first generation of active safety systems for pedestrians will address pedestrian protection, but bicyclists are also a focus of European stakeholders. The simulation model developed in this article was developed for pedestrians. The potential transferability to cyclist safety systems will be discussed.
A commonly agreed-upon constraint for active safety systems is that an automatic intervention should occur only as soon as an accident is deemed unavoidable for a human driver. This is done for 2 simple reasons: to conform to the Vienna Convention on cross-border traffic that requires the driver to be always in command of his vehicle or horses (Vienna Convention 1968), and to avoid product liability issues when an accident with following traffic occurs due to a false intervention of the AEB system. This constraint was also used, for example, in Coelingh (Citation2012) and Tiemann et al. (Citation2010); see also Westhoff et al. (Citation2011).
This constraint is slightly less strict for warning systems, but if a warning comes too often, drivers tend not to obey them (Mages Citation2009). For simplicity and transparency, warning estimation is not included in this article. The simulation model should be easily adjustable to take warning into account, however, using readily available reaction-to-warning models (e.g., Hoffmann Citation2008; Unselt et al. 2011).
A major challenge for pedestrian protection systems is that a person can stop almost instantly: in theory, a person is able to accelerate with 1 g (at least for fractions of seconds) in all directions due to the friction between shoes and pavement. This means that an accident in theory becomes unavoidable very late—sometimes only fractions of a second before the impact. If the pedestrian protection AEB system braked for pedestrians that are not yet a threat, there would be a large number of false interventions (and the driver might find it necessary to turn off the pedestrian protection system). The same holds true for warnings (where the driver either would turn off the system or would not pay attention to the warnings).
Therefore, the key to achieving good performance in active safety pedestrian protection is to very quickly and accurately determine the point in time when the accident becomes unavoidable, as well as a strong intervention with a high deceleration gradient and peak value.
The physical limits as well as limits for current and future systems will be identified with a simulation model. That model was developed from these constraints. The necessary parameters and characteristics were primarily taken from the literature as well as our own measurements.
Knowing performance limits as well as expected weak points is essential for setting the standards in consumer and regulatory testing for these systems. In the authors’ opinion, these standards preferably should involve a closed scale rating scheme, awarding grades from minimum to maximum performance levels.
Simulation Model
Requirements and Concept
The questions that need to be answered with the simulation model, taking into account legal constraints, pedestrian dynamics, vehicle dynamics, as well as current and future brake technology and—to some extent—sensor technology, but not different algorithms to use the sensor information, are
| • | What automatic speed reductions can be achieved as a function of initial speed and scenario type? | ||||
| • | What are the most relevant scenario parameters for these speed reductions? | ||||
| • | How sensitive is the speed reduction to small parameter variations as might occur in reality as well as in testing? | ||||
The general concept is to identify the point in time when the accident becomes unavoidable, measured as the quantity time to collision (TTC, s). This TTC value is available for automatic countermeasures and will be used as an input parameter to calculate the possible speed reduction and impact point shift at the time of collision (if applicable).
An accident becomes unavoidable when there is no chance
| • | for the driver of the vehicle to come to a full stop by braking; | ||||
| • | for the driver to avoid the accident by steering around the pedestrian; or | ||||
| • | for the pedestrian to avoid the accident by stopping. | ||||
Fig. 1 Concept for a simulation model.
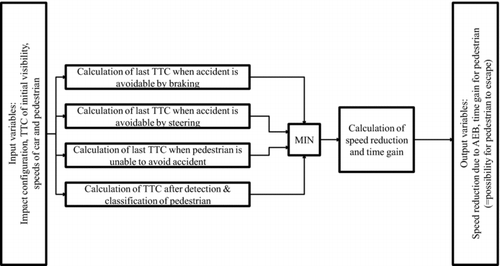
The model consists of 3 submodels that calculate these corresponding TTC values; see . An additional submodel contains the time needed for detection and classification of the pedestrian by the system. Currently, it only subtracts the delay time from the initially available TTC and supplies this as a fourth TTC value.
The minimum TTC from these 4 blocks was then selected as the available TTC for avoidance or mitigation by braking. The possible speed reduction will be calculated from that TTC value. For most cases with a readily visible pedestrian and an offset impact point, the steering TTC will be the lowest; for center impact points, braking TTC might be the lowest; and for scenarios with a pedestrian emerging from behind an obstruction, the system reaction time will become more relevant.
In order to avoid an accident by braking, the driver needs to have at least touched the brake pedal at a certain minimum TTC. This minimum TTCBrake depends on vehicle speed, the characteristics of the brake system, and the tires (all contributing to the possible stopping distance). Note that TTCBrake will in reality also depend on the impact point of the pedestrian: if the impact point would be on the far side corner of the vehicle in the direction of the pedestrian path, a small amount of braking should be sufficient to let the pedestrian pass, whereas for impact positions on the near side, the vehicle has to come to a full stop. This effect is considered when calculating the resulting speed reduction later in the model but is neglected here for calculation of the last time to brake by the driver for 2 reasons: first, the driver will very likely not be able to estimate the correct speed change needed to just let the pedestrian pass and, second, especially in far-side cases, the minimum time for avoidance is the steering avoidance time, which is very low due to the fact that the vehicle lateral position needs to be shifted only a few centimeters away from the pedestrian.
This TTC value, TTCSteer, needed to steer around the pedestrian is more or less independent of the traveling speed of the vehicle. It depends mainly on the peak lateral acceleration and its gradient, the jerk (with the maximum lateral jerk being a vehicle characteristic), and the lateral impact position of the pedestrian (it takes more time to swerve around a pedestrian standing in front of the vehicle's centerline than to swerve around a pedestrian that would be hit by the corner of the vehicle).
The pedestrian might also avoid the accident by comfortably stopping before reaching the vehicle's path. The time required for the stop TTCPedestrian will be higher for running speeds, lower for walking speeds, and, of course, will change with the impact position.
Finally, there is some time needed for the detection and classification of a pedestrian. This time limit counts from the point in time when the pedestrian becomes visible. For accident scenarios with unobstructed pedestrians, this time value is neglected, but it becomes relevant for scenarios with pedestrians emerging from behind an obstruction, from the near side of the vehicle, and especially when the impact point is near the near-side corner of the vehicle—in this case, the time before impact approaches fractions of a second.
This property depends on the sensor type as well as on the field of view. Currently, only systems with ideal sensors were included in the scope of the model. In the future, field-of-view characteristics of specific sensors could be implemented as well.
When the relevant TTC for braking intervention is known, stopping distance, residual speed, as well as changes in pedestrian lateral position can be calculated based on different AEB system characteristics. These values then answer the open questions.
Because the goal of the model is to identify limits and AEB potential speed reduction based on legal constraints and technological readiness, system detection algorithms as well as plausibility checks that might need to be carried out before a braking intervention is commanded will not be considered. These specific software components may in reality only decrease the AEB performance and thus have no influence on the potential maximum performance of a given AEB system.
Accident Scenarios
Accident studies show that most of the relevant accidents involve a pedestrian moving more or less perpendicular to the vehicle path covers (Wisch et al. Citation2013).
The reaction pattern of pedestrians detecting danger when they are already in a vehicle's path is unknown, but a reasonable assumption seems to be that there is no reaction—simply because reaction times of the pedestrian are relatively high compared to the time the pedestrian is in the vehicle path. Another reason might be that (because the critical time span is so short) pedestrians who try to escape from the vehicle's path succeed—these accidents do not occur and therefore cannot be found in accident databases.
Our own evaluations of in-depth data from German In-Depth Accident Study (GIDAS) also show that the lateral impact point of the pedestrian on the vehicle front is distributed—not always in center position—and there seem to be more impacts near the vehicle corners than in the middle of the vehicle, which is shown for the near-side pedestrian in , where an impact with an off-center of 0 cm corresponds to an impact centered on the front of the cars. A similar distribution can be obtained for the far-side pedestrian.
Fig. 2 Impact location for near-side pedestrians running from behind an obstruction (color figure available online).
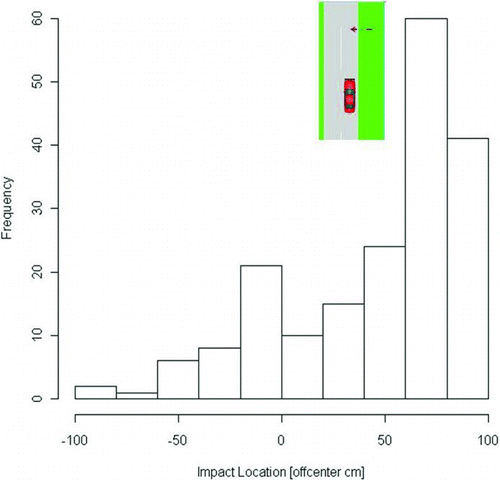
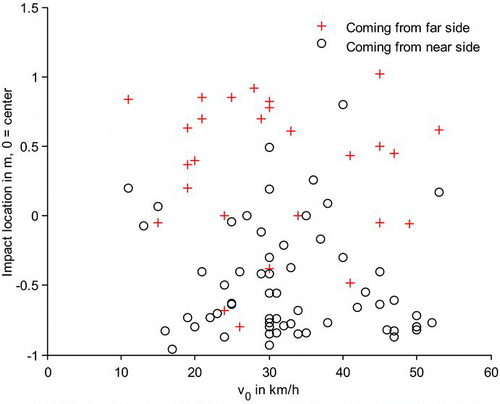
Fig. 3 Driving speed and impact location for obscured and running near-side and far-side pedestrians (color figure available online).
The lateral impact position of the pedestrian is an important parameter for the simulation model. It strongly influences the potential performance of pedestrian protection systems in a nonlinear manner, especially in accident scenarios with late visibility of the pedestrian but also for all other scenarios due to the fact that it will be possible to avoid the accident by steering quite late, leaving a relatively low time available for braking countermeasures.
The point in time when the pedestrian becomes visible is the most significant limit for the performance in scenarios with pedestrians emerging from behind an obstruction. Our own evaluations of in-depth accident data showed that for most cases of pedestrians emerging from behind an obstruction, this obstruction is around 1 m away from the outer corner of the vehicle (Wisch et al. Citation2013).
shows that the vehicle speeds are frequently found to be no greater than 60 km/h. This figure has been plotted for accidents with pedestrians moving perpendicular to the path of the vehicle. There is no correlation between driving speed and impact point on the car.
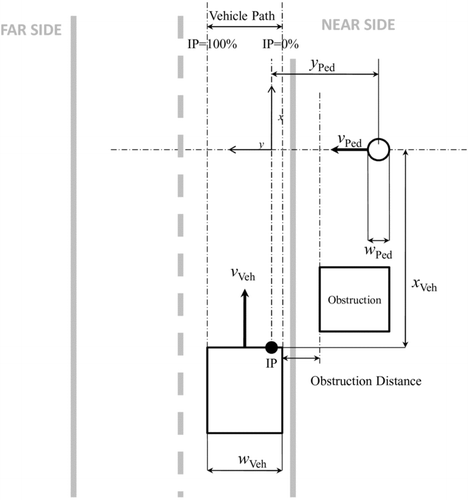
Fig. 4 Accident scenario parameters. Near side/far side shown for driving on the right side
Though vehicle speeds in an accident typically can be reconstructed with the use of skid marks, other traces on the road, and vehicle deformation, pedestrian speeds cannot be accurately determined from accident data. It is possible to reconstruct the pedestrian speed or TTC of initial visibility as long as one of these quantities is known and as long as the impact position and distance to the obstruction are given. It is not possible to determine TTC and pedestrian speed if both are unknown. An option is to rely on information from eye witnesses as well as the pedestrian and driver, if possible, but speed estimations from victims are known to be quite subjective.
Therefore, pedestrian speeds will only be distinguished between walking and running. The TTC of initial visibility can be calculated from the pedestrian speed, the distance from the obstruction to the vehicle's outer corner (which is the part of pedestrian traveling distance outside of the vehicle path), and from the vehicle's outer corner to the impact position (which is the part of pedestrian traveling distance inside the vehicle path).
A definition of the relevant parameters that form an accident scenario is shown in .
Ideal Braking Performance
An accident is avoidable by braking if the necessary stopping distance for a given speed is lower than the distance to the relevant target object.
Stopping distance as a function of deceleration is
For the considerations here, it is more useful to use the value TTC, which is generally for 2 bodies (1 and 2) traveling in the same direction, defined as (e.g., see Winner Citation2012)
Usually, the pedestrian's speed component in the direction of vehicle travel is low; for the assumption of a pedestrian crossing perpendicular to the driving direction, it is zero. This simplifies TTC calculations because only the vehicle speed and position are relevant for TTC calculations:
For a given accident scenario with a vehicle traveling at a constant speed toward a pedestrian who is either already in the vehicle's path or will be in the vehicle's path when the vehicle reaches the pedestrian's position, TTC can be evaluated during all times. It decreases constantly over time and reaches zero at impact.
The minimum TTC that the vehicle needs to come to a full stop is given by combining EquationEqs. (1) and Equation(3):
This equation is only valid as long as the accident is avoidable, which is the case if the available TTC Available is greater than TTC Stop:
If this is true, the residual speed after braking is zero. Otherwise, the following equation needs to be used to calculate the residual vehicle speed at impact:
The derivation of this equation is shown in detail in Winner (Citation2012).
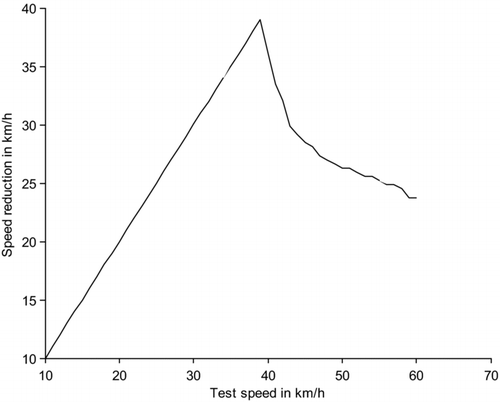
EquationEquations (4) and Equation(6) together form the so-called shark's fin curves that describe the possible speed reduction as a function of initial speed for all situations when there is only limited braking time available (see ).
Fig. 5 Shark's fin curve for static pedestrian at 50 percent position. The maximum speed reduction is 38 km/h, which is also the maximum avoidance speed.
In order to avoid an accident by swerving, the vehicle needs to be shifted laterally by a distance Δy, which is determined from the pedestrian's lateral position in the vehicle's path and its width; see .
For a pedestrian width yw ,Ped and a vehicle width yw ,Vehicle as well as an offset from the centerline y Offset, the necessary distance that the vehicle path needs to be shifted is
This equation refers to the original impact position without any AEB intervention. The impact shift that results from the fact that braking delays the impact and the pedestrian can continue to travel is not included. This seems to be reasonable, because the calculations were performed to determine the moment when braking should start: they give the potential. Of course, real AEB systems will very likely also monitor the pedestrian movement during the braking phase, but this fact does not contribute to the potential for AEB systems. Rather, it helps to reduce consequences of false-positive interventions.
Because the vehicle is assumed to move toward the pedestrian's position in a straight line, it has no speed component in the lateral direction. The time needed to achieve the lateral shift is given by
This shows that the time needed to swerve around an obstacle in theory is independent of the driving speed.
The physical limit to avoid an accident by braking or swerving is given by taking g as the maximum acceleration when evaluating EquationEqs. (4), Equation(6), and Equation(8).
Though this set of equations can be used to generally describe the absolute physical limits, the estimation of the potential for realistic systems requires the application of a more sophisticated vehicle dynamics model.
The Influence of Road–Tire Friction
Throughout this article, the friction coefficient between the road and the tires will be considered to be 1. This is appropriate for dry roads. A large proportion of pedestrian accidents occur during wet conditions, which suggests a lower friction coefficient.
In general, the overall forces transferable between the tires and the road depend to a large extend on the friction coefficient, μ, in both directions and the force tangential to the movement, Fz . For general considerations, this tangential force is the vehicle weight G (N) or the combination of vehicle mass m (kg) with gravity g:
Assuming that an AEB system is fully aware of friction degradation, EquationEqs. (6) and Equation(8) could be combined as follows:
The basic idea is that degradation of friction also limits the possibilities of the driver to avoid the accident by steering, so braking could commence earlier—and therefore the resulting speed reductions would also decrease, but only with the square root of the friction value (e.g., μ = 0.5: degradation by 0.707) rather than linearly (which would be 0.5).
In reality, friction is never homogenous, and it can only be estimated with current technology for the surface that the vehicle is actually driving on, but not for the road that lies ahead. The hypothesis of having the ability to swerve around an obstacle with, for example, μ = 1, cannot be falsified until the driver tries to swerve around the obstacle.
In case a system is designed to be conservative, the calculation of the minimum TTC, which depends largely on the steering avoidance criterion, would remain the same. The speed reduction that can be achieved by applying the brakes at that late TTC naturally is much lower than for full available friction.
On the other hand, a system might take the wiper activation into account and switch to a lower assumed friction, as mentioned above; then the performance will stay relatively robust.
This article aims to provide the potential of speed reduction. Therefore, it is justifiable that μ = 1 is selected. The friction value is a parameter that can be changed in the source code, which is available upon request.
Vehicle Dynamics Model
The vehicle dynamics submodel will be used in 2 directions: first, backwards with a set of parameters appropriate for a typical driver to calculate when the accident becomes unavoidable, and, second, in the forward direction with a set of parameters appropriate for an AEB system to calculate the speed reduction/avoidance for the given available TTC.
The method used in this article defines a brake force/side force over time, divided by vehicle mass and integrated once for velocity and twice for distance. Thus, the force profile in principle can be freely defined in this submodel; it can also be fed into the simulation from external measurements. In order to keep things simple, a constant jerk and saturation for brake deceleration and lateral acceleration were used after a specific actuation time, t act:
These equations use the Föppl symbol for simplification: <x> = 0 for x ≤ 0, x for x > 0 (in other words, the accelerations are zero for all times, t < t act, will increase continuously after t act until they reach their maximum level).
A human driver will first need to push the brake pedal for a short distance without any effect on the brakes. The start of movement, however, will be noticed by the vehicle electronics. The time for the empty pedal travel is t Empty, which shifts the activation time, t Act:
This parameter is not considered for AEB systems, because their initial activation time is known by the control unit and will be taken into account when calculating the intervention timing.
For lateral movement, the relaxation length l relax limits the buildup of side-slip forces (Cossalter 2002). A typical value is around 0.5 m, and it acts like a first-order time delay with a delay time of l relax/v 0. Thus, a first-order time delay is applied to the lateral acceleration before further integration.
Velocity and distance will be corrected with initial values:
Initial values for lateral movement are zero:
For forward calculations, TTC initial is given (which is the minimum TTC value from all 4 blocks according to ), and after performing all necessary integrations, the speed reduction will be the speed value at the time the distance value reaches zero:
If the vehicle does not come to a full stop, the braking process will at least lead to a later arrival of the vehicle at the pedestrian's position. This will give the pedestrian time to move forward with his current velocity. Perhaps this might still help to avoid the accident, but it will certainly shift the impact position. The time gain is given by
The backwards calculation delivers the minimum TTC when the accident becomes unavoidable. The easiest way to derive this TTC Brake is a forward solving of the equations with varying initial TTC values until the minimum TTC for avoiding the accident is determined using iterations. A similar method is used to determine the minimum TTC needed to swerve around the obstacle:
The maximum brake jerk for current AEB systems is limited mainly by the Electronic Stability Control Systems (ESC) pump and thus can be taken from current car-to-car AEB systems. A typical value will be 20 m/s3 (see plots shown in, e.g., Seiniger et al. [2012], Figure 12, and [Rodarius et al. [2012], Figures 5–7).
Future brake systems will have a significantly higher gradient. Recent publications suggest that a value around 66 m/s3 will be realistic within the next years on a component level (see Feigel [2012]). The application of these high gradients in vehicles might generate problems for occupant safety; such a high jerk might surprise drivers and move them out of position. This topic requires research, and it is anticipated that such a brake system will not hit the market for at least 5 years.
If the brake itself is quick enough, the brake force gradient will be limited by the chassis (pitching motion of the vehicle) as well as the dynamic properties of the tire. An absolute limit of 100 m/s3 for vehicle deceleration seems reasonable without further calculations.
If a human driver quickly applies the brakes with full force, gradients comparable to those of an automatic AEB are achieved.
Maximum brake jerk when a typical driver uses a current brake (including brake assist) will be around 30 m/s3, though this value will certainly approach 66 m/s3 for future systems.
The time needed to pass the empty pedal travel is estimated to be around 0.1 s (our own measurements).
For all cases, the maximum deceleration will be around 10 m/s2, which corresponds to a tire–road friction number of 1.
No sources for the build-up time for generating a full lateral acceleration of 10 m/s2, measured with real drivers, have been found. It is assumed that this build-up time will be at least 0.2 s, because a steering angle of at least 5° needs to be reached, with typical steering wheel transmission ration that would roughly correspond to a 75° steering wheel angle.
With this set of parameters, the vehicle dynamics model for current and future brake systems is fully defined.
An overview of the parameters is given in .
Table 1 Overview of system parameters
Pedestrian Dynamics
The assumption for the pedestrian dynamics is as : Only comfortable stopping from the relevant velocity (e.g., running, walking) shall be considered as appropriate pedestrian reaction, because this suggests intentional stopping. Unintentional stopping of the pedestrian means that an accident is close at hand, and an automatic system intervention or at least a warning would certainly be appropriate.
A recent study (Tiemann et al. Citation2010) provided deceleration values for pedestrians. The peak deceleration for the transition walking to stop of around 1.5 m/s2 and for jogging to stop of around 3 m/s2 were reported. The comfortable stopping distance for the pedestrian is
For walking (5 km/h), the stopping distance is around 60 cm, and for running (8 km/h) it is 80 cm.
The TTC at which a collision becomes unavoidable by the pedestrian depends on the offset position of the pedestrian in the vehicle path. With the vehicle width sw ,Veh, pedestrian width sw ,Ped, and an impact position running from 0 (near side) to 1 (far side), the TTC is given by
If this TTC value has elapsed, the pedestrian will very likely not avoid the collision on his or her own, and automatic intervention should be justified.
Sensor and Detection Time Delay
Before any judgments on system reactions can be done by the AEB system, the pedestrian needs to be detected and classified as a relevant object.
The time needed for this t Systemdelay depends on the sensor principle. For instance, mono video systems will need a few frames (with a frame duration of 40 ms) to classify the pedestrian and estimate his or her speed and position. A typical time needed for this process is 0.5 s in current systems.
More advanced sensor principles like stereo camera and photonic mixing device sensor will still require around 0.2 s for this system delay (Franke et al. Citation2012).
Implementation
The model is simply a set of differential equations. When treated numerically, no specific solving algorithm is needed. Everything was implemented as MATLAB m-File functions because MATLAB (see http://www.mathworks.com) is dedicated to numeric programming; however, any other programming language can be used. All scripts should also run in open-source software like Octave (see http://www.gnu.org/software/octave) or SCILAB (see http://www.scilab.org) as well. The source code of the described simulation model is available from the corresponding author via request per email to [email protected]
Possibilities and Limitations of AEB Systems
The simulation model provides some facts that could be useful for benefit estimations and the definition of test cases.
When defining test cases and assessment schemes, the possible speed reduction needs to be taken into account. Possible speed reductions for demanding scenarios “child running from behind obstruction” as well as for the relatively easy “walking adult without obstruction” will be given.
Fig. 6 Contour plot of residual speeds = f(impact point, test speed) for scenario “child running (8 km/h) from behind an obstruction (1 m from vehicle path)” for current, future, and physical limits AEB systems (from left to right). Impact point 0 refers to near side, impact point 1 to far side with respect to the pedestrian's origin. Upper row: system intervenes as soon as accident becomes unavoidable (max lateral acceleration = 1 g). Middle row, 0.6 g, lower row: 0 g (steering intervention not taken into account). All system parameters are summarized in . Note that because the distance to the obstruction and all speeds are constant, higher impact point values mean that the pedestrian had more time to travel, thus the initial visibility TTC was earlier. High impact point values = high initial TTCs; low impact point values = low initial TTCs. All values only valid for high friction (μ = 1).
The impact point is also a relatively important parameter. How much it affects the AEB performance in both scenarios will also be shown in this section.
Last but not least, the necessary controllability for the test setup (in particular, lateral deviation of the vehicle during the test) is derived.
Child Running From Behind an Obstruction
The most demanding scenarios for AEB systems will be those with low reaction times. The system must decide to take action as quickly as possible but also not provoke a high number of false interventions.
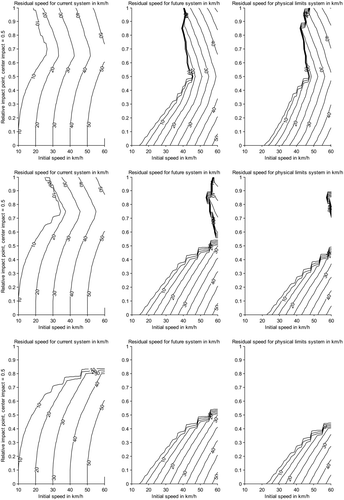
The possibilities for dealing with the scenario “child running from behind obstruction” are shown in for 3 different system generations (current, future as already described in the Vehicle Dynamics and <2> Sensor and Detection Time Delay sections). These plots and the plots in show the speed reduction with impact position and initial speed as parameters.
Fig. 7 Contour plot of residual speeds for walking adult (5 km/h) without obstruction, current AEB system, future system, physical limit system, from left to right. Relative impact position ranges from 0 (near side corner of vehicle) to 1 (far side corner of vehicle). Maximum lateral acceleration is 1 g (upper row), ignored (lower). Ignoring the steering-avoidance criterion means that braking should start, for example, as soon as the pedestrian is almost in the path, cannot stop anymore, and vehicle and pedestrian will collide if braking is not applied.
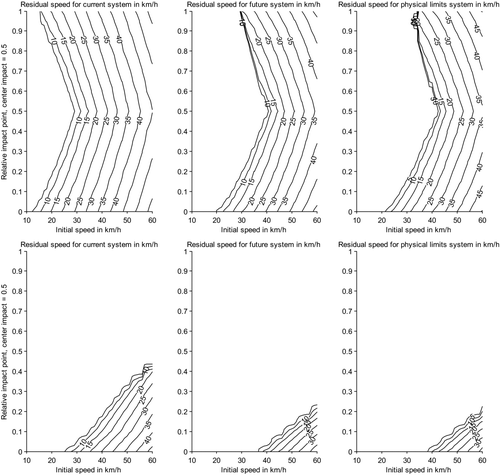
The upper row of the plots in takes all criteria for accident avoidance into account, braking starts only as soon as the accident is unavoidable, and contains the assumption that typical drivers use full lateral acceleration of 1 g (of course this is physically possible, see, e.g., Winner [2012] but not often applied by regular drivers [Winner Citation2012]). This means that generally steering avoidance is possible relatively late before the impact, making the accident unavoidable relatively late, and thus the time available for automatic braking and the benefit from that is also quite low.
The left column in was made with a parameter set comparable to the current state of the art. The outcome is not symmetric with respect to the center of the vehicle. The lowest residual speeds are reached for impact positions around 70 percent of the vehicle front. This is because system reaction time needed for classification takes some of the time that would be otherwise be available for countermeasures only on the near side of the vehicle (the side where the pedestrian appears). Higher impact positions will result in lower steering avoidance times, resulting in lower speed reductions.
The middle and right diagram were made with parameter sets for future and physical limit systems. Here, the diagram is not symmetric due to the fact that quick braking in far-side impact conditions gains so much time that the pedestrian is able to escape from the vehicle path, even when continuing to travel at his or her original speed (because the assumption is that pedestrians do not react to approaching vehicles).
Hidden behind this effect, the isotaches (lines of constant residual speed, shown here as contour lines) are symmetric to the center impact line. There is no significant difference for future and physical limit systems.
Note that for certain lower speeds, the isotaches become parallel to the impact point axis. This is when the avoidance by braking criterion becomes dominant.
The middle row assumes that a regular driver would be able to steer with 0.6 g peak lateral acceleration, meaning that the accident becomes unavoidable earlier than above. The time that is available for braking intervention becomes longer. As expected, the isotaches move toward lower residual speeds for the same initial speeds (performance in general is better), but the effect of the escaping pedestrian also becomes more important: nearly all impact positions above 50 percent are avoidable by future systems and better up to 40 km/h vehicle speed because the pedestrian has time to escape from the vehicle's path. Note that this effect is strongly nonlinear and not continuous; for one impact position, the pedestrian has time to escape, and by slightly changing the impact position, the pedestrian will be hit at a relatively high speed.
The lower row shows the performance that could be achieved if the steering-avoidance criterion were fully ignored. Future AEB systems would be able to avoid almost all accidents with an impact position from just above the center, but there is little effect on the expected performance for other impact positions compared to the 0.6 and 1 g steering-avoidance plots.
These simulations show that the steering avoidance criterion is probably the most relevant constraint for the expected performance—for impact positions just above the center impact—whereas it has no influence on the other impact points. The simulations also show the strong nonlinear effect of the escaping pedestrian. Furthermore, there is not much difference between a future system and the physical limits.
Current systems are expected to perform best around the 70 percent impact position, with some performance for center impacts and almost no speed reduction on the near side. There is little difference for 6 or 10 m/s2 maximum lateral acceleration, but ignoring accident avoidance by swerving, even current systems would be able to avoid accidents on the far side for all speeds due to the escaping effect.
If an AEB system were able to determine whether there is an option to steer around the pedestrian, the performance might be better for situations in which the system identifies that there is no possibility. This needs to be taken into account when defining test procedures.
These simulations also show that—even if steering avoidance is neglected—there are always a number of pedestrian accidents that are unavoidable. Therefore, the evolution of passive safety measures is still necessary.
Walking Adult, Unobstructed
For cases without obstruction, the isotaches (lines of equal residual speed) become symmetric around the center impact point; no system delay time is needed for detection and classification (see ). Depending on the expected maximum lateral acceleration, there is almost no influence of the pedestrian escape effect (upper row: 1 g maximum lateral acceleration) or there is some effect but not as much as for the child running from behind an obstruction scenario. Note that in the case of the walking pedestrian, because the speed is much lower than for the running pedestrian, the time gain needed to let the pedestrian escape is much higher.
The graphs in Figure 7 show that the central impact position clearly offers the highest speed reduction. The performance decrease for off-center impact locations depends on the estimated maximum lateral acceleration.
If the steering-avoidance criterion is completely neglected (because some AEB systems might be able to sense whether there is an option to steer around the pedestrian), only a small number of accidents are unavoidable. These are cases on the near side of the vehicle, and this is mainly limited by the size of the pedestrian's comfortable stopping zone; as soon as the pedestrian enters the zone, a braking intervention would be justified, and the time until impact is low.
Again, the estimated lateral acceleration respectively the time when the accident is avoidable by steering is the most relevant factor for the performance of an AEB system.
Validation
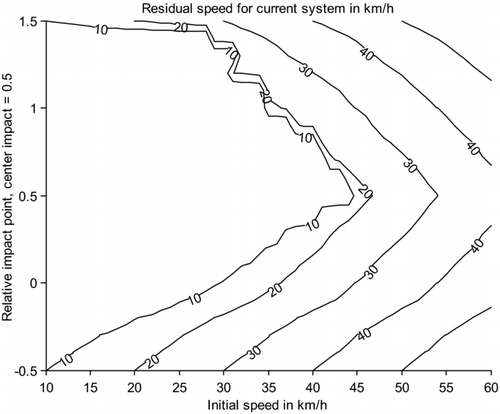
Currently, Bundesanstalt für Straßenwesen (BASt, the Federal Highway Research Institute in Germany) is conducting experiments with different test vehicles to obtain performance data in all kinds of scenarios. When these data are not available, other sources can show the validity of the model. Coelingh (Citation2012) presented test results for the scenario “static pedestrian in the center of the vehicle path.” Coelingh's (2012) data also show the significant shark's fin curve. The avoidance speed (which marks the highest point of the shark's fin) is comparable and deviations can be explained by different peak lateral accelerations. The measured peak avoidance speed for pedestrian accidents is just below 40 km/h.
The avoidance speed of 38 km/h from the simulation model in this article for a current system configuration () lies in the range of those measured speeds. The model delivers plausible results. A full validation can be carried out after BASt's own measurement campaign.
Discussion
BASt developed a simple simulation model, based on the assumption that an AEB braking intervention only occurs when the accident is unavoidable, and longitudinal speeds remain constant until this point. This model was used to simulate the brake performance of current, future, and absolute physical limit AEB systems in different scenarios.
Consequences for a Test Suite
Because currently test setups are defined by various projects in consumer and regulatory testing, these test cases should take the following findings into account:
| • | The impact point should be varied. Especially for the walking adult, depending on the system design, the central position might overexaggerate the benefit in real life where impact positions are mainly offset impacts (a good compromise might be to test AEB systems at 25% and 75% in all scenarios). | ||||
| • | If an AEB system was able to detect that there are no possible steering avoidance zones, it could switch to earlier braking—meaning better performance. This fact needs to be taken into account when defining the test setup as well as when defining the rating schemes for the test results. | ||||
| • | A highly controllable test setup is needed. The use of steering robots for stable lateral control and accurate speed control in the vehicle-under-test seems to be a good solution. | ||||
Consequences for Benefit Estimations
Accidentology shows that impact positions in reality are typically rather offset positions (near side/far side) than center impacts; see and .
The results from the simulation model suggest that system performance estimations based on center position impacts are the optimum value and not the typical value of speed reductions in reality.
On the other hand, the considerations in this article clearly show the limitations if a system is designed according to the reasonable avoidance criteria discussed. Further research on pedestrian behavior as well as optimization between driver expectance and pedestrian behavior is suggested in order to overcome these limitations.
Transferability to Bicycles
Bicycles are more constrained in their movement possibilities than pedestrians. It is not as simple to change the path of a bicycle as it is for a pedestrian, and the deceleration levels that can be achieved are not as high as for a running pedestrian. The width of a bicycle is greater than the typical width of a pedestrian, so the time when a bicycle is in the path of the vehicle is also longer.
Fig. 8 Residual speeds for a simple set of bicycle parameters.
A set of parameters corresponding to a bicycle of 2 m length, ridden at 15 km/h, for the basic crossing without obstruction scenario shows that the safety potential of AEB systems for bicycles is even greater than for pedestrians (see ).
Greater speeds and the size of the bicycle require a greater field of view of the sensors (a fact that has been neglected for the pedestrian accident simulation), which needs to be further investigated.
The TTC of initial appearance might also be smaller than needed; when the front point of the bicycle reaches the vehicle path, the rear end is still 2 m away. The bicycle travels around 2 m during the 0.5 s of the system reaction time. To be an unobstructed accident situation, the bicycle center needs to be at least 3 m away from the vehicle path, and for full visibility, a free visible distance of 4 m next to the vehicle path is required. Accident surveys need to confirm that this is found in reality.
This first simulation shows that the simulation model can be used to estimate the potential for bicycle AEB, if the relevant parameters from accidentology are known. It appears that there is significant potential to address bicycle accidents with AEB, even with current AEB systems.
References
- 1968 . The 1968 Vienna Convention on Road Traffic, Article 8 Available at: http://www.unece.org/fileadmin/DAM/trans/conventn/crt1968e.pdf. Accessed May 22, 2013
- Coelingh , E . Decision making and threat assessment for automotive collision avoidance . Paper presented at: InterActive Summer School , Corfu , , Greece July 5
- Cossalter , V. 2002 . Motorcycle Dynamics , Greendale , WI : RDI .
- Feigel , H J . 2012 . Integriertes bremssystem ohne funktionale kompromisse [Integrated brake system without functional compromises] . Automobiltechnische Zeitschrift. , 7–8 : 613 – 617 .
- Franke , U , Gehrig , S and Rabe , C . 2012 . Gefahrenerkennung schneller als der Mensch. Automobiltechnische Zeitschrift [Detection of hazards faster than a human] Vol. 7–8 , 618 – 621 .
- Hoffmann , J. 2008 . Das Darmstädter Verfahren (EVITA) zum Testen und Bewerten von Frontalkollisionsgegenmaßnahmen [The “Darmstadt” Procedure for Testing and Assessment of Frontal Collision Countermeasures] , Düsseldorf , , Germany : VDI-Verlag .
- Mages , M. 2009 . Top-Down-Funktionsentwicklung eines Einbiege- und Kreuzenassistenten [Top-Down Development of Functionality of a Turn-In- and Crossing Assistance System] , Düsseldorf , , Germany : VDI Verlag .
- Rodarius , C , Seiniger , P Baurés , S . 2012 . Pre-crash evaluation . Available at: http://www.assess-project.eu. Accessed May 22, 2013
- Seiniger , P , Bartels , O Unselt , T . Ein validiertes testverfahren für notbremssysteme—ergebnisse des ASSESS-Projekts [A Validated Testing Procedure for Emergency Braking Systems - Results of the ASSESS Project] . Paper presented at: 5th Conference Driver Assistance Systems , München , , Germany May 15–16
- Tiemann , N , Branz , W and Schramm , D . Predictive pedestrian protection—situation analysis with a pedestrian motion model . Paper presented at: 10th International Symposium on Advanced Vehicle Control , Loughborough , , UK August 22–26
- Unselt , T , Mayer , C Chin , E . Assessment of behavioral aspects in integrated safety systems (EU FP7 project ASSESS) . Paper presented at: 22nd Conference on the Enhancement of Safety of Vehicles , Washington , DC June 13–16
- Westhoff , D , Seiniger , P , Fahrenkrog , F and Zlocki , A . 2011 . Legal aspects . Available at: http://www.interactive-ip.eu. Accessed May 22, 2013
- Winner , H . 2012 . “ Frontalkollisionsschutzsysteme [Frontal Collision Protection Systems] ” . In Handbuch Fahrerassistenzsysteme [Handbook Driver Assistance Systems] , Edited by: Winner , H , Hakuli , S and Wolf , G . 522–541 Wiesbaden , , Germany : Vieweg + Teubner .
- Wisch , M , Seiniger , P , Pastor , C , Edwards , M and Visvikis , C . 2013 . Scenarios and weighting factors for pre-crash assessment of integrated pedestrian safety systems . Available at: http://www.aspecss-project.eu. Accessed May 22, 2013