
 ?Mathematical formulae have been encoded as MathML and are displayed in this HTML version using MathJax in order to improve their display. Uncheck the box to turn MathJax off. This feature requires Javascript. Click on a formula to zoom.
ABSTRACT
Objective: Vehicle safety is improving, thus decreasing the number of life-threatening injuries and increasing the need for research in other areas of the body. The current child anthropomorphic test device (ATD) does not have the capabilities or instrumentation to measure many of the potential interactions between the lower extremity and the vehicle interior. A prototype Hybrid III 6-year-old ATD lower extremity (ATD-LE) was developed and contains a tibia load cell and a more biofidelic ankle. The repeatability of the device has not yet been assessed; thus, the objective was to evaluate the repeatability of the ATD-LE. Additionally, a dynamic assessment was conducted to quantify injury threshold values.
Methods: A pneumatic ram impactor was used at 2 velocities to evaluate repeatability. The ATD-LE was fixed to a table and impacted on the plantar aspect of the forefoot. Three repeated trials at 1.3 and 2.3 m/s without shoes and 2.3 m/s with shoes were conducted. The consistency of tibia force (N), bending moment (Nm), ankle range of motion (ROM, °), and stiffness (Nm/°) were quantified. A dynamic assessment using knee bolster airbag (KBA) tests was also conducted. The ATD-LE was positioned to mimic 3 worst-case scenarios: toes touching the mid-dashboard, touching the lower dashboard, and flat on the floor prior to airbag deployment. The impact responses in the femur and tibia were directly collected and compared with published injury threshold values.
Results: Ram impact testing indicated primarily excellent repeatability for the variables tested. For all 3 conditions the coefficients of variance (CV) were as follows: tibia force, 1.9–2.7%; tibia moment, 1.0–2.2%; ROM, 1.3–1.4%; ankle stiffness, 4.8–15.6%. The shoe-on condition resulted in a 25% reduction in tibia force and a 56% reduction in tibia bending moment. The KBA tests indicate that the highest injury risk may be when the toes touch the lower dashboard, due to the high bending moments recorded in the tibia at 76.2 Nm, which was above the injury threshold.
Conclusions: The above work has demonstrated that the repeatability of the ATD-LE was excellent for tibia force, bending moment, and ankle ROM. The ATD-LE has the ability to provide new information to engineers and researchers due to its ability to directly evaluate the crash response of the ankle and leg. New information on injury mechanism and injury tolerance may lead to injury reduction and thus help advance the safety of children.
Introduction
Pediatric survival rates from motor vehicle crashes (MVCs) have been increasing due to increased safety research in the head, neck, and thorax regions of the body (Durbin Citation2011; NHTSA Citation2012). Therefore, a shift of focus and research to understanding the non-life-threatening injuries in MVCs is necessary. It is estimated that lower extremity injuries account for 17–18% of Abbreviated Injury Scale (AIS) 2+ injuries in all crash configurations in children between 1 and 7 years old (NHTSA Citation2010). Nonfatal lower extremity injuries can cause permanent disability that may lead to a decreased quality of life (Brown et al. Citation2006; Durbin Citation2011; Jermakian et al. Citation2007; NHTSA Citation2012; Winthrop et al. Citation2005). In order to improve our understanding of lower extremity trauma mechanisms, more pediatric biomechanics research is necessary.
The commercially available Hybrid III (HIII) 6-year-old anthropomorphic test device (ATD) lower extremity has
incomplete instrumentation and lacks biofidelity. The HIII 6-year-old lower extremity only has a 6-axis or uniaxial load cell in each femur with no instrumentation below the femur. The ankle in the HIII is a simple clevis joint and does not have biofidelic ROM or stiffness parameters, which may incorrectly transfer loads applied directly to the foot up through the lower extremity kinetic chain. Thus, the loads transferred to the femur and pelvis instrumentation may also be less accurate due to the poor biofidelity of the distal segments of the ATD.
The rear seat lower extremity injury risk in children is related to the fact that children have shorter legs than adults. The legs hang over the child restraint system or vehicle seat and then have potential to swing and collide with the interior of the vehicle, such as the front seatback. If a child is seated improperly in the front passenger seat, the legs are at risk to interact with the vehicle dashboard (Bennett et al. Citation2006; Jermakian et al. Citation2007). Without instrumentation and appropriate biofidelity in the lower extremity of the HIII ATD, studying these interactions between the child's body and the interior of the vehicle is extremely difficult.
A prototype HIII 6-year-old leg (ATD-LE) was developed, which included a tibia load cell and a more biofidelic ankle (Boucher et al. Citation2016). The biofidelity and design functionality of the ATD-LE has only been evaluated until this point. Thus, the objective of the current project was to evaluate the repeatability of the response of the ATD-LE by measuring tibia force (N), tibia bending moment (Nm), ankle range of motion (ROM), and stiffness of the ATD-LE. A secondary objective was to quantify the dynamic response of the ATD-LE by performing knee bolster air bag (KBA) tests using the same protocol from previous work in our lab (Boucher et al. Citation2016) and comparing these data to published injury response thresholds and previously collected data.
Methods
Repeatability testing
Repeatability of the ATD-LE was evaluated using a pneumatic ram impactor, impacting the plantar aspect of the ATD's foot at approximately 1.3 and 2.3 m/s. The pneumatic ram was chosen due to the ability to control the velocity of impact and impact location while simulating a realistic and potentially injurious in real-world position. The ATD-LE was seated in an upright position with its back leaning against a fixed L-stand (Figure A1a, see online supplement). Straps were wrapped around the ATD's abdomen and thighs to minimize unwanted movement during impact. The sole of the right foot of the ATD-LE was hit (with and without shoes) to cause dorsiflexion of the ankle joint. The impact location was 5.1 cm inferior from the highest point of the toes, which ensured that the load was being applied through the plate that forms the base of the foot under the rubber skin (Figure A1b; see online supplement). The posterior tibia was supported at the distal end by a wooden block to ensure that the ATD leg was level and that the heel would not make contact with the ram table during testing. To ensure proper and consistent positioning of the ATD-LE between tests, tape guidelines were placed on the ram table by the heel, tibia, thigh, and back and were checked for alignment prior to each test. The position of the ankle was measured prior to the start of each test using an electro-goniometer. Three scenarios were tested: 1.3 and 2.3 m/s without shoes and 2.3 m/s with shoes. Each scenario was repeated 3 times with a minimum of a 30-min rest between tests. The shoes used during testing were based on specifications from the FMVSS 213 regulation, which states that the Hybrid III 6-year-old ATD should wear oxford-style sneakers in children's size 13M weighing less than 0.43 kg each (NHTSA Citation2014). The ram impactor head included a 15.9-cm metal rod, a 6-axis load cell (model 2944J, Humanetics, Plymouth, MI), and an accelerometer (model 7264C-2K, Endevco, San Juan Capistrano, CA). For impacts at 2.3 m/s, a plastic impactor head was attached to the metal rod for a smoother impact surface, due to the possibility that the metal rod alone would damage the rubber flesh on the sole of the ATD's foot. The velocity of the pneumatic ram was controlled using a regulated pressure valve. Pressures of 60 and 100 psi were used for impact at 1.3 and 2.3 m/s, respectively. Force and velocity data from the ram were recorded using a TDAS G5 (Diversified Technical Systems, Seal Beach, CA). The data from the 6-axis load cell in the ATD's right tibia were recorded using a SLICE PRO (Diversified Technical Systems). A high-speed camera recorded each test at 1,000 frames/s. The videos were then used to calculate the ATD's ankle rotation using TEMA Motion software (Image Systems AB, Linköping, Sweden).
The data from the SLICE PRO and G5 data acquisition systems were filtered with DIAdem (National Instruments, Austin, TX) following SAE J211 (Society of Automotive Engineers Citation1995; CFC600 for the ram load cell, CFC180 for the tibia). The axial force (Fz) and bending moment (My) recorded by the load cell in the tibia, along with the rotation of the ankle joint, were graphed. The coefficient of variation (CV) for the tibia Fz, My and ankle ROM for each scenario were calculated. A CV of 0–5% was considered excellent; 5–8% was considered good; 8–10% was considered marginal; and >10% was considered poor (Rhule et al. Citation2005).
In order to compute stiffness of the ATD-LE ankle, FzRam and FxRam were first obtained from the 6-axis load cell on the ram impactor. FzRam was inertially compensated first. The rotation of the ankle throughout the event was obtained from the high-speed video analysis using TEMA. The rotational torque of the ankle was then calculated using Equation (Equation1(1)
(1) ):
(1)
(1) where FzRam is the inertially compensated ram force in the z direction, dx is the distance from impact point to the ankle joint, FxRam is the ram force in thex direction, θ is the ankle rotation during impact, and MyRam is the ram moment in the y direction.
Stiffness was calculated from the torque (Nm) experienced at the ankle and the ROM (°) of the ankle from Equation (Equation1(1)
(1) ).
Knee bolster airbag tests
ATD position and test setup
To evaluate the durability of the design of the ATD-LE under dynamic conditions as well as to provide a comparison with previous tests, the ATD-LE was seated in the same KBA test setup used in Boucher et al. (Citation2016; ). Instrumentation in the HIII-LE included 6-axis load cells in the right distal femur and bilateral tibiae. A custom test fixture that replicated an Acura MDX instrumentation panel without a car buck was used for the KBA tests. The front passenger seat, dashboard, and airbag modules were mounted and bolted to a steel floor. A Toyota production-level passenger knee airbag (Toyota Part #73990-0E010-CO) was mounted in a position to imitate the Acura MDX airbag deployment site before start of every test.
Table 1. Test matrix for knee bolster airbag tests.
The ATD was positioned in 3 different positions to represent potential worst-case scenarios for injury of the lower extremity in the front passenger seat (). ATD positions in the front seat were chosen based on a report by Powell and Zuby (Citation1999) for the Insurance Institute for Highway Safety and as a continuation of the study by Boucher et al. (Citation2016). Data were collected using a DTS TDAS PRO LAB data acquisition system (Diversified Technical Systems) at a sample rate of 20,000 samples/s. Each test was recorded with a high-speed video camera at a sample rate of 1,000 frames/s.
For each test, 5 parameters were examined: femur axial load (N), femur moment (Nm), tibia axial load (N), tibia moment (Nm), and tibia index. Maximum femur and tibia loads in the z-axis and the maximum femur and tibia moments in the y-axis were reported. The femur and tibia axial loads and moments were obtained directly from the 6-axis load cells. In addition to axial load and bending moments, the tibia index was calculated using the tibia force and the tibia moment data collected and critical values from published data (Ivarsson et al. Citation2003; Mertz and Irwin Citation1993; Mertz et al. Citation2003). For all conditions, the maximum axial forces, bending moments, and tibia indices were compared with the average of the published injury threshold values from Mertz et al. and Ivarsson et al. The tibia index equation is shown in Equation (Equation2(2)
(2) ):
(2)
(2) where M is the resultant bending moment, Mc is the critical internal bending moment to cause failure (74.2 Nm), F is the resultant axial compressive force, and Fc is the critical axial compressive force to cause failure (4.78 kN).
Results
Repeatability tests results
Series 1—Impact at 1.3 m/s without shoes
When the impactor hit the plantar aspect of the forefoot, the ankle joint rotated into dorsiflexion. The dorsiflexion bumpers did not engage for the first 15°. The bumper engaged at approximately 0.07 s after impact and the ROM angle peaked with a mean ankle dorsiflexion ROM of 42° with a CV of 1.4%, indicating excellent dorsiflexion repeatability. At maximum dorsiflexion, the mean peak force was 638 N with a CV of 2.3%, indicating excellent repeatability (Figure A2a, see online supplement). The mean bending moment was 1.24 Nm with a CV of 2.2% (Figure A2b), again demonstrating excellent repeatability. The mean calculated stiffness was 1.04 Nm/° with a CV of 15.61%, indicating poor repeatability. However, the stiffness was calculated from a variety of variables, including ram load, moment, impact location distance, and the ROM, thus introducing more variables into the equation. In contrast, the axial load, bending moment, and ROM were obtained directly from the tibia load cell and TEMA analysis. A summary of series 1 repeatability tests is shown in Table A1 (see online supplement).
Series 2—Impact at 2.3 m/s without shoes
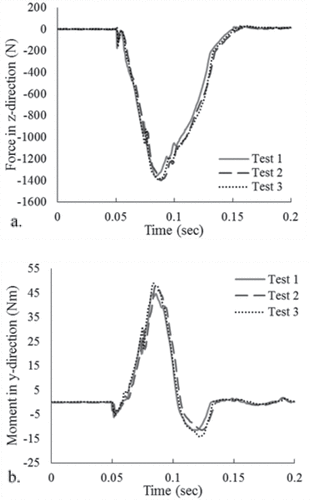
The axial load response in the tibia was repeatable throughout all 3 tests in this series. Mean peak dorsiflexion ROM was 45° with a CV of 1.3%, indicating excellent repeatability. Mean tibia peak force was 1,355 N with a CV of 1.9% (), and the mean bending moment was 47.18 Nm with a CV of 2.2% (). The mean stiffness was 2.78 Nm/° with a CV of 4.1%, indicating excellent repeatability. The stiffness is improved from series 1 but demonstrates less repeatability than axial load, bending moment, and ROM (Table A1).
Figure 1. (a) Series 2: Tibia axial load repeatability. (b) Series 2: Tibia bending moment repeatability.
Series 3—Impact at 2.3 m/s with shoes
The mean peak ROM was 45° with a CV of 1.3%, indicating excellent repeatability. Mean peak force of 1,024 N was reached at maximum ROM, with a CV of 2.7% (Figure A3a, see online supplement). The mean peak tibia bending moment was 20.88 Nm with a CV of 1.0% (Figure A3b), which was lower than the mean bending moment of 47.18 Nm recorded in test series 2. The mean stiffness for series 3 was 3.02 Nm/° with a CV of 5.8%, indicating good repeatability. A summary of series 3 repeatability tests is provided in Table A1.
Knee bolster airbag test results
Results from all 5 of the KBA tests will be presented in the Results section. A high-speed video screenshot for each scenario is provided in Figure A4 (see online supplement). The tibia peak axial loads (Fz), bending moments (My), tibia index, and ankle ROM data will be discussed. The femur data are reported only in and are not elaborated on further, because they are not a focus of this specific research question.
Table 2. KBA test summary of forces (N), moments (Nm), and tibia index.
KBA tests 025 and 026—ATD-LE toes on the mid-dashboard
A frame capture image of KBA test 025 is pictured in Figure A4 (see online supplement). In KBA test 025 the airbag deployed around 0.01 s, making initial contact at the heel of the ATD-LE. The foot of the ATD-LE was engulfed by the airbag at 0.02 s. The peak axial loading of the tibia occurred at 0.01 s, with values for the right and left tibia of 1,660 and 1,480 N, respectively. Both values were under the injury threshold of 2,400 N. The peak tibia bending moments occurred at 0.02 s, recording 25.1 and 34.2 Nm for right and left tibia, respectively. The maximum moments were also below the injury threshold value of 57.6 Nm. Maximum ROM of 45° was reached at approximately 0.025 s. The tibia index was also below the injury threshold ().
KBA test 026 followed the same setup as test 025. Peak axial loading of the tibiae occurred at 0.01 s, with forces of 1,800 and 1,137 N for the right and left tibia, respectively. The peak tibia bending moments occurred at 0.02 s with values of 37.9 and 24.9 Nm for right and left tibia. The maximum ROM of 45° was reached around 0.025 s. Again, the tibia index was below the injury threshold ().
KBA tests 027 and 028—ATD-LE toes on the lower dashboard
A frame capture of KBA test 027 is included in Figure A4 (see online supplement). In KBA test 027 the airbag deployed around 0.01 s, with maximum dorsiflexion at 0.03 s. Peak tibia axial loading occurred at 0.015 s with values of 436 and 702 N for the right and left tibia, respectively. Peak tibia bending moments occurred at 0.019 s with values of 61.7 Nm (right tibia) and 75.9 Nm (left tibia), which were above the injury threshold value of 57.6 Nm. The airbag impact was at the forefoot in this scenario and resulted in less direct axial force to the tibia and more rotational force through ankle dorsiflexion, which was seen with higher tibia bending moments when compared to tests 025 and 026. The maximum tibia indexes for the right and left legs were 0.9 and 1.2, respectively. The tibia index values were almost at and just over the injury threshold value of 1.1 ().
KBA test 028 followed the same test setup as test 027 with similar results. Interestingly, during airbag deployment the impact of the airbag caused the right shoe to slide off of the foot around 0.025 s. Friction from the airbag caused an upward displacement of the shoe, sliding it off of the ATD's heel and then subsequently off of the foot. The forces and moments recorded from the right leg were less than those for the left leg, with forces of 237 N (right) and 640 N (left) and moments of 49.4 Nm (right) and 76.2 Nm (left). The tibia moment recorded in the left leg was similar to that for test 027. Tibia index values for the right and left legs were 0.7 and 1.2, respectively (). The right leg was under the injury threshold, likely due to the shoe falling off. The left leg was over the tibia index threshold, which was in line with test 027.
KBA test 029—ATD-LE seated on the edge of the front seat with feet flat on the floor
A frame capture image of KBA test 029 is included in Figure A4 (see online supplement). The airbag deployed again around 0.01 s, with full airbag deployment by 0.02 s. The peak axial forces in the right and left tibia were 506 and 536 N, respectively (Figure A4). Again, the tibia forces peaked around 0.02 s during the full deployment of the airbag. The peak bending moments in the tibiae were 3.6 and 7.0 Nm for right and left sides, respectively, below the injury threshold of 57.6 Nm. No ankle rotation was present in this scenario, so ROM was not reported. The tibia index values were well below the threshold ().
Discussion
The primary objective of this study was to quantify the repeatability of the ATD-LE, because the consistency of the response of the prototype leg has not previously been assessed. All 3 repeatability test scenarios (no shoes at 1.3 m/s, no shoes at 2.3 m/s, and shoes on at 2.3 m/s) indicated excellent repeatability for force, moment, and ankle ROM in the ATD-LE with a maximum coefficient of variance of 2.7%. Additionally, the ATD-LE performed well during the KBA tests, demonstrating that toes on lower dashboard scenario may pose the greatest risk of injury due to the combined mechanism of axial loading and dorsiflexion, because this was the only scenario with values that exceed injury threshold for tibia moment and tibia index.
For the repeatability tests, the forces and moments were greater with increased velocity (1.3 vs. 2.3 m/s) between the no-shoe conditions (series 1 and series 2). In series 3 (2.3 m/s with shoes) there was an approximately 25% decrease in the force recorded by the tibia load cell from 1,355 N without shoes to 1,024 N with shoes on. Mean peak tibia bending moment in series 3 with shoes on was 20.88 Nm, which is 56% lower than the mean bending moment of 47.18 Nm recorded in series 2 without shoes, yet the foot was impacted at the same speed. The dorsiflexion ROM remained the same in both series 2 and series 3 at 45° regardless of the shoe condition. Such a decrease in force and moment between the 2 conditions demonstrates that the shoes play a significant role in the response if the force is initiated through the plantar surface of the foot. The test setup (i.e., not allowing the knees to bend during impact) may have unrealistically inflated the influence of the shoes on the response; thus, such drastic reductions in force and moment may not be seen in a more realistic test setup. Further studies evaluating the influence of the shoes are warranted.
The greatest variance was seen in the calculated stiffness values, with a CV range of 4.10 to 15.61%. This was the only value manually calculated out of all of the reported data; thus, it is not surprising to see increased variability of these values. The stiffness values also increased with an increase in the velocity of the ram testing, with a mean stiffness of 1.04 Nm/° at 1.3 m/s and 2.78 Nm/° and 3.02 Nm/° at 2.3 m/s. The stiffness rate dependency is an interesting finding and may warrant additional investigation to fully characterize the response of the stiffness bumpers, because this is the first time stiffness has been calculated for the ATD-LE during a dynamic event.
The KBA tests continued to demonstrate that the position with the most injury potential was with the toes on the lower dashboard, which forced the ankle into dorsiflexion with an accompanying axial load. This is a consistent finding with previous KBA testing (Boucher et al. Citation2016). The least injurious position was seen in KBA test 029, with the feet flat on the floor. This test scenario was dependent on the distance away from where the airbag was deployed. If the ATD-LE was positioned closer, higher loads would be expected; however, it is unknown whether the values would exceed injury threshold. The shoe also played an interesting role during the KBA tests, where in test 028, the right shoe of the ATD-LE fell off during the testing, bringing into question the fit of the shoes. The footwear utilized was in accordance with federal recommendations (NHTSA Citation2014), yet the shoes do not fit the ATD's foot well, because the shoe is the proper width but too long for the current ATD design.
When comparing the injury parameters from the current KBA tests to the previous tests (Boucher et al. Citation2016), the values in the current study on average are less than the values in the previous work. Even though every attempt was used to replicate the previous test setup, it is likely that the airbag impacted the heel and the forefoot of the ATD-LE in slightly different locations, which would cause the amount of tibia axial load versus the amount of dorsiflexion and subsequent bending moment to be slightly different. The tibia index values were also consistently lower in the current study but followed the same trends as in the previous work. The current study found tibia moment and tibia index values over the injury threshold for the left leg only when the toes were positioned on the lower dashboard scenario (tests 027 and 028). The previous study by Boucher et al. (Citation2016) found tibia moment and tibia index values over injury threshold in scenarios with the ATD's toes on both the mid-dashboard and on the lower dashboard. Some of the discrepancies in the results between the 2 studies could be due to the improved ankle ROM in the ATD-LE used in the current study, because a small modification was made to improve biofidelity prior to the current study.
Although the current study continues to show promising results of the ATD-LE, there were a number of limitations. The repeatability was excellent in the scenarios evaluated; however, performing more tests in each condition would have been ideal. The ATD-LE design does not yet have a standard calibration of the ankle screw. The ankle screw likely partially contributed to the ankle stiffness, because it acts as the hinge between the foot and the tibia. The ankle screw was not altered between tests; thus, the tightness of the screw should be consistent for all tests. Standardizing the calibration of the ankle screw should be performed to better standardize the response of the ankle in future work. We also acknowledge that the test setup for the repeatability tests did not allow movement of the knee or hip of the ATD, which would have been a more realistic response. However, the test setup was intentionally designed to isolate the ankle for the purposes of only evaluating the consistency of the response at the ankle. For the KBA tests, all efforts were made to ensure the same test setup as in previous work, but it must be acknowledged that there were likely slight differences in ATD positioning and spacing relative to the dashboard. Additionally, the KBA setup is stationary and does not account for the additional acceleration of the child that would take place in a real-life crash. Future studies should include the acceleration of the ATD in addition to airbag deployment.
In conclusion, the objective of this project was to document the consistency in the response of the ATD-LE. The results demonstrate that the ATD-LE does respond consistently in axial loading, bending moment, and ROM response. Directly evaluating the crash response of the ATD ankle and leg will provide new information on the interaction of the child with the vehicle interior, insight into possible mechanisms causing injury, and a deeper understanding of injury tolerance in the future.
Funding
This research was supported by the Center for Child Injury Prevention Studies (CChIPS).
Appendices
Download Zip (637.6 KB)Acknowledgments
The authors acknowledge Honda R&D Americas for providing the facilities and support for the knee bolster airbag testing and the students and staff in the Injury Biomechanics Research Center for assistance with the repeatability testing. Lastly, the authors acknowledge the National Science Foundation (NSF) Center for Child Injury Prevention Studies at the Children's Hospital of Philadelphia (CHOP) and the Ohio State University (OSU) for sponsoring this study and its Industry Advisory Board (IAB) members for their support, valuable input, and advice. The views presented are those of the authors and not necessarily the views of CHOP, OSU, the NSF, or the IAB members.
Related Research Data
References
- Bennett TD, Kaufman R, Schiff M, Mock C, Quan L. Crash analysis of lower extremity injuries in children restrained in forward-facing car seats during front and rear impacts. J Trauma. 2006;61(3):592–597.
- Boucher LC, Bing J, Bolte JH. Biofidelity evaluation of a prototype Hybrid III 6-year-old ATD lower extremity. Ann Biomed Eng. 2016;44:2794–2804.
- Brown JK, Jing Y, Wang S, Ehrlich PF. Patterns of severe injury in pediatric car crash victims: Crash Injury Research Engineering Network database. J Pediatr Surg. 2006;41:362–367.
- Durbin, D. American Academy of Pediatrics technical report—child passenger safety. Pediatrics. 2011;127:e1050–e1066.
- Ivarsson BJ, Crandall JR, Longhitano D, Okamoto M. Lateral Injury Criteria for the 6-Year-Old Pedestrian—Part II: Criteria for the Upper and Lower Extremities. SAE International; 2003. Paper No. 2004:01-1755. doi:10.4271/2004-01-1755.
- Jermakian JS, Locey CM, Haughey LJ. Lower extremity injuries in children seated in forward facing child restraint systems. Traffic Inj Prev. 2007;8(2):171–179.
- Mertz HJ, Irwin AL. Anthropomorphic Test Devices and Injury Risk Assessments. Accidental Injury: Biomechanics and Prevention. New York, NY: Springer; 1993.
- Mertz HJ, Irwin AL, Prasad P. Biomechanical and scaling bases for frontal and side impact injury assessment reference values. Stapp Car Crash J. 2003;47:155–188.
- NHTSA. Children Injured in Motor Vehicle Traffic Crashes. US Department of Transportation; 2010. DOT HS 811 325. Available at: https://crashstats.nhtsa.dot.gov
- NHTSA. Traffic Safety Facts 2012. Washington, DC: US Department of Transportation; 2012. DOT HS 812 032.
- NHTSA. Laboratory Test Procedure for FMVSS 213 Child Restraint Systems. Washington, DC: US Department of Transportation. 2014. TP-213-10, 12.D.4.4.
- Powell MR, Zuby DS. Testing of Passenger Airbags with 6-Year-Old Hybrid III Dummy to Assess Injury Risk to Belted Children. Arlington, VA: Insurance Institute for Highway Safety; 1999.
- Rhule D, Rhule H, Donnelly B. The Process of Evaluation and Documentation of Crash Test Dummies for Part 572 of the Code of Federal Regulations. Washington, DC: NHTSA: 2005.
- Society of Automotive Engineers. Instrumentation for Impact Test, Part 1, Electronic Instrumentation. Washington, DC: US Department of Transportation; 1995. SAE J211-1.
- Winthrop AL, Brasel KJ, Stahovic L, Paulson J, Schneeberger B, Kuhn EM. Quality of life and functional outcome after pediatric trauma. J Trauma. 2005;58:468–474.