
 ?Mathematical formulae have been encoded as MathML and are displayed in this HTML version using MathJax in order to improve their display. Uncheck the box to turn MathJax off. This feature requires Javascript. Click on a formula to zoom.
Abstract
Objective: This study aimed to investigate the situational characteristics of fatal pedestrian accidents involving vehicles traveling at low speeds in Japan. We focused on vehicles with 4 or more wheels. Such characteristics included daytime or nighttime conditions, road type, vehicle behaviors preceding the accident, and vehicle impact locations.
Methods: Pedestrian fatality data on vehicle–pedestrian accidents were obtained from the Institute for Traffic Accident Research and Data Analysis of Japan (ITARDA) from 2005 to 2014. Nine vehicle classifications were considered: Trucks with gross vehicle weight (GVW) ≥7.5 tons and <7.5 tons, buses, box vans, minivans, sport utility vehicles (SUVs), sedans, light passenger cars (LPCs), and light cargo vans (LCVs). We compared the situational daytime or nighttime conditions, road type, vehicle behaviors preceding the accident, and vehicle impact locations for accident-involved vehicles traveling at low and higher speeds across all vehicle types.
Results: The results indicate that pedestrian fatalities involving vehicles traveling at low speeds occurred more often under daytime conditions across all vehicle types. At signalized intersections, the relative proportions of pedestrian fatalities were significantly higher when vehicles were traveling at low speed, except when the accidents involved box vans or SUVs. Similarly, when vehicles turned right, the relative proportions of pedestrian fatalities were significantly higher when vehicles traveling at low speed were involved across all vehicle types. In terms of the frontal right vehicle impact location, the relative proportions of pedestrian fatalities were significantly higher when trucks with GVW ≥7.5 tons or <7.5 tons, sedans, or LCVs traveling at low speed were involved.
Conclusions: The situational characteristics of fatal pedestrian accidents involving vehicles traveling at low speeds identified in this study can guide targeted development of new traffic safety regulations or technologies specific to vehicle–pedestrian interactions at low vehicle travel speeds (i.e., driver alert devices or automated emergency braking systems). Ultimately, these developments can improve pedestrian safety by reducing the frequency or severity of vehicle–pedestrian accidents for vehicles turning right at intersections and/or reducing the number of resultant pedestrian fatalities.
Introduction
In 2017, 3,694 traffic deaths occurred in Japan; 37% of these deaths (1,347) were pedestrians (Institute for Traffic Accident Research and Data Analysis of Japan [ITARDA] 2018). In an effort to reduce pedestrian casualties in traffic accidents in Japan, countermeasures such as grade separation and speed calming have been implemented. In 2005, the Japanese Ministry of Land, Infrastructure, Transport and Tourism began assessing the safety performance of passenger car bonnet tops using headform impactors to further reduce pedestrian casualties (Matsui and Tanahashi Citation2004); these tests were conducted in accordance with guidelines now contained in the Automobile Type Approval Handbook for Japanese Certification (Japan Automobile Standards Internationalization Center [JASIC] 2015b). These vehicle safety regulations applied to bonnet-type passenger cars such as sedans, minivans, and light passenger cars (LPCs) with gross vehicle weight (GVW) ≤3.5 tons. Additional countermeasures are necessary to further reduce pedestrian fatalities for accidents involving other vehicle types, such as trucks and buses. A thorough identification and understanding of the situational characteristics of fatal pedestrian accidents is also required.
Vehicle impact speed is a key situational characteristic that affects the frequency of pedestrian fatalities in vehicle– pedestrian accidents (Anderson et al. Citation1997; Davis Citation2001; Kong and Yang Citation2010; Matsui et al. Citation2016; Oh et al. Citation2008; Rosen and Sander Citation2009). Collision mitigation systems (CMSs) use sensors to detect pedestrians that appear in front of a vehicle and automated braking to reduce vehicle speeds ahead of impact. Vehicles equipped with CMSs are available worldwide (Behera et al. Citation2015; Kuzumaki Citation2009; Ljung et al. Citation2015; Makabe Citation2012; Shibata Citation2009). CMSs can be operated when vehicles are traveling straight ahead at a normal travel speed (e.g., 50 km/h) while pedestrians are crossing a road. Nonetheless, pedestrian fatalities persist at lower vehicle travel speeds (Matsui et al. Citation2016), suggesting differences in situational characteristics when vehicles are traveling at low and higher speeds. Moving backward is considered one of the vehicle maneuvers that require low vehicle travel speeds. In the United States, Kahn (Citation2009) estimated that 292 vulnerable road users are killed annually in accidents with reversing drivers and another 18,000 are injured. However, a comparison of situational characteristics of fatal pedestrian accidents at low speeds and higher speeds has not yet been clarified.
This study aims to identify the situational characteristics of fatal pedestrian accidents involving vehicles traveling at low speeds in Japan. In the present study, we focused on vehicles with 4 or more wheels. The characteristics include daytime or nighttime conditions, road type, vehicle behaviors preceding the accident, and vehicle impact locations.
Methods
With a focus on vehicle–pedestrian accidents, pedestrian fatality data from 2005 to 2014 were obtained from ITARDA. The ITARDA database includes traffic accident data such as vehicle travel speeds, injury severity levels, vehicle behaviors preceding the accident, and vehicle impact locations throughout Japan. In this database, a vehicle–pedestrian accident was considered fatal if the pedestrian died within 24 h of the accident. Furthermore, in this database, daytime is defined as the time from sunrise to sunset based on the event times reported in the Chronological Science Tables maintained by the National Astronomical Observatory of Japan (Citation2017). The vehicle travel speed is rounded off to multiples of 10 km/h; for example, 15–24 km/h is coded as 20 km/h. Furthermore, 75% of fatal pedestrian accidents involving vehicle maneuvers including “initiating forward movement,” “turning right,” “turning left,” and “moving backward” occurred at a coded travel speed of 20 km/h (see , online supplement). In the present study, we focused on fatal pedestrian accidents involving vehicles traveling at low speeds coded as 20 km/h or less (≤24 km/h).
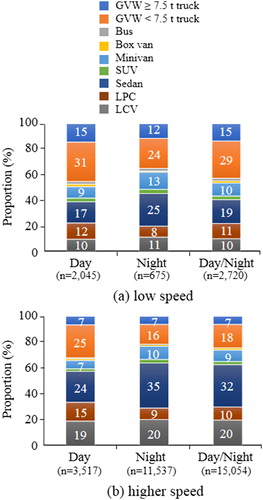
Figure 1. Pedestrian fatalities (n = 17,774) under daytime, nighttime, and 24-h conditions involving vehicles traveling at (a) low (n = 2,720) and (b) higher (n = 15,054) speeds.
Nine vehicle classifications were considered: Trucks with GVW ≥7.5 tons and <7.5 tons, buses, box vans, minivans, sport utility vehicles (SUVs), sedans, LPCs, and light cargo vans (LCVs). Box vans are unique in that they have no hoods; their engines are installed beneath the cabin. Minivans, SUVs, sedans, and LPCs have hoods and engine displacements >660 cc. In general, minivans are designed to have higher roofs and shorter hoods than sedans. Specific to Japan, LPCs and LCVs are light vehicles with engine displacements ≤660 cc.
Across all vehicle types, we compared the situational daytime or nighttime conditions, road type, vehicle behaviors preceding the accident, and vehicle impact locations for accident-involved vehicles traveling at low (≤24 km/h) and higher (≥25 km/h) speeds. First, we investigated the relative proportions of pedestrian fatalities across the 9 vehicle types traveling at low and higher speeds under daytime and nighttime conditions and for the entire day (24 h). According to the high proportion of pedestrian fatalities involving low-speed vehicles occurring under daytime conditions, subsequent investigations of the road type, vehicle behavior preceding the accident, and vehicle impact location characteristics considered only daytime conditions.
Four classifications were used to assess the effects of road type on pedestrian fatalities: signalized intersections, unsignalized intersections, roads near an intersection, and straight roads. A road was considered to be near an intersection if it was within 30 m of the painted crosswalk’s outer line for intersections with a crosswalk or the corner of the intersection for intersections without a crosswalk. We compared the relative proportions of pedestrian fatalities involving vehicles traveling at low and higher speeds across these 4 road types.
Five classifications (consistent with data available in the ITARDA database) were used to assess the effects of vehicle behaviors preceding the accident on pedestrian fatalities: Initiating forward movement, traveling straight ahead, turning right, turning left, and moving backward. Again, we compared the relative proportions of pedestrian fatalities involving vehicles traveling at low and higher speeds across these 5 vehicle behaviors.
Finally, 6 classifications were used to assess the effects of vehicle impact location on pedestrian fatalities: frontal center, frontal right, frontal left, right side, left side, and rear end. We compared the relative proportions of pedestrian fatalities involving vehicles traveling at low and higher speeds across these 6 vehicle impact locations.
Statistical tests were used to confirm the differences in the relative proportions of pedestrian fatalities between vehicles traveling at low and higher speeds at the time of the accident, where the differences in the distribution of fatalities were investigated by conducting 2-tailed statistical tests of the sample rates. The null hypothesis was that there is no significant difference between the distributions for the 2 vehicle speed ranges. The statistical parameter Z is defined as given in EquationEq. (1)(1)
(1) . When Z in the statistical test is defined by Eq, (1) it follows a normal distribution.
(1)
(1)
where
(2)
(2)
M and N are the total number (e.g., daytime plus nighttime) of pedestrian fatalities at low speed (M) and higher speed (N), respectively, according to the vehicle type, and m and n are the number (e.g., daytime) of pedestrian fatalities at low speed (m) and higher speed (n), respectively.
Results
In Japan, 17,774 pedestrian fatalities occurred between 2005 and 2014 as a result of vehicle–pedestrian accidents, corresponding to 99.7% of the total pedestrian fatalities (17,835; ITARDA 2018). The remaining 0.3% fatalities involved powered 2-wheelers and bicycles. For each of these accidents, we investigated the situational characteristics including daytime or nighttime conditions, road type, vehicle behaviors preceding the accident, and vehicle impact locations.
Pedestrian fatalities under daytime and nighttime conditions
shows a comparison of the relative proportions of pedestrian fatalities involving vehicles traveling at low and higher speeds under daytime, nighttime, and 24-h conditions. Under daytime conditions, 2,045 and 3,517 pedestrian fatalities occurred involving vehicles traveling at low and higher speeds, respectively. During the entire day (24 h), these numbers increased to 2,720 and 15,054 pedestrian fatalities involving low- and higher speed vehicles, respectively. Because 75% (2,045/2,720) of pedestrian fatalities involving low-speed vehicles occurred under daytime conditions, subsequent investigations of the road type, vehicle behavior preceding the accident, and vehicle impact location characteristics considered only daytime conditions.
provides a more detailed comparison of the pedestrian fatalities involving low- and higher speed vehicles under daytime and 24-h conditions. Across all vehicle types, the rates of pedestrian fatalities involving low-speed vehicles were significantly higher than the rates of fatalities involving higher speed vehicles.
Table 1. Pedestrian fatalities involving low- and higher speed vehicles under daytime and 24-h conditions.Table Footnotea
Daytime pedestrian fatalities according to road type
presents a comparison of the daytime pedestrian fatalities involving low- and higher speed vehicles at signalized intersection. Comparisons for other road types are shown in (see online supplement). At signalized intersections, the relative proportions of pedestrian fatalities involving low-speed vehicles were significantly higher than the proportions of fatalities involving higher speed vehicles across all vehicle types, with the exception of box vans and SUVs. Conversely, at unsignalized intersections, the relative proportions of pedestrian fatalities involving low-speed vehicles were significantly lower than the proportions of fatalities involving higher speed vehicles for trucks with GVW <7.5 tons, sedans, and LPCs. Near intersections, no significant differences between pedestrian fatalities involving low- and higher speed vehicles were confirmed. On straight roads, the relative proportions of pedestrian fatalities involving low-speed vehicles were significantly lower than the proportions of fatalities involving higher-speed vehicles across all vehicle types, with the exception of buses.
Table 2. Daytime pedestrian fatalities involving low- and higher speed vehicles at signalized intersections.
Daytime pedestrian fatalities according to preceding vehicle behavior
presents a comparison of the daytime pedestrian fatalities involving low- and higher speed vehicles for vehicles turning right. Comparisons for other vehicle behaviors are shown in (see online supplement). For vehicles initiating forward movement, the relative proportions of pedestrian fatalities involving low-speed vehicles were significantly higher than the proportions of fatalities involving higher speed vehicles across all vehicle types with reported fatality involvement (no fatalities were reported involving buses, box vans, SUVs, or LPCs traveling at higher speeds). Conversely, for vehicles traveling straight ahead, the relative proportions of pedestrian fatalities involving low-speed vehicles were significantly lower than the proportions of fatalities involving higher speed vehicles across all vehicle types. For vehicles moving backward, the relative proportions of pedestrian fatalities involving low-speed vehicles were significantly higher than the proportions of fatalities involving higher-speed vehicles for trucks with GVW <7.5 tons, sedans, and LCVs.
Table 3. Daytime pedestrian fatalities involving low- and higher speed vehicles for vehicles turning right.
For vehicles turning right, the relative proportions of pedestrian fatalities involving low-speed vehicles were significantly higher than the proportions of fatalities involving higher speed vehicles across all vehicle types. Similarly, for vehicles turning left, the relative proportions of pedestrian fatalities involving low-speed vehicles were significantly higher than the proportions of fatalities involving higher speed vehicles across all vehicle types with the exception of box vans, SUVs, and vehicles with no reported fatality involvement (no fatalities were reported involving trucks with GVW ≥7.5 tons or buses traveling at higher speeds).
Daytime pedestrian fatalities according to vehicle impact location
presents a comparison of the daytime pedestrian fatalities involving low- and higher speed vehicles for the frontal right vehicle impact location. Comparisons for other vehicle impact locations are shown in (see online supplement). For the frontal center vehicle impact location, the relative proportions of pedestrian fatalities involving low-speed vehicles were significantly lower than the proportions of fatalities involving higher speed vehicles for trucks with GVW ≥7.5 tons, trucks with GVW <7.5 tons, minivans, and sedans. Similarly, for frontal left vehicle impact location, the relative proportions of pedestrian fatalities involving low-speed vehicles were significantly lower than the proportions of fatalities involving higher speed vehicles across all vehicle types, with the exception of buses. Conversely, for the frontal right vehicle impact location, the relative proportions of pedestrian fatalities involving low-speed vehicles were significantly higher than the proportions of fatalities involving higher speed vehicles for trucks with GVW ≥7.5 tons, trucks with GVW <7.5 tons, sedans, and LCVs.
Table 4. Daytime pedestrian fatalities involving low- and higher speed vehicles for frontal right vehicle impact location.
Discussion
Our results indicate that a high relative proportion (average for all vehicle types: 45%) of pedestrian fatalities involving vehicles traveling at low speeds occurred at signalized intersections ( and A1). In Japan, when an intersection’s traffic lights are green, vehicles and pedestrians move simultaneously. A typical vehicle–pedestrian scenario at a signalized intersection is shown in Figure A2 (see online supplement). In such a scenario, a vehicle turning left or right may interfere with or impact a pedestrian crossing the road.
In addition, our results indicate that a high relative proportion (average for all vehicle types: 55%) of pedestrian fatalities involving vehicles traveling at low speeds occurred when vehicles were turning right ( and A2). A driver turning right at a signalized intersection may be focused more on the cross-traffic approaching their vehicle than a pedestrian crossing the road.
These combined situational characteristics point to several possible safety-related countermeasures. The vehicle travel speed at signalized intersections can be considered higher than that at nonsignalized intersections. In terms of the traffic situation at signalized intersection, Suzuki et al. (Citation2011) reported that the average travel velocity of vehicles turning right is 20.7 km/h (SD = 6.9 km/h) and the average travel velocity of vehicles turning left is 18.6 km/h (SD = 8.3 km/h) for roads with 3 lanes in one direction. The average velocities correspond to low speed (≤24 km/h) in the present study. Unless a driver is aware of vulnerable road users in a zebra zone, he or she will not perform braking operation. Infrastructure-based countermeasures may include separate green light indications for vehicles and pedestrians to limit their interactions at signalized intersection. In-vehicle countermeasures may include driver alert devices or automated emergency braking systems that prevent pedestrian impacts. To implement such in-vehicle countermeasures, particularly during right turns, further research on vehicle and pedestrian behaviors and paths of motion is needed.
Our results also indicate higher relative proportions of pedestrian fatalities involving trucks with GVW ≥7.5 tons (29%) and buses (44%) traveling at low speeds when initiating forward movement (). In a previous study, we found that the risk of pedestrian fatality following a low-speed (10 km/h) impact was higher for trucks with GVW ≥7.5 tons than for other vehicle types (e.g., 10% risk for trucks vs. 0% risk for sedans; Matsui et al. Citation2016). A truck’s speed when initiating forward movement may approach this 10 km/h impact speed. Large trucks are also limited in their deceleration capabilities. The maximum deceleration for heavy-duty trucks (GVW of 20 tons) during emergency braking is 6–7 m/s2 (Hashimoto et al. Citation2008), whereas that of sedans is 8.5 m/s2 (Matsui et al. Citation2011).
Trucks and buses also experience more limited visibility. In Japan, vehicle types that do not allow drivers to directly see pedestrians or cyclists in front of their vehicles require the installation of 3 additional mirrors to improve a driver’s visibility around the vehicle: Right and left side mirrors to view both sides of the vehicle and an additional front mirror to view the front of the vehicle (JASIC 2015a). Checking all 3 mirrors is time-consuming; the driver may not see a pedestrian that appears suddenly in front of a vehicle even when using the mirrors.
Lastly, our results indicate differences in the situational characteristics of fatal pedestrian accidents involving vehicles traveling at low and higher speeds. As such, efforts to develop countermeasures intended to decrease pedestrian fatalities should consider the vehicle travel speed as an important factor.
Few existing countermeasures (in the form of vehicle safety regulations) directly address pedestrian fatalities involving vehicles traveling at low speeds. In Japan, an additional front mirror is mandatory for all vehicle types that experience limited visibility directly in front of the vehicle to prevent accidents when initiating forward movement (JASIC 2015a). In the United States, a backup camera monitor is mandatory for trucks with GVW ≤4,536 kg (approximately 4.5 tons) to prevent accidents involving reversing drivers (NHTSA Citation2009). In addition, a new international regulation regarding rearview mirror requirements has been discussed by an informal working group of the United Nations Economic Commission for Europe (Citation2018) focused on vulnerable road users who travel close to low-speed vehicles. The situational characteristics of fatal pedestrian accidents involving vehicles traveling at low speeds identified in this study can guide the targeted development of new traffic regulations or traffic safety technologies specific to vehicle–pedestrian interactions at low vehicle travel speeds (i.e., driver alert devices or automated emergency braking systems). Ultimately, these developments can improve pedestrian safety by reducing the frequency or severity of vehicle–pedestrian accidents for vehicles turning right at intersections and/or reducing the number of resultant pedestrian fatalities. Further research regarding vehicle and pedestrian behaviors and paths of motion is needed before implementing any in-vehicle countermeasures.
We referred to the vehicle travel speed in the ITARDA database for the present analyses. The assessment of vehicle travel speed in the ITARDA database was made by a police officer. Therefore, a limitation of this study is that the method of calculating the vehicle travel speed in the ITARDA database has not been disclosed by the Japanese police department. In the present study, we compared the distribution of situational daytime or nighttime conditions for accident-involved vehicles traveling at low and higher speeds. The boundary between the 2 speed ranges was 24 km/h. For instance, 5% of the travel speed of 24 km/h corresponds to approximately 1 km/h. Matsui et al. (Citation2013) investigated the number of pedestrian fatalities for every 10 km/h of coded traveling speeds; they showed that the distribution of pedestrian fatalities (19 pedestrians) in Japan in 2009 due to impacts with sedans at coded speeds of 20 km/h (15–24 km/h) was 4.2% out of 457. For this speed range (15–24 km/h), the distribution of pedestrian fatality for every 1 km/h of coded travel speed corresponds to 0.4% of the total (457) pedestrian fatalities. Thus, a 5% error in the travel speed will not affect the current results considering the significant difference between low and higher speed distributions.
Supplemental Material
Download Zip (510.8 KB)Additional information
Funding
Related Research Data
References
- Anderson RWG, McLean AJ, Farmer MJB, Lee BH, Brooks CG. . Vehicle travel speeds and the incidence of fatal pedestrian crashes. Accid Anal Prev. 1997;29:667–674.
- Behera R, Gangadharan J, Kutty K, Nair S, Vaidya V. . A novel method for day time pedestrian detection. SAE Int J Passeng Cars Electron Electr Syst. 2015;8(2):406–412.
- Davis G. . Relating severity of pedestrian injury to impact speed in vehicle–pedestrian crashes. Transp Res Rec. 2001;1773:108–113.
- Hashimoto H, Kawakoshi M, Okayama T. . Survey on braking deceleration for a heavy duty truck [in Japanese]. Japan Automotive Research Institute (JARI) Research Journal. 2008;30:611–614.
- Institute for Traffic Accident Research and Data Analysis of Japan. Annual Traffic Accident Report in 2014 [in Japanese]. Tokyo, Japan: ITARDA; 2018.
- Japan Automobile Standards Internationalization Center. Test for mirrors for confirming the immediate front and left side (TRIAS44-J081-01). In: Japan Automobile Standards Internationalization Center (JASIC), ed. Automobile Type Approval Handbook for Japanese Certification [book on CD-ROM]. Tokyo: JASIC; 2015a.
- Japan Automobile Standards Internationalization Center. Test for protection of heads and legs of pedestrians (TRIAS18-J099(2)-01). In: Japan Automobile Standards Internationalization Center (JASIC), ed. Automobile Type Approval Handbook for Japanese Certification [book on CD-ROM]. Tokyo: JASIC; 2015b.
- Kahn C. . National Highway Traffic Safety Administration (NHTSA) notes, 2009. Ann Emerg Med. 2009;54:603–604.
- Kong C, Yang J. . Logistic regression analysis of pedestrian casualty risk in passenger vehicle collisions in China. Accid Anal Prev. 2010;42:987–993.
- Kuzumaki S. . Our approach to a safe sustainable society [in Japanese]. J Soc Automot Eng Jpn. 2009;63(12):11–19.
- Ljung M, Jakobsson L, Lindman M, Coelingth E. . Collision avoidance systems—advancements and efficiency. Paper presented at: SAE 2015 World Congress & Exposition; 2015; Detroit, MI.
- Makabe S. . Active safety system new eyesight version 2 [in Japanese]. J Soc Automot Eng Jpn. 2012;66(3):88–93.
- Matsui Y, Kojima T, Tanaka N, et al. Performances of the collision damage mitigation braking system for pedestrians. Paper presented at: First International Symposium on Future Active Safety Technology Toward Zero-Traffic-Accident (FAST Zero ’11); 2011; Tokyo, Japan.
- Matsui Y, Oikawa S, Ando K. . Risks of pedestrian serious injuries and fatalities associated with impact velocities of cars in car-versus-pedestrian accidents in Japan. Stapp Car Crash J. 2013;57:201–217.
- Matsui Y, Oikawa S, Sorimachi K, Imanishi A, Fujimura T. . Association of impact velocity with risks of serious injuries and fatalities to pedestrians in commercial truck–pedestrian accidents. Stapp Car Crash J. 2016;60:165–182.
- Matsui Y, Tanahashi M. . Development of JAMA-JARI pedestrian headform impactor in compliance with ISO and IHRA standards. Int J Crashworthiness. 2004;9(2):129–139.
- National Astronomical Observatory of Japan. Chronological Science Tables [in Japanese]. Tokyo: Maruzen Publishing; 2017
- NHTSA. Federal Motor Vehicle Safety Standard, Rearview Mirrors. Washington, DC: NHTSA; 2009. Docket No. NHTSA-2009-0041.
- Oh C, Kang Y, Kim W. . Assessing the safety benefits of an advanced vehicular technology for protecting pedestrians. Accid Anal Prev. 2008;40:935–942.
- Rosen E, Sander U. . Pedestrian fatality risk as a function of car impact speed. Accid Anal Prev. 2009;41:536–542.
- Shibata E. . Development of driving assist system “EyeSight” by new stereo camera [in Japanese]. J Soc Automot Eng Jpn. 2009;63(2):93–98.
- Suzuki K, Yamaguchi D, Fujita M. . Empirical analysis on users’ behaviors and traffic conflicts at large-scale intersections [in Japanese]. J Soc Civil Eng Jpn. 2011;67:1193–1205.
- United Nations Economic Commission for Europe, World Forum for Harmonization of Vehicle Regulations, Working Party on General Safety Provisions, Informal Working Group on Awareness of Vulnerable Road Users Proximity in Low Speed Maneuvers. Proposal for a new UN regulation on uniform provisions concerning the approval of devices for reversing motion and motor vehicles with regard to the driver's awareness of vulnerable road users behind vehicles. 2018. Available at: https://wiki.unece.org/pages/viewpage.action/pageId=2523225
