
Abstract
Objective: Fatal brain injuries result from physiological changes in brain tissues, subsequent to primary damage caused by head impact. Although efforts have been made in past studies to estimate the probability of brain injury, none of them involved prediction of such physiological changes. The goal of this study was to evaluate the fatality prediction capability of a novel approach that predicts an increase in intracranial pressure (ICP) due to primary head injury to estimate the fatality rate using clinical data that correlate ICP with fatality rate.
Methods: A total of 12 sets of head acceleration time histories were used to represent no, severe, and fatal brain injury. They were obtained from the literature presenting head kinematics data in noninjurious volunteer sled tests or from accident reconstruction for severe and fatal injury cases. These were first applied to a Global Human Body Models Consortium (GHBMC) head–brain model to predict nodal displacement time histories of the brain, which were then fed into FEBio to predict ICP. A Weibull distribution was applied to the data for the relationship between fatality rate and ICP obtained from a clinical paper to estimate fatality rate from ICP (procedure A). Fatality rate was also estimated by applying the temporal and spatial maximum value of maximum principal strain (MPSmax) obtained from the GHBMC simulation to an injury probability function for MPSmax (procedure B). Estimated fatality rates were compared between the 2 procedures.
Results: Both procedures estimated higher average fatality rate for higher injury severity. The average fatality rate for procedure A without ischemia representation and procedure B was 72.4 and 51.0% for the fatal injury group and 8.2 and 21.7% for the severe injury group, respectively, showing that procedure A provides more distinct classification between fatal and nonfatal brain injury. It was also found that representation of ischemia in procedure A provides results sensitive to injury severity and impact conditions, requiring further validation of the initial estimate for the relationship between brain compression and ischemic cell death.
Conclusions: Prediction of the probability of fatality by means of a combination of simulations of the primary brain deformation and subsequent ICP increase was found to be more distinct compared to the prediction of primary injury alone combined with the injury probability function from a past study in the select 12 head impact cases.
Keywords:
Introduction
According to the NASS-CDS from 2010 to 2015 and NASS Pedestrian Crash Data Study (PCDS) from 1994 to 1998, head injuries respectively account for 33 and 46% of all body regions sustaining Maximum Abbreviated Injury Scale (MAIS) injury in fatal accidents, showing that head injury is the most frequent cause of death in both car and pedestrian crashes. Of those, brain injury respectively accounts for 76 and 81% of the head injuries responsible for death, indicating that mitigation of brain injury is important to diminish traffic fatalities.
The outcome of traumatic brain injury is determined by 2 substantially different mechanisms/stages: (a) primary insult (mechanical damage) occurring at the moment of impact and (b) delayed insult (nonmechanical damage) representing consecutive pathological processes initiated at the moment of injury (Werner and Engelhard Citation2007). The overwhelming evidence of intracranial pressure (ICP) as a predictor of outcome and its power to detect and follow episodes of intracranial hypertension has assured its central role in the treatment of patients with head injuries (Balestreri et al. Citation2006). Despite the importance of delayed insult in predicting the outcome, currently proposed evaluation procedures correlate tissue-level injury predictors, such as maximum principal strain (MPS) or the cumulative strain damage measure (CSDM), with the probability of primary brain injury based on scaled animal data (Takhounts et al. Citation2013). Though subsequent studies have compared injury probability predicted using this procedure to real-world injury rates determined from accident data for Abbreviated Injury Scale (AIS) 2 to 4 injuries (Laituri et al. Citation2016; Mueller et al. Citation2015; Prasad et al. Citation2014), none of them have evaluated its ability to predict fatality.
A novel approach to estimate fatality rate due to brain injury has been developed by Basilio et al. (2019). The procedure combines prediction of brain deformation due to head translational and rotational acceleration with prediction of ICP after sustaining such brain deformation using the software FEBio (Ateshian et al. Citation2013; Maas et al. Citation2012). FEBio is a nonlinear finite element solver that was conceived with the purpose of handling biomechanical applications of various complexity. FEBio has built-in capabilities to solve different kinds of physics such as structural mechanics, heat transfer, biphasic and multiphasic physics, and chemical reactions. By using precoded constitutive models and special algorithms to robustly handle incompressible materials, FEBio simulates ICP increase due to cell death caused by brain deformation from head impact and subsequent ICP increase due to further cell death caused by ischemia. Details of prediction of ICP increase using FEBio can be found in Basilio et al. (2019). By combining prediction of the delayed insult represented by ICP increase with the prediction of primary brain injury, fatality rate may be more accurately estimated than the prediction of primary brain injury alone, because significant brain swelling leads to cerebral ischemia and brain stem compression that determine fatality risk.
The goal of this study was to evaluate the fatality prediction capability of a novel approach that combines finite element (FE) prediction of brain deformation due to head impact with prediction of ICP increase due to such brain deformation to estimate fatality rate using published clinical data.
Methods
Estimation of head acceleration time histories
Four load cases were used for each of the no, serious, and fatal injury groups. For each load case, translational and rotational acceleration time histories of the head were used to predict brain injury. For the no injury group, time histories were obtained from the NHTSA Biomechanics Test Database (National Highway Traffic Safety Administration Citation2017) that stores head acceleration data from noninjurious lateral sled tests of seated and belted human volunteers conducted by Ewing et al. (Citation1978), in which 5–7 g of maximum sled deceleration was applied. With regard to the severe and fatal injury groups, time histories were estimated from impact simulations using FE human body models that reconstructed specific accidents from accident databases. A review of in-depth accident databases revealed that the confidence level of the head impact location is higher for pedestrians than for car occupants due to direct contact with the car surface. For this reason, pedestrian impacts were chosen from either the NASS-PCDS or the Crash Injury Research and Engineering Network database (Longhitano et al. Citation2005). The striking car category was limited to small SUVs and small sedans. Pedestrian ages ranged from 21 to 66 years old; pedestrians over age 66 were eliminated to minimize the influence of frailty on the injury outcome. For the severe injury group, cases were chosen such that MAIS injury was sustained by the head, involving AIS 3 or 4 brain injury. Cases where the head contacted the center of the windshield were chosen, because the head impact location can be clearly defined. Fatal accidents where brain injury was the cause of death were screened for the fatal injury group. Cases associated with depressed skull fracture were excluded to select cases with diffuse brain injury and it was determined that, for these cases, the head contacted the A-pillar in 3 out of 4 cases, and in one case it contacted the supporting structure of the hood near the bottom of the A-pillar. The characteristics of the 12 select cases are summarized in Table A1 (see online supplement). The initial letter of the case ID denotes injury severity (N, S, and F for no, severe, and fatal injury, respectively).
The 8 cases of pedestrian accidents in the severe and the fatal injury groups were simulated using FE impact simulations. The pedestrian was simulated using a whole-body human body model in a standing posture developed by Takahashi et al. (Citation2015) by geometrically scaling it to match the stature of the pedestrian and adjusting the mass density of the flesh to match the weight of the pedestrian. The striking cars were represented by either of 3 full FE car models in the same category. (see online supplementonline supplement) show the side and top views of the 3 car models. Because the upper body of a pedestrian tends to rotate toward the car surface about the bonnet leading edge (BLE) and thus the height of the BLE significantly influences the motion of the head, 2 small sedan models (Sedan-1 and Sedan-2) and one small SUV model (SUV) with different BLE heights (602, 650, and 907 mm, respectively) were used. All of the structural parts influencing pedestrian impact between the front end of the car and the rear end of the A-pillar, windshield, and front fender were modeled, with relevant parts in the engine compartment modeled whenever needed for pedestrian interaction. The number of elements was 0.33, 1.03, and 0.24 million for Sedan-1, Sedan-2, and SUV, respectively. All of the car components were modeled with shell elements except the wiper blade, hood cushion, and mastic sealant, modeled using solid elements. Failure of the windshield was modeled using an elastic–plastic material model with isotropic damage behavior. The rear end of the model along with the rigid parts in the engine compartment were rigidly connected to a node located at the center of gravity of the cars, and the mass was applied to the node such that the total mass of the model matched the curb weight plus 2 passengers (75 kg each). Impact speed was simulated by applying the initial velocity to this node. Impact speed, impact location, and orientation of the pedestrian relative to the car were based on the accident data. The vertical location of the car model was slightly adjusted such that the BLE height matched that of the car involved in the accident. The initial impact location of the pedestrian relative to the car was slightly tuned such that the pedestrian head impacted the same component as that of the accident in the same aspect of the head.
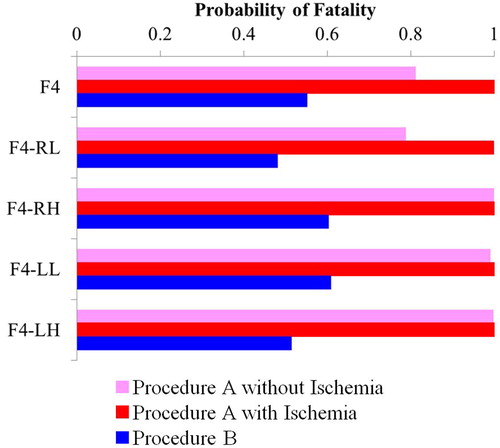
Because accident reconstruction simulations involve uncertainties in boundary conditions, a sensitivity study was conducted on a select severe case and a fatal injury case to investigate the influence of head impact location and car impact speed on predicted fatality rate. Cases F4 and S4 were chosen from the fatal and severe injury groups, respectively, because these cases resulted in the largest difference within the group in predicted fatality rate between conventional and proposed prediction methodologies. Both impact location of the head and car impact speed were varied. For case F4 where the head hit the A-pillar, 4 combinations of 2 car impact speeds and 2 head impact locations (right and left sides of the A-pillar) were simulated. The confidence interval of the car impact speed from the accident data was applied (50 ± 6 km/h). Head impact location was changed to the right and left sides of the A-pillar with respect to the car to remain consistent with the accident data. In case S4, the head hit the windshield. Due to the lack of confidence interval for car impact speed, 48 ± 10 km/h was used. Head impact location was varied by 100 mm to the right and left sides of the car to investigate the influence of a potential difference in the stiffness of the windshield between the model and the actual car.
Prediction of fatality rate
In order to clarify the difference in the prediction of final injury outcome against a method focusing on primary injury due to head impact, 2 procedures with and without ICP prediction (procedures A and B, respectively) were used to predict fatality rate. (see online supplement) presents a flowchart of fatality rate prediction. The time histories of head translational and rotational acceleration in 3 directions were applied to Global Human Body Models Consortium (GHBMC) head–brain model developed by Mao et al. (Citation2013) taken from M50 Detailed Occupant Version 4.5 for LS-DYNA by defining the skull as a rigid body and applying those pulses to a node in the rigid body definition positioned at the center of gravity of the head. For procedure A, nodal displacement time histories for the tissues inside the skull were obtained from the GHBMC model simulation and were fed into FEBio to calculate Lagrange strain using the mesh of the GHBMC model. The peak value of MPS over the entire loading history was used to estimate mechanical damage (fractional cell death) and proportionally assign a fixed charge density to each of the elements composing the brain. A triphasic (solid, fluid, and ions) simulation was used to predict ICP increase due to the intracellular fixed charge density exposed by cell death. A subsequent increase in ICP due to ischemia via cell death (fixed charge density) was also modeled as an additional pathological change in delayed insult (Basilio et al. 2019).
A fatality rate function as a function of ICP was developed using the relationship between ICP and fatality rate taken from Balestreri et al. (Citation2006). They present mortality and persistent vegetative state rate as a function of ICP increase between 0 and 50 mmHg at 10-mmHg intervals. Because they confirmed that high ICP is associated with a greater mortality rate with the threshold for increased ICP between 20 and 30 mmHg but severe disability did not show any remarkable changes dependent on ICP (Balestreri et al. Citation2006), data at 20 mmHg and above were used to develop the function. A maximum likelihood method was applied to fit a Weibull distribution to the data. The ICP increase predicted by FEBio simulations was converted to fatality rate using the fatality rate function. For procedure B, the spatial and temporal maximum value of MPS (MPSmax) of the brain tissue was obtained from the same GHBMC simulations and was converted to AIS 5+ injury probability using the probability function presented in Takhounts et al. (Citation2013). Because fatality rate was not available, estimated AIS 5+ injury probability was converted to fatality rate by calculating the average fatality rate for victims sustaining MAIS 5 and 6 head injuries (47.6 and 99.0% for AIS 5 and 6, respectively) weighted by exposure (1988–2007 NASS-CDS, weighted grand total = 229,015 and 80,005 for AIS 5 and 6, respectively; Goertz Citation2010). Fatality rate was estimated using both procedures A and B for all 12 cases, along with the additional 2 cases chosen for the sensitivity study. In addition, the average fatality rate for the fatal and severe injury groups and their difference were calculated and t tests were performed to test for statistical significance of the differences.
Results
The translational and rotational acceleration time histories in a local coordinate system for the no, severe, and fatal injury groups are presented in Figures A5–A10 (see online supplement). The x-, y-, and z-axes correspond to posterior–anterior, left–right, and superior–inferior directions to the head, respectively. For reference, Table A2 (see online supplement) summarizes the peak values of linear and angular acceleration along with the head injury criterion (15 ms duration) and brain injury criterion as defined by Versace (Citation1971) and Takhounts et al. (Citation2013), respectively. Figure A11 (see online supplement) compares car deformation between the real accident and accident reconstruction simulation for case F3. The injury probability functions used in procedures A and B are shown in and , respectively. The functions for procedures A and B are the fatality rate function as a function of ICP developed in this study based on clinical data from Balestreri et al. (Citation2006) and the injury probability function for AIS 5+ from Takhounts et al. (Citation2013), respectively. Tabulated data used to develop the function for procedure A can be found in Table A3 (see online supplement). Akaike’s information criterion was 4.22 for data fit of the function used in procedure A. Table A4 (see online supplement) summarizes the results of the prediction for all cases (MPSmax, CSDM, and ICP with and without ischemia). compares the estimated fatality rate between procedures A and B for all 12 cases investigated. and respectively present the fatality rate estimated for the additional cases F4 and S4 chosen for the sensitivity study. For both cases, the first and second letters following the case ID denote head impact location (R: right, L: left) and car impact speed (H: high, L: low). In both figures, the results for procedure A with and without prediction of ischemia are shown. The average fatality rate estimated using procedure A with ischemia, procedure A without ischemia, and procedure B were 93.2, 72.4, and 51.0% for the fatal injury group and 41.4, 8.2, and 21.7% for the severe injury group, respectively. The results of the t test showed that the difference in the average fatality rate between the severe and fatal injury groups was statistically significant for procedure A without ischemia and procedure B at a 1% confidence level (P = .020, .008, and .003 for procedure A with ischemia, procedure A without ischemia, and procedure B, respectively). The absolute value of the difference in the average fatality rate between these groups was 51.9, 64.2, and 29.3% for procedure A with ischemia, procedure A without ischemia, and procedure B, respectively.
Figure 1. Fatality probability function for procedure A.
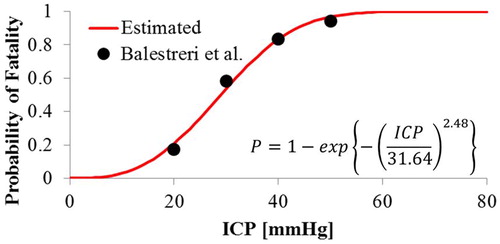
Figure 2. Injury probability function for procedure B.
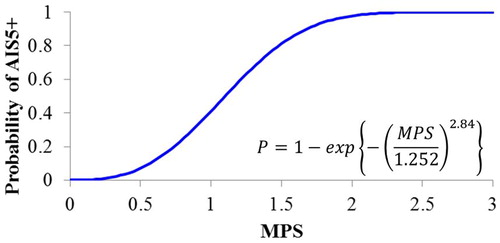
Figure 3. Comparison of predicted fatality rate for 12 load cases among procedure A without ischemia, procedure A with ischemia, and procedure B.
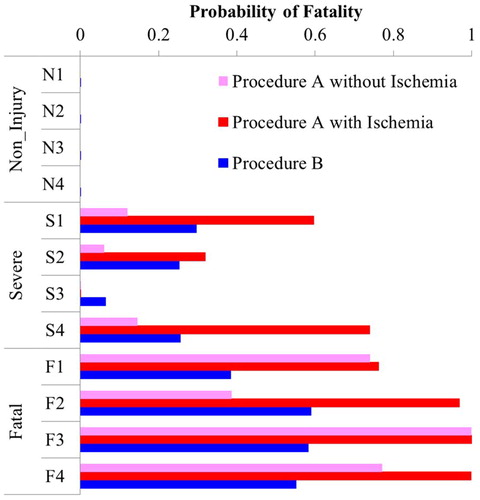
Figure 4. Comparison of predicted fatality rate for case S4 with impact velocity and head contact location varied among procedure A without ischemia, procedure A with ischemia, and procedure B.
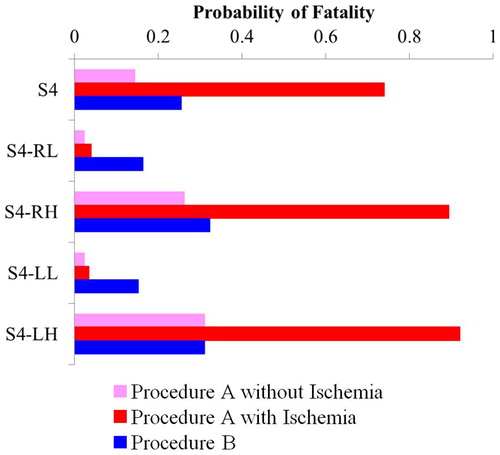
Figure 5. Comparison of predicted fatality rate for case F4 with impact velocity and head contact location varied among procedure A without ischemia, procedure A with ischemia, and procedure B.
Discussion
Although reduction of fatality is no doubt a top priority in traffic safety, past studies have used injury probability functions for specific AIS levels. This would be partly because the use of postmortem human subjects only allows classification of primary injury types without simulating pathological changes in delayed insult. Because fatality due to brain injury would be highly associated with brain stem herniation subsequent to cerebral swelling, with the exception of direct loading to the brain stem, simulation of brain swelling would significantly enhance prediction of fatality due to brain injury. To the best of the authors’ knowledge, this study and the relevant study by Basilio et al. (Citation2019) are the first attempts to address this issue.
Accident data generally involve uncertainties in boundary conditions of impact events, making it difficult to accurately reconstruct accidents. Despite such a drawback, the current study used accident reconstruction because predicted fatality rate needed to be compared against real-life injury outcomes. In order to minimize bias in the conclusion of the study, only cases with a clear definition of head impact location were chosen to ensure accuracy in injury sources, as shown in Figure A11. In addition, a sensitivity study was conducted for select cases by varying major accident parameters to clarify the influence of such variabilities on the results. Procedures A and B both estimated a higher average fatality rate for higher injury severity. A virtually zero fatality rate was predicted by both procedures for all no injury cases. The average fatality rate for the fatal injury group predicted by procedure A with and without ischemia was higher than that obtained for procedure B, clearly showing that procedure A, even without ischemia, provides a more realistic estimation of fatality rate compared to conventional procedure B. This trend was endorsed by the results of the sensitivity study for case F4 presented in . The average fatality rate for the severe injury group was higher for procedure A with ischemia and lowest for procedure A without ischemia. Procedure A without ischemia resulted in a more distinct classification between fatal and nonfatal brain injury compared to conventional procedure B, suggesting a potential of the novel approach used in this study to enhance the accuracy of fatality rate prediction. However, the results of the sensitivity study for case S4 presented in clearly show that the incorporation of ischemia resulted in a significant increase in fatality rate for the cases with baseline and higher car impact speeds (S4, S4-RH, and S4-LH). This suggests that the current model of ischemia is too sensitive to car impact speed in this particular impact configuration. This high sensitivity would result in large variability in the prediction of fatality rate and thus low statistical significance of the difference in average fatality rate between the fatal and severe injury groups. A future study needs to further investigate the current ischemia model relating brain compression to ischemic cell death such that incorporation of ischemia contributes to enhancing, rather than degrading, as seen in this example, discrete prediction of injury levels.
The results of this study depend on the reliability of the GHBMC head–brain model. Although model validation is outside the scope of this study, a future study needs to further validate the model against recently available brain response data. The fatal and severe injury cases investigated were limited to pedestrian impacts with a relatively long duration of the head motion, requiring further study to investigate other load cases with a shorter duration, such as frontal and side impacts and head impacts in sports.
References
Supplemental Material
Download PDF (1.1 MB)Related Research Data
- Ateshian GA, Maas S, Weiss JA. Multiphasic finite element framework for modeling hydrated mixtures with multiple neutral and charged solutes. J Biomech Eng. 2013;135(11):111001.
- Balestreri M, Czosnyka M, Hutchinson P, et al. Impact of intracranial pressure and cerebral perfusion pressure on severe disability and mortality after head jnjury. Neurocrit Care. 2006;4:8–13.
- Basilio AV, Xu P, Takahashi Y, et al. Simulating cerebral edema and delayed fatality after traumatic brain injury using triphasic swelling biomechanics. Paper to be presented at: 26th ESV Conference; June 10–13, 2019; Eindhoven, The Netherlands.
- Ewing CL, Thomas DJ, Lustic L, et al. Dynamic Response of Human and Primates Head and Neck to + Gy Impact Acceleration. Washington, DC: National Highway Traffic Safety Administration, U.S. Department of Transportation; 1978. DOT HS 803 058.
- Goertz A. Accident Statistical Distributions from NAS CDS. Warrendale, PA: Society of Automotive Engineers; 2010. SAE International Technical Paper 2010-01-0139.
- Laituri TR, Henry S, Pline K, Li G, Frankstein M, Weerappuli P. New risk curves for NHTSA’s brain injury criterion (BrIC): derivations and assessments. Stapp Car Crash J. 2016;60:301–362.
- Longhitano D, Burke C, Bean J, et al. Application of the CIREN methodology to the study of pedestrian crash injuries. Paper presented at: 19th ESV Conference; June 6–9, 2005; Washington, DC.
- Maas SA, Ellis BJ, Ateshian GA, Weiss JA. FEBio: finite elements for biomechanics. J Biomech Eng. 2012;134(1):011005.
- Mao H, Zhang L, Jiang B, et al. Development of a finite element human head model partially validated with thirty-five experimental cases. J Biomech Eng. 2013;135(11):111002.
- Mueller B, MacAlister A, Nolan J, Zuby D. Comparison of HIC and BrIC head injury risk in IIHS frontal crash tests to real-world head injuries. Paper presented at: 24th ESV Conference; June 8–11, 2015; Gothenberg, Sweden.
- National Highway Traffic Safety Administration. Biomechanics test database. 2017. Available at: https://one.nhtsa.gov/Research/Databases-and-Software. Accessed August 2, 2018.
- Prasad P, Dalmotas D, German A. The field relevance of NHTSA’s oblique research moving deformable barrier tests. Stapp Car Crash J. 2014;58:175–195.
- Takahashi Y, Asanuma H, Yanaoka T. Development of a full-body human FE model for pedestrian crash reconstructions. Paper presented at: IRCOBI Conference; September 9–11, 2015; Lyon, France.
- Takhounts EG, Craig MJ, Moorhouse K, McFadden J, Hasija V. Development of brain injury criteria (BrIC). Stapp Car Crash J. 2013;57:243–266.
- Versace J. A review of the severity index. Paper presented at: 5th Stapp Car Crash Conference; November 17–19, 1971; Coronado, CA.
- Werner C, Engelhard K. Pathophysiology of traumatic brain injury. Br J Anaesth. 2007;99:4–9.