
 ?Mathematical formulae have been encoded as MathML and are displayed in this HTML version using MathJax in order to improve their display. Uncheck the box to turn MathJax off. This feature requires Javascript. Click on a formula to zoom.
Abstract
Objective: In 2020, the world’s first crash compatibility rating test will be introduced in the European mobile progressive deformable barrier (MPDB) test. In this research, the quantitative change in partner protection performance of large vehicles in car-to-car (C2C) impacts was studied if these large vehicles were designed in future based on MPDB tests addressing crash compatibility ratings.
Methods: Representative vehicles of the European fleet were selected and a Computer Aided Engineering (CAE) parameter study was conducted. In particular, by changing an indicator of structural interaction performance (SD; i.e., the degree of uniformity of barrier deformation)/mass/stiffness of large vehicles systematically in a step-by-step approach, the compatibility evaluation results of large vehicles in MPDB and the occupant injury score of small vehicles in C2C impacts were compared. The CAE result was evaluated compared to that of C2C physical impact tests.
Results: The CAE parameter study showed that in the C2C impact condition, the effects on occupant injury in a small vehicle due to changes in the large vehicle were as follows: (1) SD change: The effect was minor except for small overlap condition. (2) Mass and stiffness change: The effect was relatively major.
On the other hand, compatibility evaluation in the MPDB showed a tendency to overestimate the effect of SD change in comparison with the above-mentioned C2C impact condition.
In addition, physical impact tests showed that, based on SD evaluation, the large vehicle with a relatively inferior compatibility rating compared to those with superior compatibility ratings showed a contradicting trend of better compatibility performance in the C2C test.
Conclusions: The currently proposed compatibility evaluation method of the MPDB test showed some tendency to overestimate the effect of SD change and resulted in quantitatively inconsistent outcomes regarding occupant injury in the partner car in C2C impact conditions.
Introduction
The self-protection (SP) performance of passenger vehicles in car-to-car (C2C) collisions has been continuously improved due to the implementation of government regulations or New Car Assessment Program (NCAP) protocols and the continuous R&D effort by automobile manufacturers addressing challenges in technological development. Compatibility, or dealing with issues of both SP and partner protection (PP), has remained as the next step in crash safety for the last 20 years.
Full-scale research on compatibility was started with International Harmonised Research Activity (IHRA) compatibility working group in 1997, followed by NHTSA, the Insurance Institute for Highway Safety, and the Alliance of Automobile Manufacturers (AAM) in the United States, Ministry of Land, Infrastructure and Transport (MLIT) and Japan Automobile Manufacturers Association (JAMA) in Japan, and European consortium activity such as Improvement of Vehicle Crash Compatibility Through the Development of CrashTest Procedures (VC-COMPAT) and Frontal Impact and Compatibility Assessment Research (FIMCAR). As a result, numerous proposals have been made (e.g. Edwards et al. Citation2012; Johannsen et al. Citation2013; Johannsen and Thomson Citation2016). However, C2C collisions, which are the main focus of compatibility, are a complicated phenomenon because the combinations of vehicle models and collision conditions are quite diverse. Therefore, it was difficult to determine a practical and rational method that can comprehensively explain C2C collisions. There is no widely agreed-upon evaluation method.
In addition, fixed barriers have mainly been used in research studies, and the corresponding validation of the effectiveness of these studies in C2C tests is inadequate. Specifically, though in many studies experts subjectively categorize PP performance based on the honeycomb deformation shape or load distribution of barrier load cells, there are limited studies in which the consequences due to implementation of the proposed evaluation methods was verified in C2C conditions.
Under those circumstances, research on compatibility evaluation was undertaken by Euro NCAP in 2013, and the mobile progressive deformable barrier (MPDB) test was reported at the Enhanced Safety of Vehicles Conference in 2017 (Sandner et al. Citation2017). The basis of this test method was originally proposed by FIMCAR (del Pozo de Dios et al. Citation2013) and further modified by ADAC (Sandner and Ratzek Citation2015). Although this is still under study with final implementation proposed for 2020, a concrete method has been defined as the world’s first compatibility rating method. Furthermore, in contrast to many PP evaluations proposed in previous research that were based on on–off evaluation as the regulation test, this method is based on score evaluation because it is a rating test. Hence, it is possible to compare the PP performance of the vehicle and the occupant injury risk of the opponent vehicle with the same index based on the rating score basis.
In this study, the effect on casualty reduction due to the introduction of this test method was verified by investigating the correlation between the body structure modification to address this MPDB test and the occupant injury risk of the struck vehicle. Specifically, a typical large passenger vehicle in the European market was selected and a CAE study under MPDB conditions was conducted in which 3 major compatibility performance-related factors (structural interaction, stiffness matching, mass ratio) were independently changed and the sensitivity of each factor with respect to PP evaluation was evaluated. This was followed by another CAE study under C2C conditions (larger passenger vehicle vs. smaller passenger vehicle), and the correlation between the aforementioned PP evaluation of larger vehicles and the occupant injury risk of smaller vehicles was examined. In addition, MPDB and C2C physical tests were conducted and the trends observed in the CAE studies were verified.
Methods
Overview
The structure of a larger vehicle was studied in detail to achieve a good PP evaluation in the MPDB test method. Next, the effect of the same structure on occupant injury reduction in a smaller vehicle under C2C conditions was evaluated by a CAE parametric study and physical crash tests. Details of the studied cases are shown in Table A1 (see online supplement).
Table 1. Summary of MPDB test results.
The MPDB testing protocol and evaluation method used in this study were in accordance with the latest MPDB procedure (Euro NCAP Citation2018) as shown in Figure A1 (see online supplement). In this test method, a 1,400 kg trolley with a Progressive Deformable Barrier (PDB) honeycomb collides from the front with 50% overlap of the vehicle. The impact velocity is 50 km/h for both the trolley and vehicle. The evaluation is divided into 2 parts—(1) SP and (2) PP—as follows:
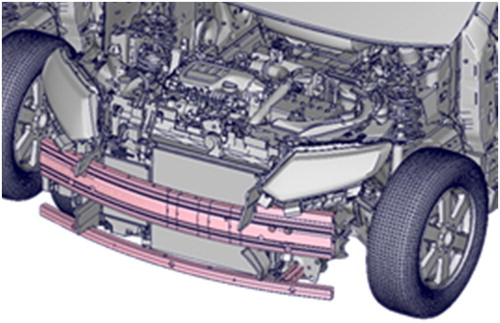
Figure 1. SD reduction structure of a C-SUV (OEM-A).
The overall SP score, ranging from 0 to 16 points, is calculated from individual head/chest/pelvis/lower leg scores based on the injury value using a sliding scale method. A THOR-AM50 (with a Hybrid-III leg) anthropomorphic test device (ATD) is placed on the driver (DR)-side seat instead of a Hybrid-III AM50.
The PP score, which is basically a point deduction penalty scheme, varies from 0 to −8 points. The maximum/minimum number of points deducted is determined by deceleration characteristic (i.e., Occupant Load Criterion (OLC); Kübler et al. Citation2009) of the MPDB trolley. The score is calculated along with the standard deviation (SD) of honeycomb deformation within the specified range as mentioned above (Euro NCAP Citation2018). The threshold of the sliding scale is defined as 25 to 40 g for OLC and 50 to 150 mm for SD.
With regard to C2C crash conditions, 50% overlap of the smaller vehicle and 50 km/h impact velocity for both vehicles were set to be consistent with the MPDB test condition. A THOR-AM50 (with Hybrid-III leg) is used for the DR-side ATD in the physical crash test. In evaluating the injury value of the smaller vehicle only the DR-side THOR ATD (superior in biofidelity) was taken into consideration. The SP score was calculated based on the evaluation method as described in the latest MPDB evaluation procedure (Euro NCAP Citation2018).
CAE study
As the representative vehicle segments for compatibility targets within the European fleet, a C-SUV (larger vehicle) and B-hatchback (HB; smaller vehicle) were selected from the viewpoint of composition ratios and trend of vehicle population in the European Union market (Figure A2, see online supplement). At that time, in order to prevent any bias, each car model was selected from 2 different OEMs (A and B). With regard to the vehicle CAE model used for the present study, the correlation was verified by 50 km/h MPDB (Figure A3, see online supplement) test results.
Figure 2. Relationship between MPDB and C2C (OEM-A).
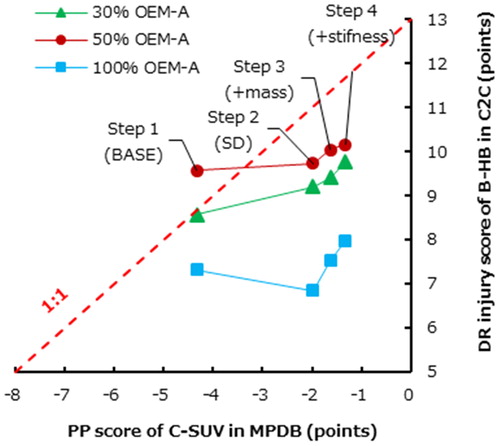
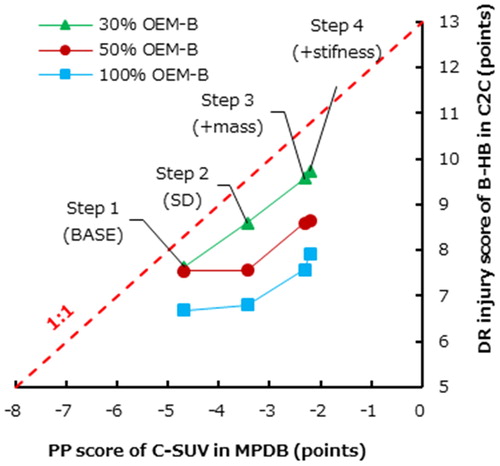
Figure 3. Relationship between MPDB and C2C (OEM-B).
For the C-SUV, MPDB and C2C (vs. B-HB) simulations were conducted with changing 3 major factors of compatibility step by step as shown in Table A1. Details of C-SUV variation are as follows:
C-SUV: Baseline design.
C-SUV (SD): A structural interaction improvement measure is incorporated (i.e., SD in MPDB changed to the segment top level).
C-SUV (M): In addition to (2), the vehicle mass was reduced (i.e., the mass of the whole vehicle was set to 0.8 times).
C-SUV (S): In addition to (3), the vehicle body stiffness was reduced (i.e., the strength of side member and cradle frame were set to 0.8 times).
The order of the changes was taken into account when changing the vehicle weight and strength. First, the case with reduced mass was calculated. Subsequently, the stiffness of the vehicle was reduced. Thereby, the demerits and disadvantages that might arise due to insufficient energy absorption of the engine compartment were eliminated.
In the C2C analysis, the overlap ratio was also changed in 3 steps (i.e., 30, 50, and 100% of the smaller vehicle). The positional relationships of the main body members for each overlap ratio are shown in Figure A4 (see online supplement).
The body structure for SD reduction is shown in and Figure A5 (see online supplement). For both types of vehicle, the bumper-reinforce-member and apron-reinforce-member were reinforced and extended outward. The extended part helps to crush some portion of the honeycomb in front of wheels and thereby SD was improved. In addition, by maintaining the crush space of the engine compartment and the strength of the main longitudinal members as much as possible, it became a realistic and feasible vehicle structure with compatible structural crash performance in 15 km/h Offset Rigid Barrier (ORB), 64 km/h Offset Deformable Barrier (ODB), and 56 km/h Full Width Rigid Barrier (FWRB) conditions.
With regards to the total injury risk indicator of the occupant of the smaller vehicle, the injury rating score as described in the latest MPDB procedure (Euro NCAP 2018) was used. Because it is difficult to accurately predict injury risk with a CAE, it was calculated using the multiple regression equation (EquationEq. (1)(1)
(1) ) derived from the physical test group set of MPDB with THOR AM50. Vehicle deceleration and cabin deformation, which are dominant factors for occupant injury values, were used as explanatory variables.
(1)
(1)
where IS (point) is the injury score; g is the OLC of the vehicle; and D (mm) is the average rearward displacement of the toeboard and a cross-car beam attachment point on the A-pillar.
The correlation fitness is shown in Figure A6 (see online supplement). The regression coefficient (R2) was 0.756 and the Variance Inflation Factor (VIF) was 3.04 of the multiple regression equation (EquationEq. (1)(1)
(1) ).
Thus, the injury score can be estimated solely from the vehicle body crash characteristics with the precondition of generic restraint systems of recent vehicles. Because this method is not affected by the seatbelt, airbags, dummy seating, and time to fire, this method has an advantage of being able to extract the differences purely caused by vehicle body characteristics compared to the occupant response analysis by the CAE (MADYMO etc.). For details, refer to Appendix A (see online supplement).
The correlation between the larger vehicle in the MPDB condition and occupant injury score of the smaller vehicle in the C2C condition calculated by the above-mentioned methods was verified by comparing the PP evaluations.
Physical crash test
In contrast to the CAE study, it is difficult to change the vehicle body characteristics freely in physical tests. Hence, to narrow down the purpose of how to clarify the sole influence of the structural interaction evaluation of larger vehicles, vehicle models used in this study were selected as follows:
Larger Vehicle: A C-SED and a B-SUV were selected as the combination with similar trolley OLC with different SD.
Smaller vehicle: A B-HB was selected by the same logic as the CAE study.
For each of the 3 models, the body structure and the restraint device are equivalent to models sold in Europe.
Using these models, 3 MPDB tests and 2 sets of C2C tests (B-HB vs. 2 larger vehicle models) were conducted as shown in Table A1. In order to compare with the MPDB tests, the C2C test condition was set to 50 km/h impact velocity for both vehicles with an overlap ratio of 50% of the smaller vehicle. In addition, in accordance with the latest MPDB procedure (Euro NCAP 2018), a THOR AM50 (with a Hybrid-III leg) was placed in the DR seat, a Hybrid-III AM50 was placed in the passenger seat, and a Q6 + Q10 child ATD equivalent weight was placed in the rear seat.
Results
CAE study
An example of the calculation results in each step (refer to Table A1) is described below. It consists of (1) the SD of a larger vehicle in MPDB, (2) trolley OLC in MPDB, (3) cabin deformation of the smaller vehicle in C2C, and (4) OLC of the smaller vehicle in C2C. Cabin deformation was calculated as the average rearward deformation of the toeboard and a cross-car beam attachment point on the A-pillar. Vehicle models shown are from OEM-A for both larger and smaller vehicles. The overlap ratio in the C2C is 50%. For detailed results including other overlap ratios and OEM, refer to Table A2 (see online supplement).
Table 2. Occupant injury scores of a B-HB (No. 4: vs. B-SUV).Table Footnotea
Base (Nos. 2/10): (1) 129, (2) 33.0 g, (3) 132 mm, (4) 31.2 g.
SD (Nos. 3/11): (1) 78, (2) 31.8 g, (3) 138 mm, (4) 30.7 g.
M (Nos. 4/12): (1) 78, (2) 30.1 g, (3) 97 mm, (4) 30.2 g.
S (Nos. 5/13): (1) 72, (2) 29.6 g, (3) 83 mm, (4) 30.0 g.
Calculated scores based on these result are shown in and . The horizontal axis shows the PP score of larger vehicles in the MPDB test, and the vertical axis shows the DR injury score of the smaller vehicle in the C2C crash. For both models, a tendency can be seen that the injury score of smaller vehicle improved marginally with the reduced SD structure. In contrast, it improves at the same level as the PP score in cases where the mass and stiffness were reduced. In addition, though the SD reduction structure is relatively effective in reducing the injury score at the overlap ratio of 30%, its effect decreases as the overlap ratio increases, and it shows the opposite effect at 100% overlap in the OEM-A case, the cause of which can be explained as follows. Elongated cross-members of the larger vehicle engaged the load wheels of the smaller vehicle and thus new load path was created and the energy-absorbing capability of the frontal part of the vehicles was slightly improved at the overlap ratio of 30% (Figure A7, see online supplement). However, these effects were almost eliminated at 50% overlap (Figure A8, see online supplement). At 100% overlap, the reinforced cross-member was improperly engaged between the engines of the 2 vehicles and consequently deteriorated the deceleration characteristics of the vehicles (Figure A9, see online supplement).
Physical crash test
The results of MPDB tests are shown in . In line with the intention of vehicle model selection, larger vehicles showed different SDs despite similar trolley OLCs and also resulted in a difference in PP scores.
Figures A10 and A11 (see online supplement) show the state of the vehicle after the C2C tests conducted using these vehicles. Neither override effects nor fork effects were observed in either case. Therefore, there is no issue to be noted in structural interaction.
Occupant injury scores of smaller vehicles are shown in and . For both cases, the total injury score was decided by the DR side with the THOR dummy as the occupant. Chest deflection and tibia index contributed to the differences noted. This result shows a tendency opposite that of the PP score of larger vehicles; that is, the larger vehicle with a relatively inferior PP evaluation causes lower occupant injury risk to the opponent of the smaller vehicle.
Table 3. Occupant injury scores of a B-HB (No. 5: vs. C-SED).
Comparing the vehicle body deceleration in C2C, the amount of energy absorption in the front part of the vehicle (engine compartment) is almost equal in the 2 tests (Figures A12 and A13, see online supplement) and hence it is considered that there was no significant difference in structural interaction. In addition, deceleration (OLC) and cabin deformation, which were influential characteristics of the vehicle body with regard to occupant injury, were also almost equal, as shown below. For details, refer to Table A3 (see online supplement).
vs. C-SED: OLC = 27.8 g, cabin deformation = 33 mm.
vs. B-SUV: OLC = 27.6 g, cabin deformation = 27 mm.
A difference was observed in the results for the occupant restraint system. Figure A14 (see online supplement) shows the belt tension force data of the B-HB. In the case of collision with the C-SED, the start time of the occupant restraint is about 7 ms later and resulted in more pelvis movement. Consequently, the lap belt tension increased and caused a difference in chest deflection.
The relationship between the injury score obtained in this test series and the estimated value calculated by EquationEq. (1)(1)
(1) is plotted in Figure A6. These 2 results correlated closely and the validity of EquationEq. (1)
(1)
(1) was thus confirmed.
A comparison of deceleration curves of the smaller vehicle in MPDB and C2C tests is shown in Figure A15 (see online supplement). The OLC in the MPDB was 35.9 g, whereas in the C2C condition, it was 27.6 g for the B-SUV and 27.8 g for the C-SED. In other words, although the weight of MPDB trolley is equivalent to the test weight of the B-SUV, the induced deceleration for the smaller vehicle was more severe.
Discussion
With the Euro NCAP MPDB test method, research on compatibility that lasted over 20 years reached a new stage.
In this research, the amount of PP performance improvement of a large car in a C2C collision was investigated using MPDB test parameters. As a result, with respect to the vehicle models and test conditions selected in this study, no clear correlation between SD and opponent occupant injuries was observed in both CAE and physical tests. The factors were further disassembled and the correlation between SD, vehicle deceleration, and cabin deformation was further reinvestigated, but no clear correlation was found (Figures A16 and A17, see online supplement).
On the other hand, a higher correlation between the trolley OLC and vehicle deceleration and cabin deformation of the opponent vehicle in C2C was observed in both the CAE study and physical tests (Figures A18 and A19, see online supplement).
These facts suggest the following:
There is room for further improvement in the SD evaluation procedure to be used as an indicator of structural interaction.
MPDB trolley-related OLC is a reasonably appropriate indicator of stiffness matching and mass ratio.
For further improvement related to SD, both evaluation metrics and the threshold values can be considered. There is a possibility that the resolution required to properly determine the rating under the current threshold and sliding scale is insufficient for the current SD metric. However, even if the resolution is insufficient, there are cases where it can be utilized as on–off evaluation by proper adjustment of the threshold value. Future research will be needed in order to determine which one should be improved.
In addition, from the viewpoint of SP performance, the deceleration given by the MPDB trolley to the B-HB selected this time was 1.3 times stricter in OLC than that in C2C conditions with the car having a similar weight as the MPDB trolley. This suggests that the balance between the weight and stiffness of the MPDB could be different from that of the actual vehicles. Thus, the burden on smaller vehicles in the MPDB test could be stricter than that in the actual C2C collision.
As shown in Figure A15, MPDB seems to well reproduce the vehicle deformation mode in C2C because the 3 deceleration stroke waveforms of the B-HB shown on the right side are similar but the position and height of the peak are different. The idle stroke brought by the space around the bumper of vehicles produced the stroke difference of the first peak (72 mm), but the stroke difference at the maximum peak (139 mm) and the difference in height (1.35 times) cannot be explained only by that. Comparing the deceleration crash pulse of the MPDB trolley and C-SED/B-SUV shown on the left side, the second layer (progressive part) of the PDB honeycomb is considered to be stiffer than that of the vehicle body at the same stroke. This could increase the maximum deceleration of the B-HB, shorten the absolute stroke with respect to the ground, and possibly cause a severe OLC. For details of vehicle body crash characteristics of the B-HB in C2C and MPDB conditions, refer to Appendix B (see online supplement).
However, because the above series of results might change depending on the vehicle models and the test conditions (velocity, overlap ratio, etc.), careful consideration is required to in order to draw any concrete conclusions.
Further research activity is expected to be published in order to further enrich this test method to be more effective in the real world in the near future.
Supplemental Material
Download Zip (18.2 MB)Acknowledgments
This article was written on behalf of the members of the Frontal Impact Working Group of the Japan Automobile Manufacturers Association, Inc. (JAMA). Members from Euro-NCAP FI-WG and ACEA EG-FI provided various opportunities for meaningful discussions, for which the authors are grateful. There are no concerns about intellectual property.
Related Research Data
References
- del Pozo de Dios E, Lázaro I, Delannoy P, Thomson, Versmissen T, van Nunen E. . Development of a structural interaction assessment criteria using progressive deformable barrier data. Paper presented at: 23rd International Technical Conference on the Enhanced Safety of Vehicles (ESV); May 27–30, 2013; Seoul, South Korea.
- Edwards M, Cuerden R, Price J, Broughton J. . Estimation of the benefits for potential options to modify UNECE regulation number 94 to improve a car’s compatibility. Paper presented at: 5th International Conference at Expert Symposium Accident Research (ESAR); September 7–8, 2012; Hannover, Germany.
- European New Car Assessment Programme. Assessment Protocol Adult Occupant Protection Version 9.0. 2018. Available at: https://cdn.euroncap.com/media/41761/euro-ncap-assessment-protocol-aop-v90.201811081418161176.pdf. Accessed November 9, 2018.
- European New Car Assessment Programme. MPDB Frontal Impact Testing Protocol Version 1.0. 2018. Available at: https://cdn.euroncap.com/media/41747/euro-ncap-mpdb-testing-protocol-v10.201811061520121613.pdf. Accessed November 9, 2018.
- European New Car Assessment Programme. Technical Bulletin (TB 027) Compatibility Assessment Version 1.0. 2018. Available at: https://cdn.euroncap.com/media/41786/tb-027-compatiblity-assessment-v10.201811161304153907.pdf. Accessed November 9, 2018.
- Johannsen H, Adolph T, Edwards M, Lazaro I, Versmissen T, Thomson R. . Proposal for a frontal impact and compatibility assessment approach based on the European FIMCAR Project. Traffic Inj Prev. 2013;14:S105–S115
- Johannsen H, Thomson R. . Compatibility Assessment: can the current ADAC MPDB test properly assess compatibility? Paper presented at: 2016 International Research Council on the Biomechanics of Injury (IRCOBI); September 14–16, 2016; Malaga, Spain
- Kübler L, Gargallo S, Elsäßer K. . Frontal crash pulse assessment with application to occupant safety. ATZ Worldwide. 2009;111:12–13.
- Sandner V, Ellway J, van Ratingen M. . EURO NCAP Frontal Impact Working Group report. Paper presented at: 25th International Technical Conference on the Enhanced Safety of Vehicles (ESV); June 5–8, 2017; Detroit, MI.
- Sandner V, Ratzek A. . MPDB—mobile offset progressive deformable barrier. Paper presented at: 24th International Technical Conference on the Enhanced Safety of Vehicles (ESV); June 8–11, 2015; Gothenburg, Sweden.
