
Abstract
Objective: Left turn across path with traffic from the opposite direction (LTAP/OD) is the second most frequent car-to-car intersection crash type after straight crossing path (SCP) in Germany and the United States. Intersection automated emergency braking (AEB) for passenger cars can address these crashes.
This study investigates 2 implementation strategies of intersection AEB addressing LTAP/OD crashes: (1) only the turning car is equipped with an intersection AEB and (2) turning and straight-heading cars are equipped with an intersection AEB. For each strategy, the influence of a safety zone around the vehicles that should not be entered is evaluated in terms of accident avoidance, injury mitigation, and change in velocity (delta-V) of remaining accidents. Results are given as a function of market penetration.
Methods: A total of 372 LTAP/OD crashes from the time series precrash matrix (PCM), a subsample of the German In-Depth Accident Study (GIDAS), were resimulated in the PRediction of Accident Evolution by Diversification of Influence factors in COmputer simulation (PRAEDICO) simulation framework. A Kudlich-Slibar rigid-body impact model and an injury risk curve derived from GIDAS were used to predict remaining moderate to fatal (Maximum Abbreviated Injury Scale [MAIS] 2 + F) injuries among car occupants.
Results: With a safety zone of 0.2 m, when the turning vehicle only was equipped with an intersection AEB, 59% of the crashes were avoided at a 100% market penetration. With both vehicles equipped the percentage increased to 77%. MAIS 2 + F injured occupants were reduced by 60 and 76%, respectively. Considering both the turning and the straight-heading vehicles, the delta-V decreased strongly with market penetration in remaining left-side impacts but only slightly in remaining frontal and right-side impacts. Eliminating the safety zone substantially decreases effectiveness in all conditions.
Conclusions: Implementation strategy and safety zone definition strongly influence the real-life performance of intersection AEB. AEB should be applied not only for the turning vehicle but also for the straight-going vehicle to benefit from the full potential. Situationally appropriate safety zone definitions, in line with human hazard perception, need more attention and are a key to balance true positive and false positive performance. Remaining delta-V does not decrease broadly; hence, there is no evidence that future LTAP/OD crashes will be generally of lower severity. This highlights the need for continuous development of in-crash protection.
Introduction
About one fifth of all fatal accidents in Europe and the United States occur at intersections or are related to them (European Commission Citation2016; NHTSA Citation2017). Intersection crashes can be divided into distinct categories (Sander Citation2018) depending on the movement direction and the actions of those involved. Straight crossing path (SCP) crashes account for 8% of police-recorded crashes and left turn across path/opposite direction (LTAP/OD) crashes account for 5% of police-recorded crashes according to an analysis of German In-Depth Accident Study (GIDAS) data. Intersection crashes are not only a current major concern but are even predicted to account for a larger share in future road traffic: Lubbe et al. (Citation2018) estimated that in the future intersection crashes will comparise a larger share of fatal car-to-car crashes in Germany when vehicles will be equipped with currently developed advanced driver assistance systems. Automated driving functions were predicted to be less effective for LTAP/OD crashes than for SCP crashes.
To date only a few car manufacturers offer driver assistance in intersection conflicts with other cars; for example, Volvo’s IntelliSafe, Audi’s Turn-Assist in LTAP/OD scenarios, Daimler’s Mercedes BAS Plus Cross-Traffic Assist, and Lexus’s Front Cross Traffic Alert in SCP scenarios. To aid in further proliferating these systems, the European New Car Assessment Programme (Euro NCAP) has announced the inclusion of intersection test scenarios for automated emergency braking (AEB) in 2020 (Euro NCAP Strategy Working Group Citation2015). In the LTAP/OD test scenario, only the AEB capabilities of the turning vehicle will tested. Some studies have assessed the effectiveness of intersection AEB without differentiation of the benefit achieved by turning and straight-heading cars (Scanlon et al. Citation2017; Van Auken et al. Citation2011), though the analysis by Sander (Citation2017) indicates that brake intervention of the straight-heading car will have a much smaller but complementary benefit compared to brake intervention of the turning car. Sander (Citation2017) estimated AEB effectiveness based on precrash simulation of time-series data using a precrash matrix (PCM). However, the effect of AEB intervention was presented to visualize decision-making steps of the algorithm. Consequently, instead of simulating both vehicles in the simulation until a crash or safe passing occurred, the trajectory predictions of the AEB algorithm at trigger time were used to evaluate whether, and under which conditions, the vehicles would crash. The algorithm predicts trajectories assuming a constant turn rate and acceleration, which does not necessarily represent real vehicle trajectories. Furthermore, the algorithm defines a crash when the safety zones around the cars are invaded, not when the actual vehicles’ come into contact. This simplification of using algorithm predictions as true values in Sander (Citation2017) is unlikely to have a drastic effect on the results but is expected to lead to a slight underestimation of AEB effectiveness, the exact magnitude of which has yet to be quantified.
This study has 2 objectives: First, to compare the effectiveness in crash avoidance and injury mitigation for implementation strategy A (when only the turning vehicle has an AEB function) and implementation strategy B (when both the turning and straight-heading vehicles have an AEB functionality) with a further developed simulation model compared to Sander (Citation2017). Second, to estimate the difference in effectiveness for crash avoidance and injury mitigation when a safety zone around the vehicles is introduced that should not be entered, triggering earlier AEB intervention.
Data and methods
The study uses the simulation PRediction of Accident Evolution by Diversification of Influence factors in COmputer simulation (PRAEDICO) framework (Sander Citation2018) to estimate the effectiveness of AEB in LTAP/OD scenarios. The process stages are as follows:
Specification of the AEB system to address LTAP/OD crashes and definition of metrics to measure effectiveness.
Selection of LTAP/OD scenarios in GIDAS and the related time-series PCM.
Simulation of the precrash phase using the selected LTAP/OD scenarios in up to 4 equipment modes of AEB to reflect the 2 implementation strategies.
Calculation of crash parameters for collisions that cannot be avoided such as principal direction of force, impact area, and change in velocity during impact (delta-V).
Calculation of weighting factors to make the selected scenarios representative for Germany.
Application of injury risk functions for passenger car occupants involved in front and side impacts.
Computation of the effectiveness for various market penetration rates of AEB using a statistical model.
Effectiveness metrics and AEB specification
Effectiveness was expressed in crashes avoided and injuries mitigated, both as a function of market penetration.
The proposed AEB system was based on an algorithm that investigates avoidance alternatives by braking and steering for both collision-involved vehicles as soon as they are on a predicted collision course (Sander Citation2017). The collision course was identified by a prediction of the trajectory of both vehicles by a constant turn rate and acceleration model (Sander Citation2018; Schubert et al. Citation2008). The AEB system was activated when braking and steering away from the pending crash within comfort margins was assessed as not feasible for the ego vehicle driver and the opponent vehicle driver (Sander Citation2017). The comfort threshold was set to 5 m/s2 longitudinal and lateral acceleration. Consistent with Sander (Citation2017), a safety zone was set around the vehicles and the algorithm used the safety boundaries instead of the physical boundaries of the vehicles for collision detection. A forward-looking sensor was placed 2 m behind the front bumper with a field of view of 120° and a range of 2–70 m (Sander Citation2018). These parameter values are sufficient to detect other vehicles in LTAP/OD scenarios in due time before an AEB intervention decision has to be made (see figure 13 in Sander Citation2017). The sampling frequency of the sensor was 40 Hz and 5 samples were necessary to enable tracking. An object was visible when the full length of at least one side was within the sensor’s field of view and the sight was not obstructed by any object in the environment. Additionally, the angle between the sight line (side midpoint to sensor origin) and the normal vector of the side was 45° or less. The brake delay time of the brake system was 150 ms and the brake jerk was 28 m/s3, representing a mid-class car (Edwards et al. Citation2014; Seiniger et al. Citation2013). Brakes were applied to reach maximum deceleration with the available road friction coefficient, which was also assumed to be available for the AEB algorithm.
A safety zone was introduced in Sander (Citation2017) to address consequences of the field of safe travel as studied by Gibson and Crooks (Citation1938). Drivers are uncomfortable when they are too close to other road users. Sensor information inaccuracies and system latencies lead to uncertainties of predicted trajectories and, thus, exact prediction of collision occurrence. Safety zones around vehicles address this issue and allow balancing high system effectiveness versus a low number of unnecessary activations. Thus, a safety zone was used as a surrogate for the outer dimension of the conflict-involved cars. Two different safety zones were used in the simulations: A safety zone of 0.2 m (the outer dimensions of each car were offset by 0.2 m resulting in an increase in length and width by 0.4 m) and a safety zone of zero (the safety zone corresponds to the outer dimensions).
Data and weighting
GIDAS provides in-depth accident data collection for 2 locations in Germany, Hanover and Dresden (Otte et al. Citation2003). The crashes must occur in specific shifts of time in the data collection region. At least one person involved in the crash must be injured so that a case is eligible for recording in the GIDAS database. Weighting is recommended for analysis of the data to make it representative to the national accident data, Destatis, provided by the Federal Statistics Office (Hautzinger et al. 2004). A subsample of the GIDAS data is the PCM, which provides detailed information of specific vehicle parameters such as center of gravity position and inertias, vehicle precrash trajectories up to 5 s before the crash, and information on the environment such as nonmoving objects obstructing sight, road edges, and lane markings (Schubert et al. Citation2013).
A total of 661 completely coded car-to-car LTAP/OD crashes were present in the GIDAS data from 1999 through the end of 2017. Of these crashes, 372 were recorded in the corresponding PCM database and were used in the precrash simulation.
A 2-stage weighting process was used to make the results of the analysis of the PCM cases representative of Germany (Sander Citation2017). In the first stage, LTAP/OD cases in the PCM were weighted to be representative of the LTAP/OD cases in GIDAS. In a second step, the LTAP/OD cases in GIDAS were weighted to be representative of Destatis. Both weights were then multiplied and normalized, which means that the sum of the weights represents the original sample size.
Precrash simulation
The precrash simulation process in PRAEDICO utilized a driver model for each conflict-involved vehicle, following a given path with a given speed profile by adjusting steering and gas and brake pedal input to a 12 degrees of freedom vehicle dynamics model (Sander Citation2018). Depending on the simulated equipment mode of the vehicles, the AEB system is either enabled or disabled. In case the AEB is deactivated, the vehicles follow the precrash trajectories of the corresponding real-world accident until the collision point is reached. With activated AEB, the trajectory may be altered due to AEB intervention, either leading to crash avoidance or a reduction in impact speed and a change in impact area.
Crash computation
If the crash cannot be avoided, immediate precrash information such as magnitude and direction of crash, velocity, vehicle mass and stiffness, and impact location in combination with a Kudlich-Slibar rigid-body impulse model (Kudlich Citation1966) was used to compute the change in velocity, delta-V, and the principal direction of force as described in detail in Sander and Lubbe (Citation2018).
Injury risk function
To estimate the risk of an at least moderate injury according to the Abbreviated Injury Scale 2005, Update 2008 (Maximum Abbreviated Injury Scale [MAIS] 2 + F; Gennarelli and Wodzin Citation2008), a binary logistic regression model based on GIDAS data was used. The model was developed in Sander and Lubbe (Citation2018) with the predictors delta-V (continuous), occupant age (continuous), impact type (categorical: front, near side compartment hit, near side no compartment hit, far side), vehicle registration year (categorical: <2003, ≥2003), accident location (categorical: urban, rural), and the interaction between delta-V and impact type to estimate the probability of an MAIS 2 + F injury (categorical: yes, no). Only belted occupants 13 years of age and older were considered in the model. For the application of the model it was assumed that all occupants used vehicles within the newer vehicle registration year category.
Statistical modeling of market penetration
At each market penetration rate, there is a specific probability that each crash-involved vehicle is equipped with an AEB system functional in intersections. Two different implementation strategies are considered:
Implementation strategy A: AEB functionality is only available for the turning vehicle. Two equipment modes were considered: No vehicle equipped, turning vehicle equipped.
Implementation strategy B: AEB functionality is available for turning and straight-heading vehicles. Four equipment modes were considered: No vehicle equipped, turning vehicle equipped, straight-heading vehicle equipped, and both vehicles equipped.
A simple probability model was derived based on 2 assumptions: (1) Vehicles with and without an AEB system have the same probability of being involved in a conflict and (2) conflict situations are rare events so that even if vehicles are not repaired after a crash the ratio between vehicles with and without AEB on the market will not change (Boran et al. Citation2012).
Results
The results are shown separately for either only the turning vehicle or both the turning and the straight-heading vehicles are equipped with intersection AEB. Impact types front, left side, and right side refer to the damage area of a vehicle; a head-on collision, for example, will be shown as 2 front impacts. The initial data sample of 372 LTAP/OD crashes (744 LTAP/OD impacts) represents 100% collisions at 0% market penetration of AEB. Remaining impacts refers to those impacts not avoided by AEB; we describe the remaining impacts by their impact type, delta-V, and injury consequences.
Outliers, defined as values greater than 1.5 times the interquartile range above the upper quartile and below the lower quartile, are not shown in the box plots in the Appendix (see online supplement). Diamonds in the box plots in the Appendix represent the mean delta-V.
Implementation strategy A: Only turning vehicle equipped
Safety zone of 0.2 m
The percentage of avoided accidents decreased linearly, and at 100% market penetration close to 60% of the accidents were avoided. The relative share of remaining front impacts increased slightly from 80 to 83% ().
Figure 1. Turning vehicle equipped—Impact type frequency of vehicles in the data sample as a function of market penetration with 0.2-m safety zone.
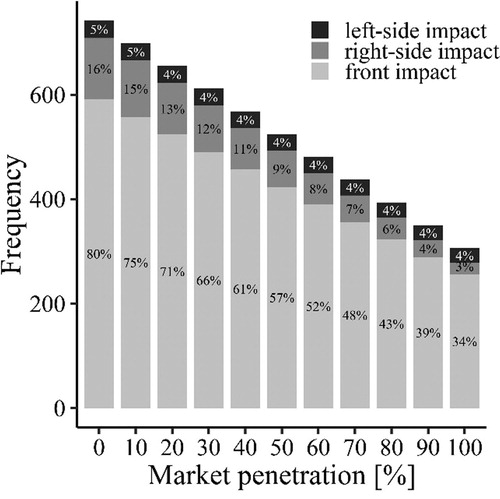
The median and mean delta-Vs of the remaining front impacts dropped substantially only at higher market penetration rates: from about 28 km/h at 0% market penetration through 26 km/h at 50% market penetration to 20 km/h at full market penetration (Figure A1, see online supplement). For remaining right-side impacts there was nearly no change in delta-V with increased market penetration (Figure A2, see online supplement). Mitigation of MAIS 2 + F injured occupants increased linearly up to 60% at 100% market penetration (Figure A4, see online supplement).
Figure 2. Turning vehicle equipped—Impact type frequency of vehicles in the data sample as a function of market penetration with no safety zone.
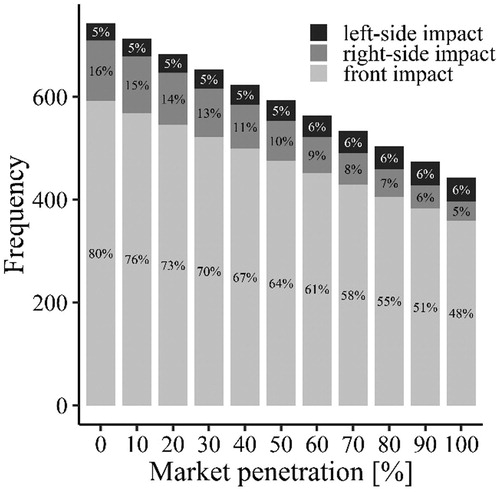
Zero safety zone
Setting the safety zone to zero led to a substantial reduction of crash avoidance capabilities (). At 100% market penetration 41%, of the accidents were avoided.
The median and mean delta-Vs of remaining front impacts were lower compared to the simulation results with a safety zone of 0.2 m, because fewer accidents with low impact speed were avoided altogether (Figure A5, see online supplement). Up to 29% of MAIS 2 + F injuries were prevented (Figure A8, see online supplement).
Implementation strategy B: Both vehicles equipped
Safety zone of 0.2 m
When both vehicles had an AEB function available, over three fourths of all crashes were prevented. Remaining frontal impact prevention was highly effective () and exceeded the performance of implementation strategy A of equipping only the turning vehicle with AEB (). The relative share of remaining frontal impacts decreased from 80 to 74%. Remaining side impact prevention effectiveness did not benefit as much from equipping both vehicles.
Figure 3. Both vehicles equipped—Impact type frequency of vehicles in the data sample as a function of market penetration with 0.2-m safety zone.
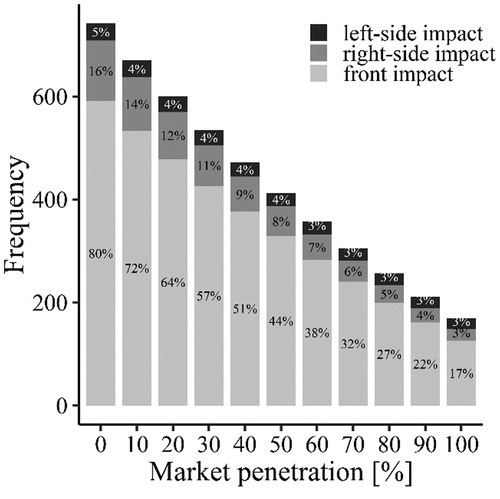
The mean and median delta-Vs of remaining front impacts were also somewhat lower compared to implementation strategy A (Figure A9, see online supplement). Substantial differences were present in the decrease in delta-V for remaining right-side impacts: At 100% market penetration, the median delta-V was reduced by more than 5 km/h (Figure A10, see online supplement).
The reduction in MAIS 2 + F injured occupants reached 76% at full market penetration (Figure A12, see online supplement).
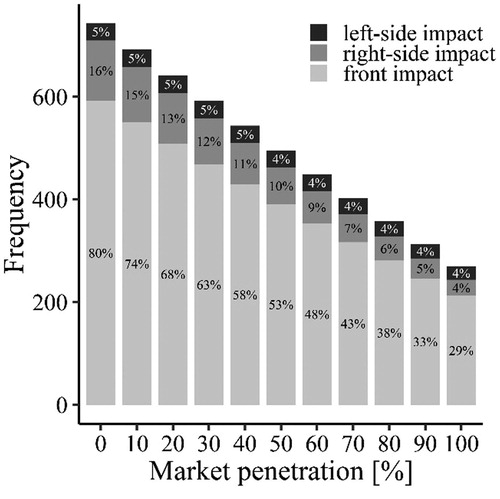
Zero safety zone
The effectiveness of accident avoidance (up to 63%) and MAIS 2 + F injury mitigation (up to 60%) with no safety zone was substantially lower compared to the configuration with a 0.2-m safety zone (; Figure A16, see online supplement). The median and mean delta-V values of remaining accidents were slightly decreased (Figures A13–A15, see online supplement).
Figure 4. Both vehicles equipped—Impact type frequency of vehicles in the data sample as a function of market penetration with no safety zone.
Discussion
The crash avoidance rate of 77%, with both vehicles equipped and a safety zone of 0.2 m, is comparable to the maximum estimated crash avoidance in Scanlon et al. (Citation2017) of 71% in LTAP/OD crashes based on U.S. data and also similar to the estimated 79% in SCP crashes when both vehicles are equipped with wide (180°) field-of-view sensors (Sander and Lubbe Citation2018). The present results also quantify how crash avoidance and injury mitigation are reduced with lower market penetration and when a safety zone is not implemented.
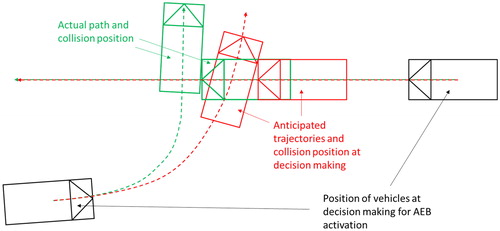
This study provides a more accurate estimate than Sander (Citation2017), simulating vehicle dynamics with AEB intervention until collision or safe passing, instead of relying on algorithmic approximations. As a result, the effectiveness computed in this study is about 11 to 19% higher than the effectiveness presented in Sander (Citation2017) for the turning vehicle only and for both vehicles equipped, respectively. The difference is mainly due to the safety zone around the vehicle, which provides an extra margin until the physical boundaries of the vehicle are reached. When the safety zone is set to zero, the results from Sander (Citation2017) and this study at 100% market penetration are of the same magnitude. Second, in-depth analysis showed that in some cases the anticipated intersection point of the predicted paths was identified closer to the straight-heading vehicles at the decision-making point than the actual collision point (). Thus, the straight-heading vehicles gained some extra distance to decrease speed. Finally, immediate precrash avoidance steering added some further distance.
Figure 5. After initiation of the turning process, drivers continuously increase the steering wheel angle to a certain maximum and then decrease the steering wheel angle again (sinusoidal steering resulting in a clothoid). When decision making for AEB intervention is issued at an early stage of the steering process (black vehicle positions), the anticipated trajectory of the turning vehicle may not represent its actual trajectory. Thus, the anticipated collision position (red vehicle positions) may be closer to the straight heading vehicle than the actual collision position (green vehicle positions).
Furthermore, we present injury mitigation and a relation between market penetration rate and effectiveness, whereas Sander (Citation2017) presented only collision avoidance at 100% market penetration.
Implications of implementation strategy and safety zone
When both vehicles were equipped with an AEB system, the reduction in crashes compared to that when only the turning vehicle was equipped was up to 20% higher. The delta-V of remaining front and right-side impacts was substantially reduced when both vehicles were equipped. The absolute number of remaining right-side impacts was not increased. Hence, MAIS 2 + F injuries were substantially reduced as well. Across the different AEB configurations, about 1.5 times as many occupants were predicted to sustain MAIS 2 + F injuries for implementation strategy A (only turning vehicle equipped) compared to implementation strategy B (both vehicles equipped).
Reducing the safety zone from 0.2 m to 0 for each vehicle is presumably not a substantial change considering vehicle dimensions and crash kinematics; however, this resulted in a substantial change in effectiveness. The crash avoidance effectiveness was reduced by up to 18% for implementation strategy A and up to 14% for implementation strategy B. The safety zone will substantially influence real-world performance but foreseeably not Euro NCAP test performance. Euro NCAP is only concerned with true positive performance and has well-defined impact and environment conditions. Vehicle kinematics are fixed and a safety zone would only be needed to compensate for remaining system inaccuracies (e.g., sensor measurement inaccuracies) to reliably activate. These inaccuracies are generally small and systems are expected to activate even with no safety zone at all. Larger safety zones will therefore not affect the already reliable activation in Euro NCAP scenarios. In real-world situations, on the other hand, large uncertainties about the kinematics exist. A large safety zone can compensate for these and ensure more reliable activation in crash conditions (better true positive performance) but might also trigger premature activation in passing conditions (worse false positive performance). This makes the safety zone an important yet not well-documented parameter for the expected benefits and merits further investigation for its effects on balancing real-world true positive and false positive performance as well as its perceived subjective benefit and nuisance as, for example, explored in Ferrier-Barbut et al. (2018) for pedestrian passing distances.
Remaining delta-V: Implication for in-crash protection
The analysis of remaining delta-V allows us to draw conclusions on the expected crash severity of the remaining collisions in more detail than predicted injury frequencies from formal modeling of injury risk relations (Kullgren Citation1998), which we also provide, and can inform decisions on in-crash protection. We note that LTAP/OD crashes in our data are typically not high-severity crash events because most of the intersections have a speed limit of 50 km/h and turning can usually only be carried out at low driving speeds.
For remaining frontal impacts, median delta-V decreased only slightly and only at high market penetration rates and, as expected, somewhat earlier for both vehicles equipped compared to only turning vehicles equipped (below 25 km/h at 50 and 70% market penetration). The upper-end delta-V, which means the delta-V at the end of the upper whisker, did not decrease substantially and remained around 40 km/h across market penetration rates. Hence, in-crash protection needs will not be substantially lower in a future where most vehicles are equipped with intersection AEB. Today’s frontal impact regulation with an offset deformable barrier test at 56 km/h seems to exceed predicted remaining frontal impact severities and hence provides adequate evaluation of structural integrity. Lower test speeds in frontal impacts can be a valuable addition to assess injury risks and the benefits of advanced restraint systems. A high proportion of MAIS 2 + F injuries occur in frontal crashes with a delta-V below 32 km/h (Östling et al. Citation2017). Further, most car-to-car front-to-rear impacts have a delta-V below 20 km/h (Bálint et al. Citation2013).
For remaining right-side impacts, we see almost no reduction in median and upper-end delta-Vs of 22 and 39 km/h if only the turning vehicle is equipped and only moderate reductions at high implementation rates for both vehicles equipped. Delta-V was higher than that in SCP crashes at all market penetration rates (Sander and Lubbe Citation2018). These findings again substantiate the need for in-crash protection, albeit substantial collision prevention can be achieved with AEB. Right-side impact in Germany’s right-hand traffic is a far-side impact. Far-side impact crashes are currently not regulated but are planned for Euro NCAP assessment as a sled test procedure from 2020 on (Euro NCAP Citation2017). According to our findings, far-side crashes will reduce in frequency but remain of similar severity. An assessment of measures to prevent injuries typically sustained at today’s crash severities can be expected to be valid for some time into the future.
For the remaining left-side impacts, the picture is different. Current crashes were at lower severity than front and right-side crashes and lower delta-V compared to left-side SCP crashes (Sander and Lubbe Citation2018). Though AEB appears to be least effective in preventing this crash type altogether, it is very effective in reducing crash severity at high market penetration rates. With a remaining upper-end delta-V of 6 km/h at 90% market penetration, in-crash protection seems to require less attention for this accident scenario and crash type in the far future. One should keep in mind, though, that other accident scenarios may not be addressed as successfully by AEB.
Study limitations
This study is based on German accident data for which weight factors have been calculated and applied to make results representative of German national accident statistics. However, Germany is not representative of Europe (Flannagan et al. Citation2018) or other parts of the world. Thus, the results should not be translated directly to other countries.
For all simulations conducted, an ideal object detection and classification was assumed. Thus, true object positions without measurement uncertainties were fed into the algorithm. Ideal coefficient of friction estimation was assumed; that is, the true road friction coefficient was available for the AEB algorithm. Accurate and real-time friction estimation is an important ongoing issue in research and development. Further, processing delays were not considered.
The effect of these limitations can be appreciated when comparing prospective and retrospective effectiveness estimates for the same technology. Sander (Citation2018) presented simulation results of a rear-end AEB with specifications similar to those of the intersection AEB, using idealized models, and the result showed effectiveness that is twice as high in crash avoidance compared to results from retrospective field data analysis. However, rear-end AEB systems in the field likely do not utilize such a complex algorithm as that used for the presented intersection AEB.
We can speculate that changing from an ideal coefficient of friction estimate to a fixed estimate would not affect our results if the fixed value were below the true value and therefore trigger earlier intervention. With the injury and crash avoidance performance unaffected, the consequence would only be an increase of premature interventions. Assuming a fixed friction coefficient above the true value would lead to underestimating the distances needed to avoid collisions and potentially lower injury and crash avoidance performance. Recalling that intersection crashes can be avoided by small interventions, it can be enough to just touch the brakes lightly, without necessarily coming to a full stop, for the other vehicle to pass. Hence, quantification of the injury and crash avoidance performance loss due to road friction overestimation is a complex research question.
The given results were based on specific settings of the AEB systems, which include settings for the sensor model, information processing, algorithm specification, and characteristics of the actuation model. A variation of these settings will result in different system effectiveness as shown in Sander (Citation2017). The application of the AEB system model to real-world conditions may require modifications to the presented settings. Thus, the results regarding effectiveness should not be interpreted as absolute values accurate for real-world implementation but rather as relative values to estimate the effect of different implementation strategies.
Supplemental Material
Download PDF (1.3 MB)Acknowledgments
We thank Hanna Jeppsson and Junaid Shaikh from Autoliv for their assistance in carrying out the simulations. This work was carried out in association with SAFER–Vehicle and Traffic Safety Centre at Chalmers, Sweden.
Related Research Data
References
- Bálint A, Fagerlind H, Kullgren A. A test-based method for the assessment of pre-crash warning and braking systems. Accid Anal Prev. 2013;59:192–199.
- Boran C, Bostrom O, Jacobson BJH, Lie A, Sander U. Saving Lives with V2X Versus On-board Sensing Systems—Which Will Be More Effective?: Technology Leadership Brief. In: SAE Technical Papers. Vol 11. Detroit, MI: SAE International; 2012. Available at: http://papers.sae.org/2012-01-9017/.
- Edwards M, Nathanson A, Wisch M. Estimate of potential benefit for Europe of fitting autonomous emergency braking (AEB) systems for pedestrian protection to passenger cars. Traffic Inj Prev. 2014;15:S173–S182.
- Euro NCAP. Far Side Occupant Test & Assessment Procedure. Brussels, Belgium: Euro NCAP; 2017 . Available at: https://cdn.euroncap.com/media/32284/euro-ncap-far-side-test-and-assessment-protocol-v10.pdf. Accessed August 20, 2018.
- Euro NCAP Strategy Working Group. 2020 Roadmap. Brussels, Belgium: Euro NCAP; 2015. Available at: https://cdn.euroncap.com/media/16472/euro-ncap-2020-roadmap-rev1-march-2015.pdf. Accessed August 20, 2018.
- European Commission. Traffic Safety Basic Facts on Junctions. Brussles, Belgium: European Commission; 2016. Available at: https://ec.europa.eu/transport/road_safety/sites/roadsafety/files/pdf/statistics/dacota/bfs2016_junctions.pdf. Accessed August 20, 2018.
- Ferrier-Barbut E, Vaufreydaz D, David J-A, Lussereau J, Spalanzani A. Personal space of autonomous car’s passengers sitting in the driver’s seat. Paper presented at: 2018 IEEE Intelligent Vehicles Symposium (IV); 2018; Changshu, Suzhou, China. Available at: https://ieeexplore.ieee.org/document/8500648/.
- Flannagan CAC, Bálint A, Klinich KD, et al. Comparing motor-vehicle crash risk of EU and U.S. vehicles. Accid Anal Prev. 2018;117:392–397.
- Gennarelli TA, Wodzin E, eds. The Abbreviated Injury Scale 2005–Update 2008. Barrington, IL: Association for the Advancement of Automotive Medicine; 2008.
- Gibson JJ, Crooks LE. A theoretical field-analysis of automobile-driving. Am J Psychol. 1938;51:453–471.
- Hautzinger H, Pfeiffer M, Schmidt J. Expansion of GIDAS sample data to the regional level: statistical methodology and practical experiences. Paper presented at: 1st International Conference on ESAR “Expert Symposium on Accident Research”; 2004; Hanover, Germany.
- Kudlich H. Beitrag zur Mechanik des Kraftfahrzeug-Verkehrsunfalls [Doctoral Dissertation]. Wien Austria: Techn. Hochschule Wien; 1966.
- Kullgren A. Validity and reliability of vehicle collision: crash pulse recorders for impact severity and injury risk assessment in real-life frontal impacts [Doctoral Dissertation]. Stockholm: Karolinska Institutet, Department of Clinical Neuroscience; 1998.
- Lubbe N, Jeppsson H, Ranjbar A, Fredriksson J, Bärgman J, Östling M. Predicted road traffic fatalities in Germany: the potential and limitations of vehicle safety technologies from passive safety to highly automated driving. IRCOBI Conf. 2018. 2018; September:17–52.
- NHTSA. Traffic Safety Facts 2015: A Compilation of Motor Vehicle Crash Data from the Fatality Analysis Reporting System and the General Estimates System. Washington, DC: U.S. Department of Transportation, National Highway Traffic Safety Administration; 2017. Available at: https://crashstats.nhtsa.dot.gov/Api/Public/ViewPublication/812384. Accessed August 20, 2018.
- Östling M, Saito H, Vishwanatha A, Ding C, Pipkorn B, Sunnevång C. Potential benefit of a 3 + 2 criss cross seat belt system in frontal and oblique crashes. IRCOBI Conf. 2017. 2017;46:613–622.
- Otte D, Krettek C, Brunner H, Zwipp H. Scientific approach and methodology of a new in-depth-investigation study in Germany so called GIDAS. Paper presented at: 18th International Technical Conference on the Enhanced Safety of Vehicles (ESV); 2003; Nagoya, Japan.
- Sander U. Opportunities and limitations for intersection collision intervention—a study of real world “left turn across path” accidents. Accid Anal Prev. 2017;99:342–355.
- Sander U. Predicting safety benefits of automated emergency braking at intersections virtual simulations based on real-world accident data [Doctoral Dissertation]. Gothenburg: Chalmers University of Technology; 2018.
- Sander U, Lubbe N. Market penetration of intersection AEB: characterizing avoided and residual straight crossing path accidents. Accid Anal Prev. 2018;115:178–188.
- Scanlon JM, Sherony R, Gabler HC. Preliminary effectiveness estimates for intersection driver assistance systems in LTAP/OD crashes. Paper presented at: 4th International Symposium on Future Active Safety Technology Towards Zero Traffic Accidents; 2017; Nara, Japan.
- Schubert A, Erbsmehl C, Hannawald L. Standardized pre-crash scenarios in digital format on the basis of the VUFO simulation input data from GIDAS. Paper presented at: 5th International Conference on ESAR “Expert Symposium on Accident Research”; 2013; Hanover, Germany.
- Schubert R, Richter E, Wanielik G. Comparison and evaluation of advanced motion models for vehicle tracking. FUSION. 2008;1:1–6.
- Seiniger P, Bartels O, Pastor C, Wisch M. An open simulation approach to identify chances and limitations for vulnerable road user (VRU) active safety. Traffic Inj Prev. 2013;14(Suppl. 1):S2–S12.
- Van Auken RM, Zellner JW, Chiang DP, et al. Advanced Crash Avoidance Technologies Program—Final Report of the Honda-DRI Team Volume I: Executive Summary and Technical Report. Washington, DC: U.S. Department of Transportation, National Highway Traffic Safety Administration; 2011.
