
 ?Mathematical formulae have been encoded as MathML and are displayed in this HTML version using MathJax in order to improve their display. Uncheck the box to turn MathJax off. This feature requires Javascript. Click on a formula to zoom.
Abstract
Objective: The objective of this research study is to estimate the benefit to pedestrians if all U.S. cars, light trucks, and vans were equipped with an automated braking system that had pedestrian detection capabilities.
Methods: A theoretical automatic emergency braking (AEB) model was applied to real-world vehicle–pedestrian collisions from the Pedestrian Crash Data Study (PCDS). A series of potential AEB systems were modeled across the spectrum of expected system designs. Both road surface conditions and pedestrian visibility were accounted for in the model. The impact speeds of a vehicle without AEB were compared to the estimated impact speeds of vehicles with a modeled pedestrian detecting AEB system. These impacts speeds were used in conjunction with an injury and fatality model to determine risk of Maximum Abbreviated Injury Scale of 3 or higher (MAIS 3+) injury and fatality.
Results: AEB systems with pedestrian detection capability, across the spectrum of expected design parameters, reduced fatality risk when compared to human drivers. The most beneficial system (time-to-collision [TTC] = 1.5 s, latency = 0 s) decreased fatality risk in the target population between 84 and 87% and injury risk (MAIS score 3+) between 83 and 87%.
Conclusions: Though not all crashes could be avoided, AEB significantly mitigated risk to pedestrians. The longer the TTC of braking and the shorter the latency value, the higher benefits showed by the AEB system. All AEB models used in this study were estimated to reduce fatalities and injuries and were more effective when combined with driver braking.
Introduction
Pedestrian fatalities in the United States have increased by 36% since 2011, reaching a high of 6,080 vehicle-related fatalities in 2016. To date, there is no consensus for the reasons for the increase in pedestrian fatalities, but several studies have explored mitigation strategies to reduce risk to pedestrians. One potential mitigation strategy that promises to reduce crashes is pedestrian automatic emergency braking (AEB; Highway Loss Data Institute Citation2017). Pedestrian-detecting AEB systems are designed to use a combination of camera and radar sensors to detect pedestrians in the predicted vehicle’s path, warn the driver, and initiate braking if necessary (Ono et al. Citation2016).
Pedestrian AEB systems mitigate pedestrian fatality and injury by either avoiding the collision or, if avoidance is not possible, reducing the velocity of the vehicle, thereby decreasing the impact speed. Studies have shown that pedestrian injury severity is highly related to impact speed and decreasing impact speed can decrease a pedestrian’s risk of fatality and injury (Lubbe and Kullgren Citation2015; Rosén et al. Citation2010; Rosén and Sander Citation2009). Several studies have examined the potential benefit of AEB using European data (Edwards et al. Citation2014; Hamdane et al. Citation2015), but little has been published on pedestrian AEB in the United States. U.S. vehicle–pedestrian research has been limited in part by the lack of recent in-depth vehicle–pedestrian crash data.
The Insurance Institute for Highway Safety conducted a study that characterized the primary pedestrian crash scenarios using the General Estimates System (GES) and the Fatality Analysis Reporting System (FARS). They concluded that if active safety measure were able to prevent the three most common crash scenarios then 65% of vehicle–pedestrian crashes and 58% of pedestrian fatalities could potentially be mitigated (Jermakian and Zuby Citation2011). The National Highway Traffic Safety Administration (NHTSA) conducted a study in which they supplemented GES and FARS data with track testing of 3 pedestrian AEB systems (Yanagisawa et al. Citation2017). They used a Monte Carlo simulation to estimate AEB effectiveness. They concluded that about 77.6% of crashes in their target population of crashes could be avoided. FARS and GES do not contain in-depth crash information necessary for simulating AEB crash mitigation potential on real-world crashes. The Pedestrian Crash Data Study (PCDS) is the most recent in-depth pedestrian study in the United States that contains crash scene diagrams, reconstructions, and detailed pedestrian injury information. A comparison of these studies is shown in .
Table 1. Comparison of pedestrian effectiveness studies conducted in the United States and internationally.
The objective of this study was to estimate the benefit to pedestrians if all U.S. cars, light trucks, and vans were equipped with an automated braking system with pedestrian detection capabilities.
Methods
The overall approach in this study consisted of 3 main components. First, the model of a hypothetical AEB system with pedestrian detection ability, henceforth referred to as pedestrian AEB, was developed to determine the system’s effect on the crash. Second, a pedestrian injury model was developed to quantify the effect of crash factors on injury and fatality risk for the struck pedestrians. Finally, the pedestrian AEB model and injury risk curve were applied to real-world cases to determine the benefit if all cars and light trucks and vans (LTVs) were equipped with pedestrian AEB.
Data sources
To conduct this study, 3 U.S. databases were utilized: (1) PCDS, (2) GES, and (3) FARS. A comparison of crash characteristics for the 3 databases is included in Appendix A (see online supplement).
PCDS is the most recent in-depth vehicle–pedestrian crash database in the United States. PCDS data were collected by NHTSA from 1994 to 1998 across 6 urban areas in the United States. The study consisted of 530 vehicle–pedestrian crashes that involved 549 pedestrians. Cases were selected from police-reported vehicle–pedestrian crashes that involved forward-moving late model vehicles (model years 1988–1999). PCDS selection criteria excluded cases in which pedestrians were lying down or sitting prior to the crash, the vehicle structure was modified after purchase, the vehicle hit an object other than a pedestrian, and if the pedestrian was not struck by the front of the vehicle; that is, in front of the top of the A-pillar. For each case a crash scene investigator was on scene within 24 h of the crash and recorded detailed information on the scene, vehicle, and pedestrian injuries. Additionally, the crash scene investigator created a scene diagram and reconstructed the crash to determine impact speed.
PCDS cases were excluded if impact speed was missing, pedestrian age was missing, the time visible could not be determined, or the pedestrian was a child under age 15. Of the 530 cases in PCDS, 87 were missing impact speeds. We were unable to estimate the time that the pedestrian was visible in an additional 11 cases. In 94 cases, the pedestrians were under the age of 15 or pedestrian age was missing. The final sample used in this study consisted of 338 cases involving 346 pedestrians.
GES and FARS are nationally representative databases collected by NHTSA. GES is a weighted sample that represents all police-reported crashes (NHTSA Citation2018b). FARS is a census of all fatalities that occurred on public roads in the United States (NHTSA Citation2018a). GES does not contain all low-severity crashes because these are less likely to be reported and have inherent sampling error because it is not feasible to investigate every crash (Shelton Citation1991). Stutts and Hunter (Citation1998) found that vehicle–pedestrian crashes that occurred on nonroadways, those in which the pedestrian was not hospitalized, or crashes involving pedestrians aged 15–24 were less likely to be reported. In FARS every fatality is investigated.
Data from 2011 to 2015 were analyzed in this study. In order to compare the FARS and GES databases to PCDS, a target population was determined consisting of all vehicle–pedestrian collisions that were frontal impacts, not a result of loss of control, in which the striking vehicle was a car or LTV and the pedestrian was aged 15 years or older. FARS and GES provide no information on pedestrians lying down or sitting, but these are expected to be a tiny fraction of all pedestrians struck. The target population accounts for 68.8% of pedestrian fatalities and 56.2% of pedestrians struck.
PCDS is a clinical sample and not inherently nationally representative. To correct for this potential bias, a weighting scheme was developed based on vehicle type and police-reported injury severity to match the proportions seen in the GES from 2011 to 2015. Injury severity is recorded in GES using the KABCO scale. KABCO is an injury scale used by law enforcement to rank injury severity in which K (killed) represents a fatal injury, A is a suspected serious injury, B is a suspected minor injury, C is possible injury, and O in no injury (NHTSA Citation2018a). As an example, our analysis showed that PCDS undersampled low-severity crashes, so the weighting factor for low-severity PCDS crashes was greater than 1. Fatal and incapacitating injury crashes were oversampled, so the weighting factor for these crashes tended to be less than 1. FARS was primarily used to find the target population so that PCDS effectiveness could be compared to real-world fatality numbers.
AEB model with pedestrian detection ability
The pedestrian AEB system was modeled to function by (1) detecting the pedestrian and (2) applying emergency braking. The system effectiveness depends primarily on the time the pedestrian was visible, vehicle travel speed, road surface conditions, system computational latency, and the time-to-collision (TTC) threshold at which the system initiates emergency braking. The time the pedestrian was visible, travel speed, and road surface conditions were calculated from PCDS cases.
The AEB system with pedestrian detection was modeled with a range of computational latencies (0–0.3 s) and braking TTC thresholds (0.5–1.5 s). Computational latency is the time required for the system to recognize that the object detected is a pedestrian and to determine that the pedestrian is on a collision course with the vehicle. These values were chosen based on a study that looked at pedestrian classification using video and pedestrian walking motion (Fuerstenberg and Dietmayer Citation2004). Fuerstenberg and Dietmayer (Citation2004) identified a 0.3-s latency based on their testing configuration due to the system necessity for a complete walking cycle. Lower computational latencies were also included because as systems improve, the computational latency is expected to decrease. As shown in EquationEq (1)(1)
(1) , TTC was defined as the distance to the pedestrian divided by the vehicle’s instantaneous velocity. The TTC threshold range was adapted from typical braking thresholds reported by Rosén (Citation2013).
(1)
(1)
The modeled pedestrian AEB system calculated time the pedestrian was visible (hereafter referred to as detection time) by taking into account walking speeds and obstructions. Detection time was defined as the distance the pedestrian traveled unobstructed in the road divided by the pedestrian’s estimated walking speed (EquationEq. (2)(2)
(2) ). Distance traveled was calculated by multiplying the number of unobstructed lanes the pedestrian crossed by an estimated lane width of 3 m. Three meters is on the shorter range of U.S. lane widths (Stein and Neuman Citation2007), but this value was conservatively chosen because a shorter lane width would result in lower detection times. Walking speed was estimated based on pedestrian age. Estimated walking speed ranged from 1.15 to 1.45 m/s (Gates et al. Citation2006).
(2)
(2)
The pedestrian AEB system braking peak magnitude was assumed to reach 0.8 g in dry road conditions, 0.4 g in wet road conditions, and 0.3 g in icy road conditions (Scanlon et al. Citation2017). It was assumed that AEB would increase braking deceleration at a jerk of −30 m/s3 (Lubbe and Kullgren Citation2015). There were 3 possible braking configurations: if the pedestrian was detectable for (1) longer than the latency and threshold combined, the system started braking at a TTC value equivalent to the TTC threshold; (2) longer than the threshold but not longer than the latency and threshold combined, the system started braking once the TTC threshold was reached and latency period had elapsed; and (3) less than the TTC threshold, the system started braking once the latency period had elapsed (i.e., after the system had identified the pedestrian).
Travel speed of the vehicle was estimated by assuming 2 human braking patterns (Kusano and Gabler Citation2012). The method described is based on work done in estimating TTC of braking (Kusano and Gabler Citation2011). The first pattern modeled a driver who braked late but with a hard magnitude. The late and hard braking driver braked at 0.4 s TTC and reached a deceleration of 0.4 g. The second pattern modeled a driver who braked early but with a weak magnitude. The early and weak braking driver braked at a TTC of 2 s and reached a deceleration of 0.2 g. Both driver braking patterns assumed a jerk of −10.7 m/s3 (Lubbe and Kullgren Citation2015). These 2 patterns are intended to model the range of typical driver braking and thereby form a bound between which most drivers would fall. Using EquationEq. (3)(3)
(3) , travel speeds were estimated given impact speeds and whether or not there was evidence of driver braking from the PCDS database.
and
are the calculated travel speed and impact speed (m/s),
is the maximum acceleration (m/s2),
is the jerk or deceleration rate (m/s3), and TTC is the time to collision (s). If there was no evidence of braking, it was assumed that the travel speed was equivalent to the impact speed.
(3)
(3)
Pedestrian injury model
The pedestrian injury model was developed using the Maximum Abbreviated Injury Scale (MAIS) coding from PCDS (PCDS injury coding used AIS-90). PCDS was used for this assessment because GES and FARS do not report injury severity using AIS. AIS ranges from 1 to 6, with AIS 1 indicating minor injury and AIS 6 indicating maximal injury. For this study, an MAIS score of 3 or higher, including fatalities, (MAIS3 + F) injury curve and a fatal injury curve were developed for pedestrians struck by cars and LTVs separately. This approach was followed because injuries sustained from being struck by a car and those sustained from being struck by an LTV are expected to be different due to different striking geometries and heights (Lefler and Gabler Citation2004). A logistic model was fit to the weighted PCDS data using impact speed and age as covariables. Details on the model can be found in Appendix B (see online supplement).
Benefit calculation
The risk calculation for pedestrian AEB-equipped vehicles utilized the impact speeds calculated from the AEB model. The risk calculation for vehicles without AEB utilized the impact speed reported in PCDS. The fatality and MAIS 3 + F risks were calculated using EquationEqs. (4)(4)
(4) and Equation(5)
(5)
(5) in which fatal risk and MAIS 3 + F risk were the proportions calculated from the injury models and wt is the case weight. If the impact speed was zero, meaning the crash was avoided and the fatal risk and MAIS 3 + F risk were set to zero.
(4)
(4)
(5)
(5)
As shown in EquationEqs. (6)(6)
(6) and Equation(7)
(7)
(7) , the percentage change in fatality and MAIS 3 + F injury risk was calculated by first summing the risk across all cases if the vehicle had a pedestrian AEB system. This value was then compared to the risk if the vehicle did not have a pedestrian AEB system. Because none of the vehicles in this study were equipped with pedestrian AEB, it was assumed that the actual event was a good estimation of a vehicle without pedestrian AEB. Fatal risk no AEB and MAIS 3 + F risk with no AEB were the proportions calculated from the injury models without AEB, and wt is the case weight.
(6)
(6)
(7)
(7)
Results
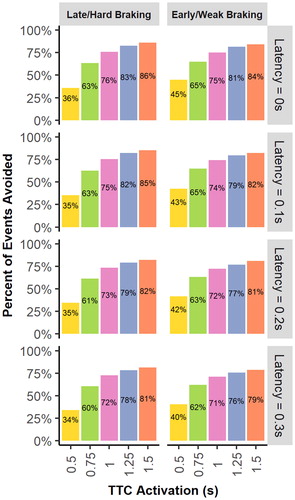
As expected, the pedestrian AEB system modeled was more effective at avoiding crashes for system designs with a higher TTC threshold and a lower computational latency (). At low TTC thresholds (below 0.75 s), the highest effectiveness was observed for early weak braking drivers, but at larger TTC thresholds the late hard braking drivers actually had greater effectiveness (). The early and weak braking driver likely showed lower effectiveness due to the method used to calculate travel speed. Early weak braking drivers’ travel speeds were higher than their corresponding late hard braking drivers’ travel speeds.
Figure 1. AEB system effectiveness at a range of TTC values and latency values for both the late/hard braking driver scenario and the early/weak braking driver scenario.
For the cases in which the crash was not avoided, generally shows an increase in average reduction in velocity with increased TTC and decreased computational latency. Early weak braking drivers resulted in larger average changes in velocity compared to late hard braking drivers. This confirms that early late braking drivers had lower effectiveness due to the initial travel speed because even though early weak braking drivers had larger changes in velocity, they were not able to completely avoid the crash. The average change in velocity for late/hard braking drivers and early/weak braking drivers ranged from 10 to 25 kph and from 18 to 30 kph, respectively.
Figure 2. AEB system average change in velocity for unavoided cases for a range of TTC and latency values for both the late/hard braking driver scenario and the early/weak braking driver scenario. The number on the bar corresponds to the number of unavoided cases.
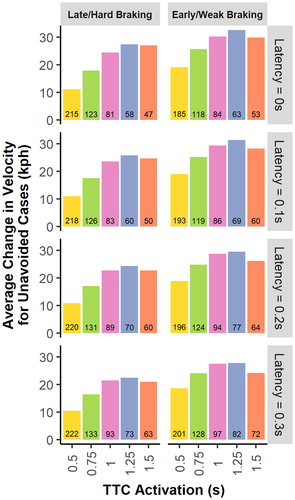
Early and weak braking drivers showed slight decreases in change in velocity at a TTC value of 1.5 s (). As TTC increases, increasing numbers of cases are estimated to be avoided, finally leaving only those cases in which AEB with pedestrian detection ability can do little to avoid. The remaining cases have lower estimated earliest pedestrian detection opportunity and often have adverse road surface conditions (e.g., wet or icy roads) that reduce the ability of the vehicle to brake.
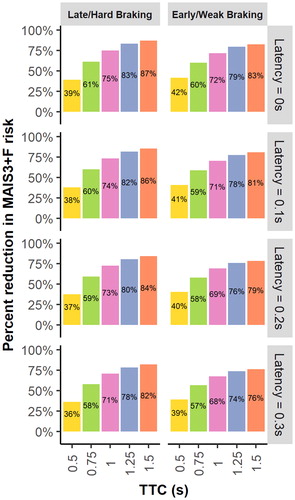
and further show that increasing TTC and decreasing latency increase the system’s effectiveness at reducing pedestrian fatalities and MAIS 3 + F injuries. The fatality and MAIS 3 + F change in risk (effectiveness) was very similar. Fatality and MAIS 3 + F effectiveness differed by only 1% across most TTC and latency values. The most beneficial system (TTC = 1.5 s and latency = 0 s) was estimated to decrease fatality risk between 84 and 87% and injury risk (MAIS 3+) between 83 and 87% for the target population.
Figure 3. Percentage change in fatality risk for a range of TTC and latency values for both the late/hard braking driver scenario and the early/weak braking driver scenario.
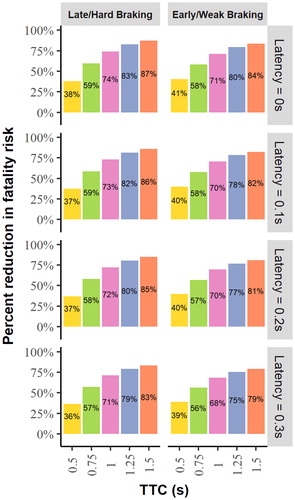
Figure 4. Percentage change in MAIS 3 + F risk for a range of TTC and latency values for both the late/hard braking driver scenario and the early/weak braking driver scenario.
Discussion
This study was limited by the in-depth pedestrian crash data available in the United States. Though PCDS is a valuable resource, the sample size was relatively small and not nationally representative. Additionally, PCDS was collected from 1994 to 1998 on late-model vehicles, which may not be representative of vehicles in the current U.S. fleet. However, we compared our fatality risk curves with more recent pedestrian risk curves generated with the German In-Depth Accident Study (GIDAS) (Rosén et al. Citation2010; Rosén and Sander Citation2009). The curves developed with PCDS tended to be shifted to the left, meaning higher risk at lower speeds, but this was only statistically significant for MAIS 3 + F injury at speeds below 73 km/h. Despite these limitations, PCDS is the most recent in-depth vehicle–pedestrian database and includes important injury information and crash reconstructions not available in GES and FARS.
This study was also limited by the lack of information concerning travel speed. The driver braking patterns used in this study were intended to act as upper and lower bounds on normal driving behavior. We expect that driver actions will fall somewhere between the early/weak braking driver and the late/hard braking driver.
The predicted fatality and MAIS 3 + F injury estimations used in this study did not include children due to differences in stature that could affect pedestrian–vehicle interaction during collisions. In the future we would like to extend our model to include children or develop a child-specific curve.
There are several important limitations to the AEB model: (1) We assumed an idealized system in which there was no sensor degradation, no mechanical failures, and no computational issues; (2) AEB algorithms are highly proprietary; we analyzed a hypothetical AEB algorithm based on characterization gathered from the literature and nonconfidential discussions with industry; and (3) we assumed braking performance based on literature. The result would be the maximum potential of the model system analyzed.
Though not all crashes could be avoided, AEB with pedestrian detection ability significantly mitigated risk to pedestrians in the target population. The target population accounts for about 68.8% of pedestrian fatalities (FARS 2011–2015) and 56.2% of pedestrians struck (GES 2011–2015), meaning that about 31–44% of the pedestrians struck or fatality injured by vehicles annually would not be affected by AEB with pedestrian detection ability. The crashes that would be affected but could not be avoided tended to have short pedestrian detection opportunities and/or adverse road conditions that would affect the system’s ability to effectively avoid or mitigate a collision. Greater benefits were estimated for the AEB system as the TTC of braking lengthened and the latency value shortened.
Data availability statement
The original data sources for this study, PCDS, GES, and FARS, are publicly available from NHTSA. The reconstructions performed for this study are not publicly available.
Supplemental Material
Download MS Word (125.8 KB)Additional information
Funding
Related Research Data
References
- Edwards M, Nathanson A, Wisch M. Estimate of potential benefit for Europe of fitting autonomous emergency braking (AEB) systems for pedestrian protection to passenger cars. Traffic Inj Prev. 2014;15(Suppl. 1):S173–S182.
- Fuerstenberg KC, Dietmayer K. Object tracking and classification for multiple active safety and comfort applications using a multilayer laser scanner. Paper presented at: IEEE Intelligent Vehicles Symposium; June 14–17, 2004.
- Gates TJ, Noyce DA, Bill AR, Van Ee N. Recommended walking speeds for pedestrian clearance timing based on pedestrian characteristics. Paper presented at: TRB Annual Meeting; 2006.
- Hamdane H, Serre T, Masson C, Anderson R. Issues and challenges for pedestrian active safety systems based on real world accidents. Accid Anal Prev. 2015;82:53–60.
- Highway Loss Data Institute. Effect of Subaru EyeSight on pedestrian-related bodily injury liability claim frequencies. HLDI Bull. 2017;34(39).
- Jermakian JS, Zuby DS. Primary Pedestrian Crash Scenarios: Factors Relevant to the Design of Pedestrian Detection Systems. Arlington, VA: Insurance Institute for Highway Safety; 2011.
- Kusano KD, Gabler H. Method for estimating time to collision at braking in real-world, lead vehicle stopped rear-end crashes for use in pre-crash system design. SAE International Journal of Passenger Cars - Mechanical Systems. 2011;4:435–443.
- Kusano KD, Gabler HC. Safety benefits of forward collision warning, brake assist, and autonomous braking systems in rear-end collisions. IEEE Trans Intell Transp Syst. 2012;13:1546–1555.
- Lefler DE, Gabler HC. The fatality and injury risk of light truck impacts with pedestrians in the United States. Accid Anal Prev. 2004;36:295–304.
- Lubbe N, Kullgren A. Assessment of integrated pedestrian protection systems with forward collision warning and automated emergency braking. Paper presented at: IRCOBI Conference Proceedings; 2015.
- NHTSA. Fatality Analysis Reporting System (FARS) Analytical User’s Manual, 1975–2017. Washington, DC: U.S. Department of Transportation; 2018a. DOT HS 812 602.
- NHTSA. National Automotive Sampling System–General Estimates Data System Analytical User’s Manual, 1988–2015. Washington, DC: U.S. Department of Transportation; 2018b. DOT HS 812 312.
- Ono R, Ike W, Fukaya Y. Pre-collision System for Toyota Safety Sense. SAE International; 2016.
- Rosén E. Autonomous emergency braking for vulnerable road users. Paper presented at: IRCOBI Conference; 2013; Gothenburg, Sweden.
- Rosén E, Kallhammer JE, Eriksson D, Nentwich M, Fredriksson R, Smith K. Pedestrian injury mitigation by autonomous braking. Accid Anal Prev. 2010;42:1949–1957.
- Rosén E, Sander U. Pedestrian fatality risk as a function of car impact speed. Accid Anal Prev. 2009;41:536–542.
- Scanlon JM, Sherony R, Gabler HC. Injury mitigation estimates for an intersection driver assistance system in straight crossing path crashes in the United States. Traffic Inj Prev. 2017;18(Suppl. 1):S9–S17.
- Shelton TS. National Accident Sampling System General Estimates System Technical Note, 1988 to 1990. Washington, DC: NHTSA; 1991. DOT HS 807 796.
- Stein WJ, Neuman TR. Mitigation Startegies for Design Exceptions. Washington, DC: Federal Highway Administration; 2007. FHWA-SA-07-011.
- Stutts JC, Hunter WW. Police reporting of pedestrians and bicyclists treated in hospital emergency rooms. Transp Res Rec. 1998;1635:88–92.
- Yanagisawa M, Swanson ED, Azeredo P, Najm W. Estimation of Potential Safety Benefits for Pedestrian Crash Avoidance/Mitigation Systems. Washington, DC: NHTSA; 2017. DOT HS 812 400.