
 ?Mathematical formulae have been encoded as MathML and are displayed in this HTML version using MathJax in order to improve their display. Uncheck the box to turn MathJax off. This feature requires Javascript. Click on a formula to zoom.
Abstract
Objective: Road departures are one of the most severe crash modes in the United States. To help reduce this risk, vehicles are being introduced in the United States with lane departure warning (LDW) systems, which warn the driver of a departure, and lane departure prevention (LDP) systems, which assist the driver in steering back to the roadway. Previous studies have estimated that LDW/LDP systems may prevent one third of drift-out-of-lane road departure crashes. This study investigates the crashes that were not prevented, to potentially set research priorities for next-generation road departure prevention systems.
Methods: The event data recorder (EDR) data from 128 road departure crashes in the National Automotive Sampling System Crashworthiness Data System (NASS-CDS) from 2011 to 2015 were mapped onto the vehicle trajectory and simulated with LDW/LDP to assess the potential for crash avoidance. The model predicted that 63–83% of single-vehicle road departure crashes may not be prevented by an LDW system and 49% may not be prevented by an LDP system.
Results and Conclusions: For LDP systems, which were assumed to have zero latency, no crashes were avoided if the time-to-collision (TTC) from lane crossing to impact was less than 0.55 s. Obstacles such as guardrails and traffic barriers, which tend to be very close to the road, were more common among the remaining crashes. The study shows that LDW/LDP systems are limited by two factors, driver reaction time and TTC to the roadside object. Thus, earlier driver response and longer TTC may help in these situations.
Introduction
From 2007 to 2011, drift-out-of-lane road departure crashes accounted for one third of all crash fatalities despite accounting for less than 10% of all crashes (Kusano and Gabler Citation2014). Drift-out-of-lane road departure crashes typically consist of inattentive drivers unintentionally leaving their lane of travel, departing from the road, and colliding with a fixed roadside object such as a tree or guardrail. Active safety systems, such as lane departure warning (LDW) and lane departure prevention (LDP), are promising features to help prevent these crashes. This category of road departures would not include loss-of-control departures or vehicles that depart the road to avoid a pedestrian or an animal.
LDW systems aim to help prevent drift-out-of-lane crashes by providing the driver with an audible or tactile warning when the vehicle unintentionally departs from the lane of travel. LDP systems help prevent drift-out-of-lane crashes by automatically steering the vehicle back toward the lane upon leaving the lane. From 2011 to 2015 almost 50% of all Maximum Abbreviated Injury Scale (MAIS) 3 + F injuries occurred in crashes in which the drivers may have benefited from LDW/LDP systems (Riexinger and Gabler Citation2018). Over 65% of these LDW/LDP-applicable scenarios were drift-out-of-lane road departure crashes, with the remaining portion consisting of head-on and sideswipe crashes.
LDW/LDP systems were estimated to be applicable to 6% of all single-vehicle crashes and 38.8% of all road departure crashes not due to loss of control, vehicle defect, or an avoidance maneuver (Jermakian Citation2011). Those estimates accounted for current limitations of LDW/LDP systems including operating speed limits, snow on the road, and a speeding vehicle. Cicchino (Citation2018) compared the crash rates in vehicles with and without LDW/LDP systems installed and found that vehicles with an LDW or LDP system had an 11% lower single-vehicle, head-on, and sideswipe crash rate despite the fact that half of all drivers have LDW/LDP systems deactivated (Reagan et al. Citation2018). Sternlund et al. (Citation2017) found that LDW systems had a 53% effectiveness with a lower confidence limit of 11% among all head-on and single-vehicle crashes on either dry or wet roads in Sweden with a speed limit between 70 and 128 kph. The effectiveness of LDW systems has been shown to be largely dependent on the reaction time of the driver (Riexinger et al. Citation2018). The reaction time of a driver to a haptic or audible LDW system can vary from as low as 0.38 to 1.36 s (Suzuki and Jansson Citation2003). LDP systems have the potential to prevent more crashes than LDW due to its immediate response. Additionally, LDW effectiveness is dependent on the evasive action taken by the driver. Our previous work found that roughly 80% of drivers in drift-out-of-lane road departure crashes responded with a steering maneuver (Riexinger and Gabler Citation2018). Kusano et al. (Citation2014) estimated that between 29 and 32% of drift-out-of-lane road departure crashes could be prevented with an LDW system. Similarly, Scanlon estimated that 26% of drift-out-of-lane road departure crashes could be prevented with an LDW system and 32% with an LDP system (Scanlon, Kusano, Sherony, and Gabler Citation2015).
The purpose of this study was to (a) understand the current drift-out-of-lane road departure crash frequency and (b) characterize the residual drift-out-of-lane road departure crash occurrence after fleet-wide deployment of LDW/LDP systems.
Methods
Defining the target population
The population of crashes that may be mitigated or avoided by LDW/LDP systems was derived from 3 national accident databases.
National Automotive Sampling System - General Estimate System (NASS-GES) is a nationally representative sample of police-reported crashes. The database is a sample of approximately 60,000 U.S. police reported crashes collected each year. NASS-GES contains all crash severities from property damage to fatal but is limited to data collected by police (NHTSA Citation1988–2015).
The National Automotive Sampling System - Crashworthiness Data System (NASS-CDS) is a nationally representative sample of police-reported crashes in which at least one passenger vehicle—that is, car, light truck, or van—was towed from the scene. NASS-CDS is based on in-depth crash investigations of approximately 4,000–5,000 cases per year, which includes detailed vehicle inspections, a scaled scene diagram, and occupant injury records (NHTSA Citation1979–2015).
The Fatality Analysis Reporting System (FARS) is a census of every fatal traffic crash in the United States each year. The database includes the information collected by police (NHTSA Citation1975–2017).
NASS-GES 2011–2015 was used to determine the overall crash population and NASS-CDS 2006–2015 was used to understand MAIS 3 + F injurious crashes. NASS-CDS included an additional five years of data to account for the decrease in the number of cases in the latter case years. FARS 2011–2015 was used to characterize fatal crashes. Every crash in each of these databases was assigned a crash scenario based on the crash type, precrash maneuvers, and critical precrash event (Kusano and Gabler Citation2014). Only single-vehicle crashes involving cars, light trucks, or passenger vans were included. Only cases that were drift-out-of-lane road departure crashes were selected for analysis.
Predicting the residual crash population
The residual crash population was estimated using three databases in conjunction: NASS-CDS, the National Cooperative Highway Research Program Project 17-43 (NCHRP 17-43 Citation2010–2018) database, and the NHTSA’s NASS Event Data Recorder (EDR; NHTSA Citation2000–2015) database. The NCHRP 17-43 database has been developed at Virginia Tech as a supplement to NASS-CDS for road departure crashes. The database contains coded trajectory information measured from the scaled scene diagrams in NASS-CDS and roadside information coded from scene photographs. The NHTSA’s NASS EDR database contains time history measurements of vehicle velocity, braking, and steering inputs during real-world crashes in NASS-CDS.
NASS-CDS drift-out-of-lane road departure crashes from 2011 to 2015 were selected for estimating the effectiveness of LDW/LDP systems. This is the latest five years available in NASS-CDS. Additionally, the NCHRP 17-43 database was used to provide the coded trajectory of the vehicle before the crash. The EDR precrash velocity data were used to determine the vehicle’s speed along the trajectory. In order to be included in this study, the NASS-CDS case must be categorized as a drift-out-of-lane road departure crash using the methodology established by Kusano and Gabler (Citation2014). This method categorizes each crash based on the crash type, precrash maneuver, and the precipitating event. The NCHRP 17-43 database contains a total of 1,580 drift-out-of-lane road departure crashes. To be included in the study, the first event had to be the most severe (Scanlon, Kusano, and Gabler Citation2015). Additionally, the EDR needed to record either an airbag deployment or a delta-V greater than 8 kph (5 mph). The airbag deployment locks the EDR data, preventing subsequent events from overwriting EDR data. The delta-V requirement is a crash with significant damage. Another impact that did not deploy the airbag would be unlikely to overwrite these events. Finally, the EDR must have recorded values for the precrash velocity in order to be used in this study. Overall, there were 128 drift-out-of-lane road departure cases with associated EDR data. After applying NASS-CDS sampling weights, this represents 53,871 real-world crashes used in this study ().
Table 1. Case selection criteria.
Trajectory and velocity alignment
In order to define the velocity along the vehicle’s trajectory, the last EDR precrash velocity was assumed to be the impact velocity. The distance traveled between EDR time points was computed by assuming that velocity varied linearly between EDR time points (Riexinger et al. Citation2018). Beginning at the point of impact, the precrash velocity was mapped to the vehicle trajectory.
LDW/LDP model
The LDW road departure model was split into 3 different phases: approach, response delay, and evasive action. During the approach phase of the model, the vehicle followed the initial trajectory of the vehicle. When the lead tire of the vehicle crossed the lane line, the LDW/LDP system activated. The model assumed a warning would be delivered regardless of weather, lighting, or presence of a lane marker. After the system activated, the response delay phase began. Driver response was represented by two response times, 0.38 and 1.36 s, which represent fast and slow reactions to haptic and audible warnings (Suzuki and Jansson Citation2003). In addition, a response time of 0.0 s was used for the LDP system that automatically steers back toward the lane. After the response delay phase was complete, an evasive maneuver was performed by steering back toward the road. The steering maneuver was a 0.5-s ramp-up to the minimum turning radius at a constant velocity. The minimum turning radius was limited by the friction available to maintain the centripetal acceleration and was computed based on EquationEq. (1)(1)
(1) . The coefficient of frictions varied based on the road side surface type and whether it was dry, wet, or icy (Table A-1, see online supplement; Noon Citation1994).
(1)
(1)
LDW/LDP effectiveness
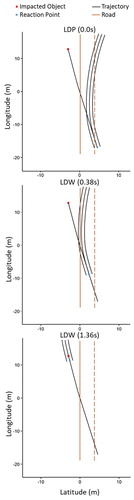
For cases in which the vehicle departed the road more than once before impacting a roadside object, the LDW/LDP system was assumed to have no effect because the driver was already aware of the departure. Similarly, the systems were assumed to have no effect if the vehicle crossed a rumble strip before departing. This model assumes that the LDW/LDP system was active in every vehicle and initiated an evasive action. A crash was predicted to be prevented if the first impacted object was avoided by the predicted LDW/LDP equipped vehicle. For example, in NASS-CDS case 506016837, the predicted trajectory of the vehicle avoided the impacted object for reaction times of 0.0 and 0.38 s (). However, for a reaction time of 1.36 s, the predicted vehicle trajectory did not avoid the impacted object.
Figure 1. Example vehicle trajectory for the three different reaction times.
Results
LDW/LDP crash population
Analysis of the NASS-GES from 2011 to 2015 shows that only 6.9% of occupants in crashes in a passenger vehicle or light truck/van experienced a drift-out-of-lane road departure crash. However, 37.1% of fatalities in passenger vehicles and light trucks/vans in FARS from 2011 to 2015 resulted from a drift-out-of-lane road departure crash (). Similar to fatalities, road departure crashes accounted for 30.3% of all serious to fatal injuries.
Table 2. Number of drift-out-of-lane road departure crashes among all, seriously injured, and fatally injured occupants.
LDW/LDP effectiveness
The effectiveness of LDW systems was predicted to be between 17.3 and 37.3% depending on the driver’s reaction time, assuming that every driver reacts to the warning (). LDP systems were significantly more effective, with a predicted benefit of 51.1%.
Table 3. Predicted crash effectiveness for LDW/LDP systems.
Discussion
The predicted effectiveness of 17.3–37.4% for LDW systems based on real-world crashes was similar to the 29–32% estimated by Kusano et al. (Citation2014) and the 26% estimated by Scanlon, Kusano, Sherony, and Gabler (Citation2015). Additionally, the LDW system effectiveness is similar to Cicchino’s (Citation2018) 11% effectiveness estimate when considering that half of the vehicles may not have had LDW activated. The predicted LDW effectiveness encompassed the estimated 30% effectiveness for all head-on and single-vehicle injury crashes on Swedish roads (Sternlund et al. Citation2017).
To understand the residual drift-out-of-lane road departure crash occurrence after full deployment of LDW/LDP systems, it was necessary to determine why some crashes were not avoided with the system. There were 33 cases in the data set for which LDW/LDP systems were assumed to have no effect. In 23 of these cases the vehicle had multiple departures and in 10 cases the vehicle crossed a rumble strip. With a faster reaction time, an evasive action was able to be performed before impact more frequently. In almost 40% of the simulated crashes with a reaction time of 1.36 s, the driver did not react before impact. Even with an immediate response, our model predicted that 29 crashes would not be avoided.
The vehicle speed when it departed the lane and the distance to the impacted object were combined to visualize which crashes could have been avoided with an LDW/LDP system (). Vehicles that were moving slowly toward an object far from the road edge were the most likely to avoid a crash. Vehicles moving quickly toward close objects were more likely to crash because of insufficient time to react and perform an evasive maneuver. The departure angle did not correlate with departure speed or crash outcome (Figure A-1, see online supplement).
Figure 2. Predicted crash outcome for LDW/LDP-applicable drift-out-of-lane road departure crashes based on departure speed and the distance to the roadside object.
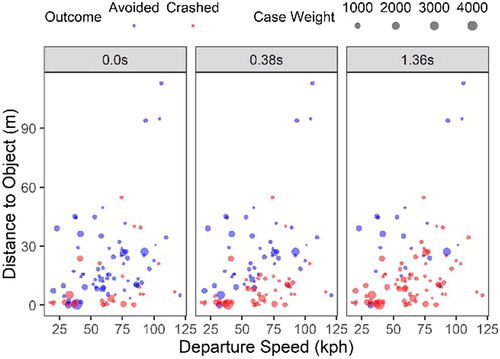
All crashes that were estimated to be successfully avoided had a time-to-collision (TTC) greater than 0.55 s. This was observed even for vehicles equipped with LDP systems, which began to steer back toward the road after departure. With LDP, some time was required for the steering maneuver to ramp up and for the vehicle to then physically veer off of a collision path. Thus, earlier driver response and longer TTC may increase LDW/LDP effectiveness.
When comparing the distribution of impacted objects across the different reaction times, objects that tend to be close to the road edge are a large fraction of the residual crash population (Table A-2, see online supplement). For example, guardrails and traffic barriers initially made up 16% of the impacted objects but after full deployment of LDP systems they accounted for 29% of the impacted objects. Poles and trees, which tend to be more randomly distributed away from the road edge, had very little change in representation after LDW/LDP deployment. Guardrails and traffic barriers must be close to the road edge in order to adequately protect the vehicle from encountering a more dangerous road hazard. A potential solution would be to move fixed objects such as utility poles further from the road edge (Neuman et al. Citation2003).
Limitations
The LDW/LDP model has a few limitations that overestimate the system effectiveness. First, the impacted object was assumed to be a point mass. Therefore, it was possible that a vehicle may be predicted to miss an object when it would have impacted the object in a new location. This was especially relevant for guardrails and other barriers that comprise a minority of impacted objects. The second assumption was that if a vehicle successfully avoided an impacted object, it would safely return to the road without impacting any other roadside objects. This assumption was necessary because the location of other roadside hazards was unknown. In addition, the model assumed that every driver had the LDW/LDP system active and responded to a warning. Despite these assumptions, the LDW/LDP model provides an early indication of the types of unavoided crashes that may remain after LDW/LDP deployment. Finally, the study was based on a small sample size. Future iterations of this model could include cases from the Crash Investigation Sampling System, the replacement to NASS-CDS, to increase the sample size and improve the estimation.
Predicted number of residual crashes
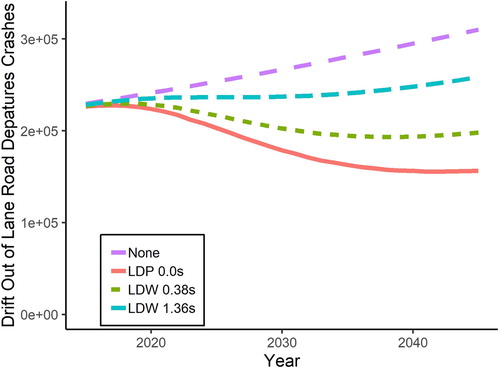
In order to understand the impact of LDW/LDP systems over time, the penetration of these systems into the marketplace as predicted by the Highway Loss Data Institute (HLDI) (Citation2018) was analyzed (Figure A-2, see online supplement). The HLDI prediction for LDW is based on the current penetration of the system from insurance records (HLDI Citation2018). The following analysis assumes that the LDP system market penetration is the same as that of LDW systems. The portion of drift-out-of-lane road departure crashes prevented by LDW/LDP was determined by multiplying the fraction of the fleet with the system installed by the estimated benefit of the system. Therefore, when these systems were predicted to be in nearly every vehicle in 2050, the portion of drift-out-of-lane road departure crashes prevented was the estimated system benefit. HLDI predicted that LDW systems will be equipped in 50% of passenger vehicles in the U.S. fleet in 2026 (HLDI Citation2018). At a 50% fleet penetration in 2026, drift-out-of-lane road departure crashes are expected to be reduced by 8.7–19.0% assuming the same exposure and road characteristics as the data source (Figure A-3, see online supplement). This is similar to the 6.0–12.9% single-vehicle road departure crash reduction in 2025 depending on the LDW/LDP system effectiveness as predicted by Penmetsa et al. (Citation2018). The Federal Highway Administration (FHWA Citation2015) estimates that the vehicle miles traveled (VMT) increases by about 1% each year, which means the number of drift-out-of-lane road departure crashes can be expected to increase as well. In 2015, there were 3.1 trillion vehicle miles traveled (FHWA Citation2015). In NASS-CDS 2015, there were 229,433 single-vehicle road departure crashes. Assuming a constant crash rate, there will be an estimated 253,700 single-vehicle road departure crashes in 2025. However, due to the introduction of LDW/LDP systems, between 19,900 and 43,000 single-vehicle departure crashes were predicted to be prevented in 2025 ().
Figure 3. LDW/LDP benefits over time based on market penetration and increasing VMT.
Data availability statement
The data on which this study was based are all publicly available as detailed in the article.
Supplemental Material
Download MS Word (302.7 KB)Additional information
Funding
Related Research Data
References
- Cicchino JB. Effects of lane departure warning on police-reported crash rates. J Safety Res. 2018;66:61–70.
- Federal Highway Administration. Highway Statistics 2015: Public Road Mileage, Lane-Miles, and VMT. Washington, DC: FHWA; 2015. Chart VMT-422C.
- Highway Loss Data Institute [HLDI]. Predicted availability and fitment of safety features on registered vehicles—a 2018 update. HLDI Bull. 2018;35(27):9.
- Jermakian JS. Crash avoidance potential of four passenger vehicle technologies. Accid Anal Prev. 2011;43:732–740.
- Kusano KD, Gabler HC. Comprehensive target populations for current active safety systems using national crash databases. Traffic Inj Prev. 2014;15:753–761.
- Kusano KD, Gabler H, Gorman TI. Fleetwide safety benefits of production forward collision and lane departure warning systems. SAE International Journal of Passenger Cars-Mechanical Systems. 2014;7:514–527.
- National Cooperative Safety Research Program Project 17-43. Long Term Roadside Crash Data Collection Program. 2010–2018. Under Development. Available at: https://apps.trb.org/cmsfeed/TRBNetProjectDisplay.asp?ProjectID=1637
- Neuman T, Pfefer R, Slack K, et al. NCHRP Report 500. Guidance for Implementation of the Aashto Strategic Highway Safety Plan, Vol. 6: A Guide for Addressing Run-off-Road Collisions. Washington, DC: Transportation Research Board of the National Academies; 2003.
- NHTSA. Fatality Analysis Reporting System. 1975–2017. Available at: ftp://ftp.nhtsa.dot.gov/FARS/.
- NHTSA. National Automotive Sampling System–Crashworthiness Data System. 1979–2015. Available at: ftp://ftp.nhtsa.dot.gov/NASS/.
- NHTSA. National Automotive Sampling System–Crashworthiness Data System Event Data Recorder Reports. 2000–2015. Available at ftp://ftp.nhtsa.dot.gov/NASS/EDR_Reports/
- NHTSA. National Automotive Sampling System–General Estimates System. 1988–2015. Available at: ftp://ftp.nhtsa.dot.gov/GES/.
- Noon RK. Engineering Analysis of Vehicular Accidents. Boca Raton, FL: CRC Press; 1994.
- Penmetsa P, Hudnall M, Nambisan S. Potential safety benefits of lane departure prevention technology. IATSS Res. 2018;43(1):21–26.
- Reagan IJ, Cicchino JB, Kerfoot LB, Weast RA. Crash avoidance and driver assistance technologies—are they used? Transp Res Part F Traffic Psychol Behav. 2018;52:176–190.
- Riexinger LE, Gabler HC. A preliminary characterisation of driver manoeuvres in road departure crashes. Paper presented at: IRCOBI Conference; September 2018; Athens, Greece.
- Riexinger LE, Sherony R, Gabler HC. Methodology for estimating the benefits of lane departure warnings using event data recorders. Paper presented at: SAE World Congress Experience; April 2018; Detroit, MI.
- Scanlon JM, Kusano KD, Gabler HC. Analysis of driver evasive maneuvering prior to intersection crashes using event data recorders. Traffic Inj Prev. 2015;16(Suppl. 2):S182–S189.
- Scanlon JM, Kusano KD, Sherony R, Gabler HC. Potential safety benefits of lane departure warning and prevention systems in the U.S. vehicle fleet. Paper presented at: International Conference on Enhanced Safety of Vehicles (ESV); June 2015.
- Sternlund S, Strandroth J, Rizzi M, Lie A, Tingvall C. The effectiveness of lane departure warning systems—a reduction in real-world passenger car injury crashes. Traffic Inj Prev. 2017;18:225–229.
- Suzuki K, Jansson H. An analysis of driver’s steering behaviour during auditory or haptic warnings for the designing of lane departure warning system. JSAE Review. 2003;24:65–70.