
 ?Mathematical formulae have been encoded as MathML and are displayed in this HTML version using MathJax in order to improve their display. Uncheck the box to turn MathJax off. This feature requires Javascript. Click on a formula to zoom.
Abstract
Objective: The Vision Zero initiative pursues the goal of eliminating all traffic fatalities and severe injuries. Today’s advanced driver assistance systems (ADAS) are an important part of the strategy toward Vision Zero. In Germany in 2018 more than 26,000 people were killed or severely injured by traffic accidents on motorways and rural roads due to road accidents. Focusing on collision avoidance, a simulative evaluation can be the key to estimating the performance of state-of-the-art ADAS and identifying resulting potentials for system improvements and future systems.
This project deals with the effectiveness assessment of a combination of ADAS for longitudinal and lateral intervention based on German accident data. Considered systems are adaptive cruise control (ACC), autonomous emergency braking (AEB), and lane keeping support (LKS).
Methods: As an approach for benefit estimation of ADAS, the method of prospective effectiveness assessment is applied. Using the software rateEFFECT, a closed-loop simulation is performed on accident scenario data from the German In-Depth Accident Study (GIDAS) precrash matrix (PCM). To enable projection of results, the simulative assessment is amended with detailed single case studies of all treated cases without PCM data.
Results: Three categories among today’s accidents on German rural roads and motorways are reported in this study: Green, grey, and white spots.
Green spots identify accidents that can be avoided by state-of-the-art ADAS ACC, AEB, and LKS. Grey spots contain scenarios that require minor system modifications, such as reducing the activation speed or increasing the steering torque. Scenarios in the white category cannot be addressed by state-of-the-art ADAS. Thus, which situations demand future systems are shown. The proportions of green, grey, and white spots are determined related to the considered data set and projected to the entire GIDAS.
Conclusions: This article describes a systematic approach for assessing the effectiveness of ADAS using GIDAS PCM data to be able to project results to Germany. The closed-loop simulation run in rateEFFECT covers ACC, AEB, and LKS as well as relevant sensors for environment recognition and actuators for longitudinal and lateral vehicle control.
Identification of green spots evaluates safety benefits of state-of-the-art level 0–2 functions as a baseline for further system improvements to address grey spots. Knowing which accidents could be avoided by standard ADAS helps focus the evolution of future driving functions on white spots and thus aim for Vision Zero.
Introduction
During the last 5 years the number of annual traffic fatalities in Germany has remained nearly static at a level of less than 3,500 (Statistisches Bundesamt (DESTATIS) Citation2018). At the same time, different advanced driver assistance systems (ADAS) have been introduced (Page et al. Citation2015).
Vision Zero puts the aim to reduce the number of fatalities and severely injured persons caused by traffic accidents to zero (Deutscher Verkehrssicherheitsrat Citation2017; Ministry of Transport and Communications Citation1997). The resolving question is: How do current ADAS affect accident occurrence and which roles do ADAS and active safety systems take for further reduction of severe traffic accidents?
To provide an answer, prospective effectiveness assessment helps to evaluate the benefit of ADAS for crash avoidance and to identify scenarios among present accident data requiring further systems.
The goal of this study is to assess the effectiveness of collision avoidance of ADAS based on German accident data. Systems included are adaptive cruise control (ACC), autonomous emergency braking (AEB), and lane keeping support (LKS), represented by simplified simulation models based on literature. As long as appropriate simulation data and system models exist, the evaluation method can be applied to other systems and countries.
Structure
The main part of this article is structured in 3 parts: The Methods section provides an overview of different methodologies for effectiveness evaluation and focuses the simulative approach applied in this study. Beginning with input data, it describes the use of the German In-Depth Accident Study (GIDAS) as simulation input and for projection of results. Furthermore, the simulation framework and its components for system modeling as well as the assessment criteria are introduced. The Results section reports the outcomes of the simulation and the consequent assessment of the system effectiveness for collision avoidance. The Discussion critically considers the whole methodology as well as the results. In this section, assumptions and limitations of input data and the simulation environment are discussed with a focus on their influence on results. The capacity and relevance of the results are debated considering these assumptions and limitations.
Methods
There are 2 different major methods for assessing the effectiveness of ADAS: Retrospective and prospective effectiveness assessment (Busch Citation2005).
The retrospective approach uses accident data to identify changes in accident occurrence influenced by the recent introduction of vehicle systems. Applying this method, the effectiveness of an already existing and widespread system can be identified retrospectively (Blower Citation2014).
Prospective effectiveness assessment can be used as an alternative to retrospective analysis. Based on actual accident occurrence and system specification of the considered ADAS, a prognosis is made regarding which collisions could be addressed or avoided. A simulative approach uses reconstruction data to run a simulation of the precrash phase. According to Erbsmehl (Citation2009), the outcome is a comparison between reconstructed and predicted accident scenario using a virtual prototype of the system. One advantage of the prospective method is that future systems can be assessed in a very early stage of development (Alvarez et al. Citation2017). Furthermore, simulation is useful for comparing different system parameterizations.
This study aims to analyze the prospective influence of ADAS. Furthermore, synthetic system enhancements are assessed. Therefore, a prospective approach combined with simulation was chosen.
The following sections describe the input data, simulation setup, and software toolchain, followed by information on the assessment process and applied assessment criteria.
Input data
GIDAS was used as the data source. Since 1999, GIDAS has provided information on about 2,000 cases per year that are representative of German accident occurrence (Otte Citation2015). The GIDAS precrash matrix (PCM) contains information on environment and vehicle dynamics for the precrash phase of 5 s before the first impact for selected GIDAS cases (Verkehrsunfallforschung an der TU Dresden GmbH Pre-Crash-Matrix (VUFO PCM) Citation2018). PCM data including trajectories for up to 2 agents are appropriate for running a simulation of the reconstructed scenario; for example, as part of benefit estimation of advanced safety technologies (Erbsmehl Citation2009).
This analysis focuses on accident scenarios on rural roads or motorways with at least one severely or fatally injured person (Injury Severity Scorex = 2.5+). The following list shows detailed criteria to select the accident scenarios that could in general be simulated and potentially could have a PCM:
GIDAS total: 31,712 cases (starting from year 2000, status complete with reconstruction)
GIDAS subset: 2,137 cases (car involvement, seriously or fatally injured person)
Basic data set: 946 cases (rural roads and motorways)
No skidding (remaining 568 cases)
Car involved in first collision (remaining 547 cases)
No trailers (remaining 497 cases)
No reversing (remaining 495 cases)
No technical defects (remaining 491 cases)
Assessment data set: 491 cases
All cases violating these criteria were not consulted for ADAS assessment because situations with, for example, skidding, reversing, or technical defects cannot be addressed by the considered systems. For projection of the results these cases are evaluated as having zero effectiveness. We do not consider further restrictions for system individual target population. This method allows a system-independent approach for evaluation of all GIDAS accidents on rural roads or motorways with car involvement and at least one seriously or fatally injured person. The representativeness of GIDAS to federal accident statistics is ensured by a well-defined sampling plan (Erbsmehl Citation2009).
Versions of the databases used are GIDAS 2017-12-31 and PCM 2017-2 (VUFO GIDAS Citation2018; VUFO PCM Citation2018).
shows the distribution of input data among accident types split by location. The accident types listed in , which describe the initial situation or conflict causing the accident, are coded similar to GIDAS coding (Verkehrsunfallorschung an der TU Dresden GmbH German In-Depth Accident Study (VUFO GIDAS) Citation2018).
Table 1. GIDAS input data split among accident types.
Simulation setup
Simulation framework rateEFFECT
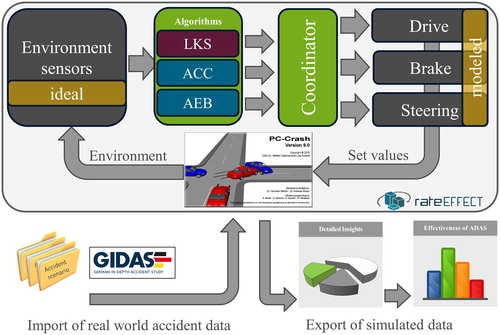
For simulative effectiveness assessment, Volkswagen Crash Research has developed the proprietary software framework rateEFFECT, which is used for input data handling, simulation control, and system modeling as well as data logging. PC-Crash serves as the simulation core (Wille et al. Citation2012).
The graphical user interface of rateEFFECT allows importing PC-Crash scenario files. Using the system editor, one can load and parameterize various system components and set connections between their inputs and outputs. System components typically represent sensors, algorithms, or actuators. Component logic is implemented using the programming language C++. Interaction between system components and simulation is realized by PC-Crash interfaces for simulation control, agent dynamics, and environment sketch.
Closed-loop simulation
rateEFFECT provides the possibility of influencing the scenario and the agents’ behaviors by a closed-loop approach. illustrates the data flow in rateEFFECT. Simulation scenarios loaded into rateEFFECT are run in PC-Crash. The system under assessment is structured by 3 categories: Sensors, algorithms, and actuators. Sensors read information on the environment from the simulation; for example, lane markings or data of surrounding objects and vehicles. Algorithms process sensor information to calculate desired values for vehicle control, which are sent to actuators that directly influence the simulation vehicle. The driver action given by accident reconstruction is overruled as soon as the first system intervention occurs, separately for longitudinal and lateral vehicle control. Exceptions are driver braking maneuvers starting before and with higher amplitude than the system intervention.
Figure 1. rateEFFECT simulation framework.
PC-Crash configuration
PC-Crash simulation uses driver, vehicle, and tire models. Choice and parameterization of these models affect vehicle behavior and thus may have an impact on assessment results. The harmonization initiative for Prospective Effectiveness Assessment for Road Safety (P.E.A.R.S.) focuses in one of its working groups the deviation of results due to different simulation configurations and assessment tools (Page et al. Citation2015). One aim of the Prospective Effectiveness Assessment for Road Safety is to identify models and parameters that need to be harmonized.
The main parameters of the PC-Crash configuration used for this study are as follows:
Vehicle data given by PCM:
Dimensions: Length, width, height, track width, wheelbase, front overhang
Weights: Total weight, center of gravity
Chassis parameters calculated by PC-Crash:
Brake balance
Parameters for suspension and damping, chassis hardness chosen as medium
Tyre model:
Linear tire model
Tire width = 205 mm, maximum slip angle = 10°
Driver model:
Proportional–integral–derivative (PID)-tangential model
P = 40, I = D = 0, look-ahead duration = 0.1 s
The driver model is idealized in order to follow the reconstructed path with minimum lateral offset.
System definition
This analysis focuses on a system setup consisting of generic ACC, AEB, and LKS that are virtually installed in the vehicle under test; that is the ego vehicle. The following sections describe system components and assumptions for system modeling.
Sensors
The considered system uses 2 different sensors: Radar for object and vehicle recognition and a camera for lane detection. In rateEFFECT, sensors are modeled and idealized based on their technical specification and typical behavior. This analysis focuses on the algorithms and their logics for interventions, not on detection issues. Therefore, one generic sensor setup is used, which is specified in the following.
The radar sensor cone is simplified as segment of a circle with an opening angle of 45° and range of 150 m. Objects can be detected when they are completely covered by the sensor cone with an acquisition time of 0.2 s. The resolution is defined by an angle step size of 0.5° between the sensor beams. The radar sensor is placed in the middle of the vehicle front and orientated in the x-direction of vehicle coordinates. All absolute output signals refer to global coordinates. Relative signals are referenced to local coordinates with the origin at the sensor position.
The main output signals of radar include the following:
Object type
Object’s absolute and relative velocity
Object’s absolute and relative acceleration
Object’s absolute distance, longitudinal and lateral.
The camera for lane marking recognition is mounted centered behind the windscreen with an offset of 1.8 m to the front bumper. Detection is realized by searching for intersections between horizontal sensor lines (representing pixel rows) and road markings in the simulation environment. The type of marking can be identified by the color used in the scenery sketch. The field of view of the camera is limited to a minimum range of 5.5 m, maximum range of 120 m, and opening angle of 44°. All distances and angles are calculated referred to the middle of the rear axle of the ego vehicle.
The main output signals of camera are as follows:
Distance to lane marking left/right
Angle between vehicle longitudinal axis and line segment next to rear axle left/right.
Algorithms
The system setup includes 3 algorithms as core components. Input signals, their processing, and output signals of the 3 generic system algorithms are described in the following.
ACC
ACC uses information on the front vehicle from the radar sensor to calculate the time gap between the front and ego vehicle. The aim of ACC is to keep the time gap constant by continuous control of longitudinal acceleration, even if the front vehicle is accelerating or decelerating. The time gap tgap is calculated in EquationEq. (1)(1)
(1) from the sensor signal’s longitudinal front vehicle distance dx and ego vehicle velocity vx,ego.
(1)
(1)
The desired time gap is set to 2.8 s. As the main output, ACC provides the desired ego vehicle acceleration. The acceleration amplitude is proportional to the deviation between the actual and desired time gaps. The maximum amount of acceleration is limited to 4 m/s2 and the maximum gradient is set as 1.75 m/s3. ACC reaction is limited to preceding and halting vehicles and bicycles allocated within the ego vehicle’s driving tube.
AEB
AEB is an event-triggered system enabling the car for emergency braking maneuvers without driver interaction. Potential collision objects in front of the vehicle are detected by radar and described by lateral and longitudinal object distance, relative velocity, and object type. Time-to-collision (TTC) is applied as a criterion for intervention. Referring to Winner et al. (Citation2015), the TTC calculation in EquationEq. (2)(2)
(2) uses the sensor signal’s object distance dx and relative velocity vrel,x, both in the longitudinal direction.
(2)
(2)
If the preceding vehicle is braking with higher deceleration than the ego vehicle, relative acceleration arel,x is additionally considered by EquationEq. (3)(3)
(3) for TTC calculation (Winner et al. Citation2015) in order to immediately recognize the collision risk.
(3)
(3)
For TTC smaller than 1.6 s, the desired deceleration is set to 1.5 m/s2 and continuously increased up to a maximum deceleration of 8 m/s2 with the following gradients:
0.85 m/s3 for 1.6 s > TTC ≥ 1.3 s
15 m/s3 for 1.3 s > TTC ≥ 0.8 s
40 m/s3 for TTC < 0.8 s.
This AEB model reacts on preceding and static objects only if there is an overlap in lateral direction, specified by the ego vehicle and object width. As crossing objects, only pedestrians and bicyclists are considered. There is no reaction to oncoming traffic.
LKS
LKS is an active system for lateral vehicle control supporting the driver in following the lane and preventing lane or road departure. It uses camera information such as lateral distances to left and right lane markings, angle between vehicle heading and lane marking, and lane marking curvature. Processing these sensor signals, the system algorithm calculates the distance to line crossing (DLC) and time to line crossing (TTLC). DLC describes the lateral distance between the vehicle side and relevant lane marking based on ego vehicle width bego and distance to lane marking dline given by the sensor (referred to the middle of the rear axle, always positive).
(4)
(4)
TTLC includes a prediction of vehicle motion as it describes the remaining time until the vehicle will cross the line when there is no driver or system intervention. Therefore, the TTLC calculation in EquationEq. (5)(5)
(5) also considers ego vehicle velocity vx,ego and yaw angle difference Δψ between vehicle orientation and lane marking (derived from Mammar et al. [Citation2004] by neglecting road curvature).
(5)
(5)
As output, LKS provides a steering torque, which is limited to a maximum of 3 Nm. Minimum speed for system activity is set to 65 km/h. LKS can only react to visible lane markings.
Steering intervention is triggered by the following criteria:
|Δψ| > 0.03 rad
TTLC < 1.5 s
DLC < 0.05 m.
The amplitude of the intervention is proportional to control deviation of |Δψ|, TTLC, or DLC.
Actuators
Actuators are used to model drive, brake, and steering systems of the vehicle. Desired values for steering torque and lateral acceleration are sent to a coordinator. The coordinator component allows prioritization if several interventions occur at the same time. For this analysis, the only prioritization is that any longitudinal or lateral intervention is overruled by AEB braking. The coordinator sends desired acceleration and steering values to the actuator components, which transfer the intervention to the simulation vehicle.
For lateral control, desired steering torque is converted into a steering angle and sent to the simulation environment as a set value for ego vehicle steering.
In the longitudinal direction, 2 actuators are needed: One actuator modeling engine and drive for positive accelaration and slight deceleration. Another actuator is used to model the brake system.
The drive model is appropriate for all positive accelerations and for decelerations that can be realized without using the brake. Influences for slight deceleration include air and rolling resistance as well as drag torque of the engine. The acceleration gradient for the drive is limited to 10 m/s2. The brake is modeled considering a deceleration gradient of 26 m/s2 and a lag time of 0.16 s. Depending on the sign and amount of desired acceleration, the drive or brake actuator is used to influence the simulation vehicle in the longitudinal direction.
Assessment
Running the defined system under assessment, consisting of sensors, algorithms, and actuators, a closed-loop simulation is performed. The influence of ACC, AEB, and LKS in the reconstructed accident scenarios can be identified by comparing simulation results without system activation with those under system operation. The main assessment criterion is collision avoidance; collision mitigation is not considered.
For effectiveness evaluation, the authors define 3 result categories in order to describe the system’s influence: Green, grey, and white spots.
Green spots
The situation can be solved by ACC, AEB, and LKS in basis configuration. This category describes the performance for collision avoidance of the 3 generic systems.
Grey spots
The situation cannot be solved by ACC, AEB, and LKS in basis configuration. There is a violation of actual system boundaries. This category identifies scenarios that could be addressed by ACC, AEB, and LKS if extensions of system boundaries are expected.
White spots
The situation cannot be addressed by ACC, AEB, and LKS in either basis or extended configuration. The white category shows potentials for new ADAS and driving functions.
A situation is rated as solved when the following criteria are fulfilled:
Avoidance of initial collision
No other collision within 5 s before and 5 s after the initial collision
For lane or road departure accidents: No crossing of lane markings or road departure within 5 s before the initial collision (time of PCM reconstruction).
Assessment process
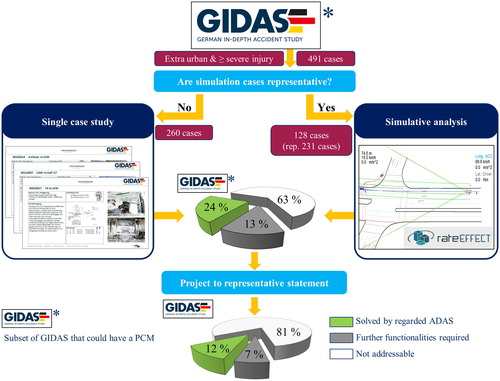
Because PCM data do not exist for all scenarios, the assessment process is divided into 2 parallel approaches: shows the workflow with a single case study on the left and simulative approach on the right. The number of cases is split into clusters according to accident type and type of road user. If within a cluster at least 10% of all cases (minimum 2 cases) provide a PCM, assessment is done by simulation. Otherwise, a single case study on all cases in the cluster is applied. The results of both approaches are combined by weighting each cluster corresponding to its size.
Figure 2. Assessment process and results.
The agent defined as the ego vehicle must always be a passenger car. If 2 passenger cars are involved, the vehicle that could have solved the situation using forward-looking ADAS is chosen. If this is the case for neither or both of the agents, the accident perpetrator is defined as the ego vehicle. For cases with an intentional line crossing, LKS is deactivated to avoid preventing conscious lane change or evasion maneuvers. If the ego vehicle is preceding, ACC is deactivated because PCM does not provide information on further traffic surrounding the ego vehicle. An intervention would falsify the reconstructed scenario.
Simulative approach
For accident scenarios with PCM simulation data, rateEFFECT is used to analyze the influence of ADAS based on simulation log values. These values provide, for example, information on intervention time, intervention amplitudes, distances to other vehicles or lane markings, time points of line crossings, and collision time. Based on log values, whether a collision was avoided and which systems were intervening can be identified.
To obtain to a complete understanding of simulated situations and system interventions, we supported this process by analyzing the simulation videos including system status information.
Single case study
For GIDAS cases without PCM data, a manual case study was performed. Combining knowledge on system behavior and system boundaries with detailed information on the accident scenario from GIDAS records, it is possible to determine whether a system could have influenced or even solved a situation or not. Considering LKS as an example, the sketch and photographs provide information on the existence and visibility of lane markings. Dynamic parameters like initial speed of the ego vehicle or environment information like road geometry are known from GIDAS reconstruction and environment data. Based on this information, a single case study can determine whether LKS would have been able to address or solve the scenario using objective criteria. Similarly, the process can be adapted to ACC and AEB.
Results
For assessment 491 severe and fatal accidents of GIDAS on rural roads and motorways were considered. shows the allocation of these scenarios into green, grey, and white categories. By combining generic ACC, AEB, and LKS, 24% of the scenarios could be solved (green spot); 13% of analyzed situations require extension of the 3 systems but not completely new functions (grey spot); and 63% of scenarios cannot be addressed by ACC, AEB, or (white spot). To address these situations, new functions need to be introduced.
At the bottom of , results projected to the basic data set are shown. Projection is done by additionally considering prior excluded cases that were not assessed (e.g., with skidding, no car involvement, etc.). Twelve percent of all severe or fatal accidents in extra-urban scenarios documented in GIDAS could be solved by ACC, AEB, and LKS; 7% required system extension and 81% were identified as white spots and could not be addressed according to the ADAS considered. shows the distribution of the results among accident types, which shows the main performance of ACC, AEB, and LKS in driving accidents, accidents with following vehicles, and “other”; for example, road departure accidents due to medical issues.
Table 2. Results split among accident type.
In addition to the presented results, further insights concerning system extensions of the regarded system were gained. From the perspective of collision avoidance, the following additional functionalities would increase the effectiveness (result category grey).
ACC:
Reaction to initially standing vehicles and objects
AEB:
Enlargement of maximum lateral distance for object recognition
Reaction to bicyclists and pedestrians without limitation of motion speed and direction
LKS:
Reduction in minimum velocity
Recognition of roadside without marking
Creation of virtual middle marking based on road width.
Discussion
Using the simulative approach supported by rateEFFECT, effectiveness assessment can be automated. Due to the fact that simulation data are not available for all GIDAS reconstructed cases, a single case study is used to assess all remaining scenarios. This process is manually done and partly based on expert knowledge. Nevertheless, it is the most reasonable way to consider cases without PCM, in order to maintain the statistical representativeness of GIDAS. For objectivity and reproducibility, it is important to define clear assessment criteria and perform the process at least twice by different persons. These steps lead to time-consuming assessment.
The results show which severe and fatal accidents on German rural roads and motorways documented in GIDAS could be solved by ADAS. The number of accidents is limited by location. The considered system configuration only includes the systems ACC, AEB, and LKS. Results are based on one generic system setup and would deviate if different sensor specifications, other sensor models, or even different system algorithms were used. To continue our work, additional systems such as blind spot detection should be included and study should be expanded to urban scenarios, with a focus on pedestrians and bicyclists. The results of our benefit estimation refer to GIDAS. Although GIDAS is representative of the German federal accident statistics, detailed projection of the results should be covered by further studies.
The outcome of this study is an important contribution to emphasize the relevance of actual ADAS for crash avoidance. Our work helps to focus the development of future systems and autonomous driving for further reduction in traffic fatalities and severe injuries.
References
- Alvarez S, Page Y, Sander U, et al. Prospective effectiveness assessment of ADAS and active safety systems via virtual simulation: a review of the current practices. Paper presented at: 25th International Technical Conference on the Enhanced Safety of Vehicles (ESV); June 5–8, 2017; Detroit, MI.
- Blower D. Assessment of the Effectiveness of Advanced Collision Avoidance Technologies. Ann Arbor, MI: University of Michigan; 2014.
- Busch S. Entwicklung einer Bewertungsmethodik zur Prognose des Sicherheitsgewinns Ausgewählter Fahrerassistenzsysteme. Berlin, Germany: Technische Universität Berlin; 2005.
- Deutscher Verkehrssicherheitsrat. Vision Zero Kurz-Vortrag. Bonn, Germany: Author; 2017.
- Erbsmehl C. Simulation of real crashes as a method for estimating the potential benefits of adcanced safety technologies. Paper presented at: 21st International Technical Conference on the Enhanced Safety of Vehicles (ESV); June 15–18, 2009; Stuttgart, Germany.
- Mammar S, Glaser S, Netto M, Blosseville JM. Time-to-line crossing and vehicle dynamics for lane departure avoidance. In: Proceedings of the 7th International IEEE Conference on Intelligent Transport Systems. Osaka, Japan: IEEE; 2004:618–623.
- Ministry of Transport and Communications. En Route to a Society with Safe Road Traffic. 1997. Swedish Ministry of Transport and Communications Memorandum DS 1997. Borlänge, Sweden: Swedish National Road Administration.
- Otte D. In-Depth-Unfallforschung und deren Moeglichkeiten der Nutzung von Daten-Ein Historischer und Prospektiver Ueberblick. Munich, Germany: Hochschule fuer Angewandte Wissenschaften Kempten; 2015.
- Page Y, Fahrenkrog F, Fiorentino A, et al. A comprehensive and harmonized method for assessing the effectiveness of advance driver assistance systems by virtual simulation. Paper presented at: 24th International Technical Conference on the Enhanced Safety of Vehicles (ESV); June 8–11, 2015; Gothenburg, Sweden.
- Statistisches Bundesamt (DESTATIS). Verkehrsunfälle 2017. Wiesbaden, Germany: Author; 2018.
- Verkehrsunfallorschung an der TU Dresden GmbH German In-Depth Accident Study (VUFO GIDAS). Codebook GIDAS. Dresden, Germany: Author; 2018.
- Verkehrsunfallforschung an der TU Dresden GmbH Pre-Crash-Matrix (VUFO PCM). Codebook GIDAS Based Pre-Crash-Matrix. Dresden, Germany: Author; 2018.
- Wille JM, Zatloukal M. rateEFFECT—Effectiveness evaluation of active safety systems. Paper presented at: 5th International Conference ESAR Expert Symposium on Accident Research; 2012.
- Winner H, Hakuli S, Lotz F, Singer C. Handbuch Fahrerassistenzsysteme: Grundlagen, Komponenten und Systeme für aktive Sicherheit und Komfort. Wiesbaden, Germany: Vieweg + Teubner Verlag; 2015.