
 ?Mathematical formulae have been encoded as MathML and are displayed in this HTML version using MathJax in order to improve their display. Uncheck the box to turn MathJax off. This feature requires Javascript. Click on a formula to zoom.
Abstract
Objective: The objective of this research study was to estimate the number of left turn across path/opposite direction (LTAP/OD) crashes and injuries that could be prevented in the United States if vehicles were equipped with an intersection advanced driver assistance system (I-ADAS).
Methods: This study reconstructed 501 vehicle-to-vehicle LTAP/OD crashes in the United States that were investigated in the NHTSA National Motor Vehicle Crash Causation Survey (NMVCCS). The performance of 30 different I-ADAS system variations was evaluated for each crash. These variations were the combinations of 5 time-to-collision (TTC) activation thresholds, 3 latency times, and 2 different response types (automated braking and driver warning). In addition, 2 sightline assumptions were modeled for each crash: One where the turning vehicle was visible long before the intersection and one where the turning vehicle was only visible within the intersection. For resimulated crashes that were not avoided by I-ADAS, a new crash delta-V was computed for each vehicle. The probability of Abbreviated Injury Scale 2 or higher injury in any body region (Maximum Abbreviated Injury Scale [MAIS] 2+F) to each front-row occupant was computed.
Results: Depending on the system design, sightline assumption, I-ADAS variation, and fleet penetration, an I-ADAS system that automatically applies emergency braking could avoid 18–84% of all LTAP/OD crashes. Only 0–32% of all LTAP/OD crashes could have been avoided using an I-ADAS system that only warns the driver. An I-ADAS system that applies emergency braking could prevent 47–93% of front-row occupants from receiving MAIS 2 + F injuries. A system that warns the driver in LTAP/OD crashes was able to prevent 0–37% of front-row occupants from receiving MAIS 2 + F injuries. The effectiveness of I-ADAS in reducing crashes and number of injured persons was higher when both vehicles were equipped with I-ADAS.
Conclusions: This study presents the simulated effectiveness of a hypothetical intersection active safety system on real crashes that occurred in the United States. This work shows that there is a strong potential to reduce crashes and injuries in the United States.
Introduction
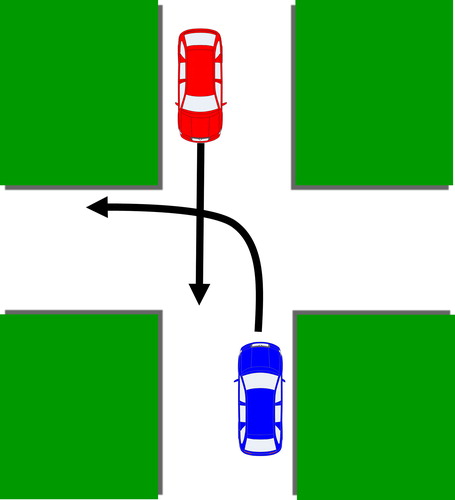
Approximately 22% of all crashes in the United States are related to vehicles turning left in intersections (Choi Citation2010). Intersection advanced driver assistance systems (I-ADAS), sometimes referred to as left-turn assist, are a promising design feature to help prevent or reduce the severity of some left turn across path/opposite direction (LTAP/OD) crashes. A diagram depicting an LTAP/OD crash is shown in . Previous work investigated the crash and injury benefits of a hypothetical I-ADAS in straight crossing path (SCP) crashes (Scanlon et al. Citation2017) using the same I-ADAS system. Sander (Citation2017) computed intersection automatic emergency braking (AEB) benefits using a different system design with effectiveness estimates developed using the German In-Depth Accident Study crash data set. Vehicle-to-vehicle and vehicle-to-infrastructure technologies have also been explored as a potential method for avoiding intersection crashes. These technologies are advantageous because they do not require line of sight, which is a strong limitation of the method provided here. The primary disadvantage of vehicle-to-vehicle and vehicle-to-infrastructure technologies is that effectiveness is limited by the degree to which vehicles are equipped with this technology (Boran et al. Citation2012). This study considers only the benefits of a hypothetical vehicle-based I-ADAS system.
Figure 1. A diagram of the LTAP/OD crash mode. The red car is the traveling-through vehicle and the blue car is the turning vehicle.
The objective of this study was to estimate the number of LTAP/OD crashes and injuries that could be prevented in the United States if vehicles were equipped with an I-ADAS with the same capabilities as the hypothetical system analyzed in this study. Results are presented for the case where one vehicle was equipped with I-ADAS and for the case where both vehicles were equipped with I-ADAS.
Methods
Data source
The study was based on the analysis of 501 crashes investigated as a part of the National Motor Vehicle Crash Causation Survey (NMVCCS), a nationally representative crash database conducted by the NHTSA. The NMVCCS study was a survey of towaway crashes in the United States in which emergency medical services were called to the scene. Crash investigators collected detailed scene diagrams before the crash was cleared. The information collected included the point of impact and final rest positions and orientations of all collision partners, which allowed comprehensive reconstructions of each crash to take place. A detailed summary of the included cases can be found in Table A1 (see online supplement). Cases were excluded if necessary information, such as precrash movement, speed limit, stop location, vehicle dimensions, vehicle rest positions, or occupant demographics, was not available. Intersection crashes in which a rollover occurred were not considered. Crashes with 3 or more vehicles impacted were not considered.
Crash reconstruction
The purpose of crash reconstruction was to determine the location and speed as a function of time for each vehicle involved in the crash. The methods for path and speed reconstruction have been described previously (Scanlon et al. Citation2017; Scanlon, Page, et al. Citation2016; Scanlon, Sherony, and Gabler Citation2016). In summary, we assumed that each vehicle followed the path indicated on the scene diagram drawn by the NMVCCS crash scene investigator. Speed reconstruction for each vehicle occurred in 3 phases: the pre-intersection phase, the intersection phase, and the evasive action phase. The pre-intersection phase covered the vehicle deceleration prior to crossing the intersection boundary. The intersection phase covered the vehicle acceleration while entering the intersection. The evasive action phase covered any evasive action before the crash. The moment of impact was reconstructed as part of the evasive action phase. The pre-intersection phase modeled 3 possible pre-intersection movements: Stopped, rolling stop, or traveling through. The model was selected based on the PREMOVE variable in NMVCCS and the crash narrative. The stopped model assumed that the vehicle was stopped at the intersection boundary and requires no information prior to the vehicle stopping. The rolling stop model includes a deceleration model developed previously from the 100-Car Naturalistic Driving Study using the methodology of Noble et al. (Citation2016). The traveling through model assumed that no deceleration occurred prior to entering the intersection.
The intersection phase of speed reconstruction was dependent on the pre-intersection movement. The rolling stop and completely stopped vehicles used an acceleration model developed from event data recorder data (Scanlon et al. Citation2018), where vehicles accelerate from the intersection boundary to the point of impact. Traveling-through vehicles did not have any simulated acceleration during this phase. During the evasive action phase, the speed of the vehicle simulated from the intersection phase was compared to the impact speed determined from a PC-Crash (Datentechnik Citation2013) simulation of the NMVCCS crash. A logistic regression model developed from event data recorder data was used to determine the probability that the vehicle performed evasive braking based on the intersection phase impact speed and the PC-Crash impact speed. In some cases the speed of the vehicle at impact from the intersection phase was higher than the impact speed simulated using PC-Crash. We assumed that this difference was caused by the vehicle performing some evasive braking prior to the crash. Two variations of each crash were simulated using I-ADAS: One with evasive braking and one without. The weight of each crash was split for each variation, weighted by the probability that evasive braking occurred. In cases where the probability of evasive braking or no evasive braking was extremely likely (probability of 99% or greater), the unlikely scenario was not simulated. Additionally, for cases where the impact speed was below 15 mph for traveling-through drivers, we always assumed that evasive braking had occurred. Evasive braking assumed a jerk value of with a peak deceleration of 0.3, 0.4, or 0.8 g dependent on icy, wet, or dry surface conditions noted by the NMVCCS crash investigator. When evasive braking did not occur, the beginning of the intersection phase was moved backwards along the vehicle path until the simulated impact speed matched the reconstructed impact speed.
I-ADAS simulation
The hypothetical I-ADAS system design modeled in this work has been described previously for SCP crashes by Scanlon et al. (Citation2017). The vehicle detection sensor was located on the front center of the vehicle and had a 120-m range with a 120° sensing cone centered forward (60° on each side). This sensor configuration differed from what was used in the SCP study. We assumed that sensors in this system continuously scanned for potential collision partners. In LTAP/OD crashes, both vehicles approach the intersection from opposing directions, which means that in many situations it is possible to see an oncoming vehicle long before it enters the intersection. However, this is not always the case: Sometimes, a line of cars in the opposing left turn lane obstructs the view of the traveling-through vehicle from the turning vehicle. We simulated 2 sightline assumptions, referred to as the worst-case and best-case sightline assumptions. In the best-case sightline assumption, the earliest detection opportunity for both vehicles was when the left-turning vehicle began to turn left (left its initial travel lane) and had a clear line of sight to the potential collision partner. In the worst-case sightline assumption, the I-ADAS vehicle was not able to detect the potential collision partner if the clear line of sight extended through the left turn lane, simulating the case where a line of cars blocked the left turn lane. In cases where no left turn lane was present, the worst-case sightline assumption case did not have a line of cars and the simulation was identical to the best-case sightline assumption with identical I-ADAS performance. After detection, the I-ADAS system waited for a simulated computational latency time. Three computational latency times were simulated: 0, 125, and 250 ms. The 0 ms (instantaneous) case represents an optimistic limiting case. After this computational latency time, the time-to-collision (TTC) was continuously monitored. TTC is defined in EquationEq. (1)(1)
(1) , where
is speed of the I-ADAS vehicle,
is acceleration of the I-ADAS vehicle, and
is the distance to the intersection point of the paths of the I-ADAS vehicle and the target vehicle:
(1)
(1)
If the TTC dropped below a configurable threshold, 2 system designs were simulated: Either a warning was issued or automated braking was activated. The TTC thresholds simulated were 1.0 to 3.0 s in 0.5 s increments. The warning-based system was simulated to apply braking at after a perception–reaction time (Nygård Citation1998). Three perception–reaction time values of 0.69, 0.93, and 3.2 s were used. Reaction times were developed previously using a simulator study (Chen et al. Citation2011), and these values are the 17th percentile, 50th percentile, and 83rd percentile reaction times, respectively. The automated braking system was simulated to apply braking at
without delay. Brake application continued until full braking was reached. Full braking was −0.3, −0.4, or −0.8 g (Franck and Franck Citation2009) depending on whether the original crash had icy, wet, or dry conditions, respectively, as noted by the NMVCCS crash scene investigator. A total of 30 I-ADAS variations (5 TTC thresholds, 3 system latencies, and 2 system designs) were simulated for each original crash. Each of the 15 warning-based I-ADAS variations was simulated 3 times for each perception–reaction time. These 60 I-ADAS reaction time variations were simulated under the worst-case and best-case sightline assumptions. These 120 I-ADAS reaction time variations were simulated for either vehicle equipped with I-ADAS in each case and for the case where both vehicles were equipped with I-ADAS. These 360 I-ADAS reaction time–sightline variations were simulated for up to 4 evasive maneuver conditions in the original case. In addition, each original NMVCCS case was resimulated without I-ADAS as a baseline for evaluating injury. A total of 447,122 simulations were conducted.
Impact simulation
Simulated I-ADAS crashes had 3 possible outcomes: Unmodified, modified, and avoided. Unmodified cases had no I-ADAS braking in either vehicle and the outcome was identical to the original NMVCCS case. Modified cases had I-ADAS braking that changed the characteristics of the crash but did not avoid the crash. Avoided cases had I-ADAS braking that prevented the crash from occurring. Injury risk was modeled for unmodified and modified cases. Injury risk modeling has been published previously (Bareiss et al. Citation2018; Bareiss and Gabler Citation2018; Scanlon et al. Citation2017) and the injury risk curves used in this study are presented in the Injury Risk Modeling section of the Appendix (see online supplement). Injury risk was modeled to be a function of impact location, delta-V, vehicle parameters, and occupant parameters. Delta-V was computed for each vehicle in each I-ADAS simulation using PC-Crash. Simulations were performed by placing each vehicle in PC-Crash in their respective positions and orientations at the moment of contact. Each vehicle was assigned its respective velocity at impact, and the simulation was run for 300 ms. Total delta-V was computed over this time frame. Because the intent of this study was to predict injury effectiveness for a future fleet, all vehicles were assumed to be equipped with frontal and side airbags and have passive safety performance equivalent to vehicles rated 5 stars under the NHTSA New Car Assessment Program rating system. Injury benefits were computed for all front-row occupants aged 13 or older in each vehicle as noted in each NMVCCS case.
Results
Crash benefits
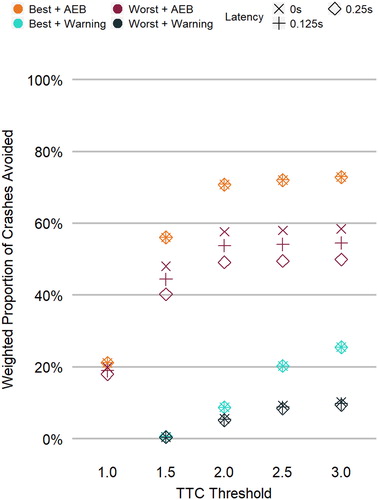
The first goal of this article was to predict the potential crash benefit of I-ADAS to avoid LTAP/OD crashes. Benefits are presented in the form of percentage effectiveness, where 0% means that no crashes were avoided with I-ADAS and 100% means that all crashes were avoided with I-ADAS. Crash avoidance benefits are presented in (for more detail, see , online supplement) for the single vehicle equipped case. When only one vehicle was equipped with I-ADAS, 0–26% of crashes were avoidable for a warning-based system. I-ADAS designs with a higher TTC threshold avoided a greater percentage of crashes. System latency was not as strongly related to crash effectiveness as it was in SCP I-ADAS (Scanlon, Sherony, and Gabler Citation2016). The sightline assumption had a strong impact on effectiveness. Peak warning effectiveness was 26% in the best-case sightline assumption and only 10% in the worst-case sightline assumption. In the AEB system design, 18–73% of crashes were avoidable. System latency was not correlated to crash reduction effectiveness in the best-case sightline assumption. However, using the worst-case sightline assumption, AEB system effectiveness dropped by 1–5 percentage points for each 125 ms of additional computational latency time. Peak effectiveness was 73% for the best-case sightline assumption and 59% for the worst-case sightline assumption.
Figure 2. I-ADAS crash reduction effectiveness for the case where one vehicle was equipped with I-ADAS. Each point represents a unique threshold latency–system design–sightline assumption. The star-and-diamond shape indicates several latency values overlaid on top of one another. “Best” and “worst” refer to the best-case and worst-case sightline assumptions, respectively.
(for more detail, see , online supplement) describes I-ADAS effectiveness when both vehicles in the crash were equipped with I-ADAS. I-ADAS effectiveness was higher when both vehicles were equipped with I-ADAS. For a warning-based system, 0–32% of crashes were avoidable. Peak warning system effectiveness was 32% in the best-case sightline assumption and 15% in the worst-case sightline assumption. In the AEB system design, 36–84% of crashes were avoidable. In the worst-case sightline assumption, AEB system effectiveness dropped by 2–11 percentage points for each 125 ms of additional computational latency time.
Figure 3. I-ADAS crash reduction effectiveness for the case where both vehicles were equipped with I-ADAS. Each point represents a unique threshold latency–system design–sightline assumption. The star-and-diamond shape indicates several latency values overlaid on top of one another. “Best” and “worst” refer to the best-case and worst-case sightline assumptions, respectively.
Injury benefits
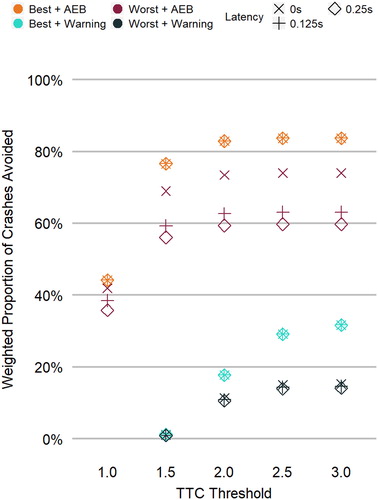
The second goal of this article was to predict injury reduction benefits of I-ADAS in LTAP/OD crashes. Injury reduction benefits were defined as the percentage reduction in number of Maximum Abbreviated Injury Scale (MAIS) 2+F injured occupants over the age of 12 in the front row of the vehicle. An MAIS2+F injured occupant is a person who received an injury to any body region with an Abbreviated Injury Scale (AIS) score of 2 or higher, including those occupants who received unknown injuries (AIS = 7) but were fatally injured. AIS coding was based on the 2008 update (Gennarelli Citation2008). In this study, an MAIS2+F injured front-row occupant age 13 or older was referred to as an injured occupant. We assumed that occupants in avoided crashes had no injuries. Injured occupant reduction effectiveness is presented in (for more detail, see , online supplement) for the single vehicle equipped case. Warning-based I-ADAS systems were able to avoid 0–32% of injured occupants. The maximum injury effectiveness was 32% for the best-case sightline assumption and was 11% for the worst-case sightline assumption. In the worst-case sightline assumption, warning system effectiveness dropped by 0–1 percentage points for each 125 ms of computational latency time. AEB-based I-ADAS systems were able to avoid 47–86% of injured occupants. The maximum AEB effectiveness was 86% in the best-case sightline assumption and 71% in the worst-case sightline assumption. In the worst-case sightline assumption, AEB system effectiveness dropped by 2–6 percentage points for each 125 ms of computational latency time.
Figure 4. I-ADAS injured person reduction effectiveness for the case where one vehicle was equipped with I-ADAS. Each point represents a unique threshold latency–system design–sightline assumption. The star-and-diamond shape indicates several latency values overlaid on top of one another. “Best” and “worst” refer to the best-case and worst-case sightline assumptions, respectively.
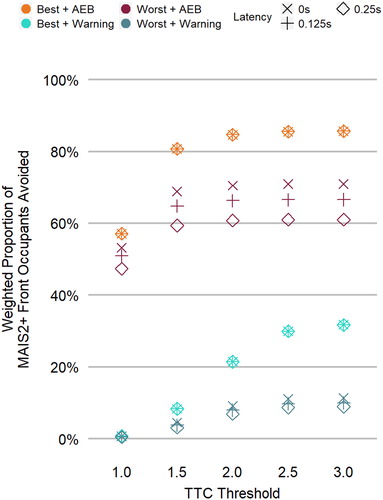
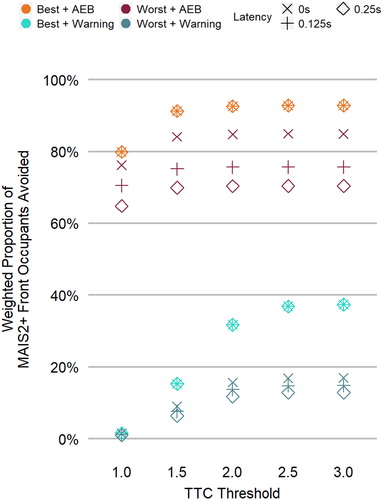
(for more detail, see , online supplement) describes the effectiveness of I-ADAS in reducing the number of injured occupants when both vehicles in the crash were equipped with I-ADAS. The effectiveness of I-ADAS in reducing injuries was higher when both vehicles were equipped. Warning-based I-ADAS systems were able avoid 1–37% of injured occupants. The maximum effectiveness in reducing occupant injuries was 37% for the best-case sightline assumption and 17% for the worst-case sightline assumption. In the worst-case sightline assumption, warning effectiveness was reduced by 0–2 percentage points for each 125 ms of computational latency time. AEB-based I-ADAS systems were extremely effective at avoiding injured occupants, with effectiveness values ranging from 65 to 93%. The maximum AEB effectiveness was 93% for the best-case sightline assumption and 85% for the worst-case sightline assumption. In the worst-case sightline assumption, benefits reduced by 5–9 percentage points for each 125 ms of computational latency time.
Figure 5. I-ADAS injured person reduction effectiveness for the case where both vehicles were equipped with I-ADAS. Each point represents a unique threshold latency–system design–sightline assumption. The star-and-diamond shape indicates several latency values overlaid on top of one another. “Best” and “worst” refer to the best-case and worst-case sightline assumptions, respectively.
Discussion
I-ADAS system effectiveness in LTAP/OD crashes was strongly related to TTC threshold and system design (warning vs. AEB). TTC threshold and system design governed the total delay in response. I-ADAS system designs with higher TTC thresholds responded sooner to a potential crash. Warning systems included a perception–reaction time delay and responded later to a potential crash. Higher computational latency times reduced the effectiveness of the I-ADAS system under the worst-case sightline assumption. In these cases, a large computational delay decreases the amount of time available for braking, reducing effectiveness. In the best-case sightline assumption, fewer cases were affected by the increased computational latency time. I-ADAS benefits in crash and injury were high; in many I-ADAS system designs, more than half of all crashes or injured persons could be avoided. Results were similar to previously published work on I-ADAS in SCP intersection crashes (Sander and Lubbe Citation2018; Scanlon, Sherony, and Gabler Citation2016; Scanlon et al. Citation2017). Injury benefits followed the same trends as crash benefits. However, injury benefits were higher than crash benefits because many cases where the crash was not avoided had positive injury outcomes, where the I-ADAS system was able to reduce the severity of the crash. In some cases, injury outcomes were worse in these modified cases, which we refer to as disbenefit cases. The properties and causation of these disbenefit cases are not fully understood and will be the subject of future research.
Increasing the TTC threshold above 2 s did not significantly increase system effectiveness. We believe that this is due to the relationship between the earliest detection opportunity and the TTC threshold in some cases. In these cases at high TTC thresholds when the opposing vehicle is detected or becomes a threat (started turning), the TTC value is already under the threshold. AEB braking or warning begins immediately upon detection or when the turning vehicle starts turning, regardless of the TTC threshold. In this situation, increasing the TTC threshold does not change the crash outcome. For a sufficiently high TTC threshold, all crash situations would trigger the AEB braking or warning at the earliest detection opportunity and increasing the TTC threshold would have no effect on I-ADAS effectiveness. In a realistic deployment, this would produce a large number of false activations. The I-ADAS system in this study was only simulated for crash situations and false activations were not considered.
Limitations
This study has a number of limitations. First, normal variations in driver behavior, such as deceleration and acceleration profiles, rolling stop speed, and alertness, were not considered. This study used median values for these characteristics of driver behavior. Modeling I-ADAS using “normal” driving could limit the application of this methodology for drivers who exhibit nonnormal behavior, such as situations with aggressive drivers.
Second, we assumed 2 sightline assumptions: No obstructions and complete obstruction. Real-world situations are a mix of these 2 cases. Additionally, NMVCCS cases contained no information about fixed and moving obstructions, such as vehicles, pedestrians, cyclists, infrastructure, or flora. Objects such as trees and traffic signs in the median have the potential to limit sensor visibility and affect I-ADAS benefits.
Third, we assume a hypothetical I-ADAS system design. Production vehicle active safety systems are subject to engineering, practical, and regulatory constraints not considered in this study and are highly proprietary. To reduce the sensitivity of our conclusions to the choice of I-ADAS design, we modeled a variety of I-ADAS design parameters. In addition, this study used TTC as the trigger criterion for activation, though other systems have used minimum required braking for braking-based intersection assist systems (Sander Citation2017). Fourth, we assumed that no secondary collisions occurred after the first collision. This assumption caused the model to overestimate I-ADAS effectiveness in some crashes.
Supplemental Material
Download MS Word (921.6 KB)Acknowledgments
Our special thanks to Katsuhiko Iwazaki and Takashi Hasegawa of Toyota for sharing their technical insights and expertise throughout the project. The authors also acknowledge the undergraduate and graduate research assistants at Virginia Tech for their assistance in building the data sets used in this study: David Holmes, Stephen Hunter, Daniel Gutierrez, Kaitlyn Wheeler, Stephani Martinelli, Kristin Dunford, Kay Battogtokh, Elizabeth Mack, Robert Vasinko, Daniel Surinach, Dong Gyu Lee, Dillon Richardson, Kevin Ota, and Arnab Gupta.
Data availability statement
The original data source for this study, NMVCCS, is publicly available from NHTSA. The reconstructions performed for this study are not publicly available.
Additional information
Funding
Related Research Data
References
- Bareiss M, David M, Gabler HC. Preliminary Estimates of Near Side Crash Injury Risk in Best Performing Passenger Vehicles. SAE International; 2018. Available at: https://doi.org/10.4271/2018-01-0548. Accessed February 13, 2018.
- Bareiss M, Gabler HC. Estimates of frontal crash injury risk in best performing passenger vehicles. Paper presented at: 2018 World Congress of Biomechanics; 2018; Dublin, Ireland.
- Boran C, Bostrom O, Jacobson BJH, Lie A, Sander U. Saving Lives with V2X Versus On-Board Sensing Systems—Which will be More Effective?: Technology Leadership Brief. 2012. Available at: http://papers.sae.org/2012-01-9017/. Accessed February 13, 2019.
- Chen H, Cao L, Logan DB. Investigation into the effect of an intersection crash warning system on driving performance in a simulator. Traffic Inj Prev. 2011;12:529–537.
- Choi E-H. Crash Factors in Intersection-Related Crashes: An On-Scene Perspective. 2010. Available at: http://doi.apa.org/get-pe-doi.cfm?doi=10.1037/e621942011-001. Accessed August 15, 2018.
- Datentechnik. PC-Crash. Linz, Austria: Dr. Steffan Datentechink GmbH; 2013.
- Franck H, Franck D. Mathematical Methods for Accident Reconstruction: A Forensic Engineering Perspective. Boca Raton, FL: CRC Press; 2009. Available at: https://www.taylorfrancis.com/books/9781420089011. Accessed February 13, 2019.
- Gennarelli TA. Abbreviated Injury Scale 2005: Update 2008. Barrington, IL: Association for the Advancement of Automotive Medicine; 2008.
- Hurvich CM, Tsai C-L. Regression and time series model selection in small samples. Biometrika. 1989;76:297–307.
- Noble AM, Kusano KD, Scanlon JM, Doerzaph ZR, Gabler HC. Driver Approach and Traversal Trajectories for Signalized Intersections Using Naturalistic Data. 2016. Available at: https://trid.trb.org/view/1392540. Accessed November 3, 2018.
- Nygård M. A method to analyse speed profiles for evaluating traffic safety. Paper presented at: FERSI Workshop for Young Researchers; 1998; Prague, Czech Republic.
- Sander U. Opportunities and limitations for intersection collision intervention—a study of real world “left turn across path” accidents. Accid Anal Prev. 2017;99:342–355.
- Sander U, Lubbe N. Market penetration of intersection AEB: characterizing avoided and residual straight crossing path accidents. Accid Anal Prev. 2018;115:178–188.
- Scanlon JM, Page K, Sherony R, Gabler HC. Using Event Data Recorders from Real-World Crashes to Investigate the Earliest Detection Opportunity for an Intersection Advanced Driver Assistance System. 2016. Available at: http://papers.sae.org/2016-01-1457/. Accessed March 26, 2018.
- Scanlon JM, Sherony R, Gabler HC. Preliminary potential crash prevention estimates for an intersection advanced driver assistance system in straight crossing path crashes. Paper presented at: 2016 IEEE Intelligent Vehicles Symposium (IV); 2016.
- Scanlon JM, Sherony R, Gabler HC. Injury mitigation estimates for an intersection driver assistance system in straight crossing path crashes in the United States. Traffic Inj Prev. 2017;18(Suppl. 1):S9–S17.
- Scanlon JM, Sherony R, Gabler HC. Models of driver acceleration behavior prior to real-world intersection crashes. IEEE Trans Intell Transp Syst. 2018;19:774–786.
