
 ?Mathematical formulae have been encoded as MathML and are displayed in this HTML version using MathJax in order to improve their display. Uncheck the box to turn MathJax off. This feature requires Javascript. Click on a formula to zoom.
Abstract
Objective: Highly reclined postures may be common among passengers in future automated vehicles. A laboratory study was conducted to address the need for posture and belt fit in these seating configurations.
Methods: In a laboratory vehicle mockup, the postures of 24 men and women with a wide range of body size were measured in a typical front vehicle seat at seat back angles of 23°, 33°, 43°, and 53°. Data were gathered with and without a sitter-adjusted headrest. Posture was characterized by the locations of skeletal joint centers estimated from digitized surface landmarks.
Results: Regression analysis demonstrated that the pelvis rotated rearward and lumbar spine flexion decreased with increasing recline. The lap portion of the 3-point belt was more rearward relative to the pelvis in more-reclined postures, and the torso portion crossed the clavicle closer to the midline of the body. Regression equations were developed to predict posture and belt fit variables as a function of passenger characteristics, seat back angle, and the use of the headrest.
Conclusions: Spine posture changes as the torso reclines in an automotive seat, and belt fit is altered by the change in posture. The results can be used to accurately position crash test dummies and computation human models and to guide the design of belt restraints.
Introduction
Increasing road vehicle automation is expected to lead to changes in passenger activities. A common prediction is that highly reclined postures will become more common as passengers choose to rest or sleep during travel. Currently, little is known about the details of reclined passenger postures, including typical body segment angles. Data-based posture prediction models have been developed for passengers (Park et al. Citation2016a), but these are limited to seat back angles (SAE A40) of 30°.
Crash safety is a prominent concern with reclined postures. Recent simulation studies have suggested that protecting passengers in highly reclined postures is challenging due to differences in occupant kinematics compared with more upright seating (Lin et al. Citation2018), but the postures used in those studies were not based on actual passenger data. Data on occupants in these seating configurations are needed so that crash simulations can be performed using accurate representations of occupant posture and belt fit. Both physical testing with anthropomorphic test devices and computational human body modeling will benefit from quantitative information from passengers.
To address this gap, the postures of a diverse group of passengers were measured across a range of seat back angles in a laboratory study. Data were gathered with and without head support at seat back angles up to 53°. Lap and shoulder belt fit relative to the pelvis and clavicle were also quantified.
Methods
Twenty-four adults (12 men and 12 women) participated in this study. The participants were chosen to span a wide range of body size so that the potential effects of body size on posture and belt fit could be investigated. The mean stature of the group was 1,694 mm with a range of 1,521 to 1,898 mm, mean body mass index (BMI) was 28.9 kg/m2 with a range of 21.0 to 37.2 kg/m2, and mean age was 47 years with a range of 18 to 71 years. Appendix Table A1 (see online supplement) presents additional anthropometric data. Standard anthropometric dimensions, including stature, body weight, and linear breadths and depths, were gathered from each participant to characterize the overall body size and shape. All data collection, including the measurement of standard anthropometric dimensions, was conducted with the participants clad in light cotton pants and shirt.
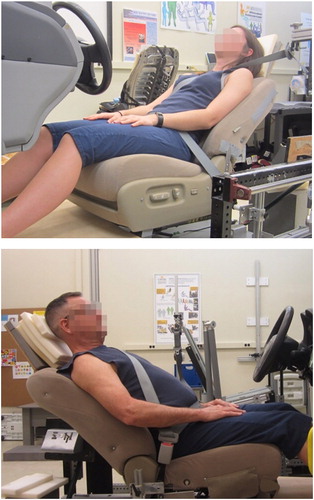
A vehicle mockup used in previous studies of driver posture and belt fit (Reed et al. Citation2013; Park et al. Citation2016b) was modified for use in the current testing. The mockup () was equipped with a 6-way power seat from a 2010 Toyota Highlander with a power recline adjuster. The seat pan angle was locked at 14.5° as measured using the SAE J826 manikin and procedures. The seat was moved rearward to a position where the participant’s feet could not contact the pedals. The seat H-point was measured using the SAE J826 manikin (SAE International Citation2018a) and the seat was adjusted to place the H-point 270 mm above the mockup floor. The original head restraint was removed from the seat. A “headrest base” was built from a padded board attached to metal rods that inserted into the head restraint receptacles in the seat back. The front surface of the headrest base was set back from the seat back surface farther than a normal vehicle head restraint to provide flexibility during testing. Note that this support is termed a “headrest” rather than “head restraint” because it was not designed to be appropriate for rear impact protection or to comply with head restraint requirements. Instead, the goal was to determine appropriate geometry for comfortable head/neck support for passengers.
Figure 1. Test seat with power recline showing user-adjustable headrest with the seat back angle set to the 53° condition.
A seat belt assembly with a sliding latch plate and retractor from the second row of a model year 2010 Toyota Sienna was mounted on customized fixtures designed to permit adjustment of belt anchorage locations. A second-row belt was used to ensure sufficient webbing length for all package conditions. A rigid buckle stalk was attached to the seat with an adjustable fixture. The outboard lower anchorage was attached to the mockup, rather than to the seat, simulating a belt mounted to the vehicle body. The retractor and D-ring were mounted to a fixture allowing the D-ring location to be adjusted over a wide range. The belt webbing width was 45 mm.
The seat back angle (SAE A40, also known as manikin torso angle) was initially set to 23° as measured with the SAE J826 H-point machine and procedures (SAE International Citation2018b). The seat back was rotated relative to this measurement position to achieve a range of recline angles. The pivot point of the seat back was 164 mm rearward and 86 mm down from seat H-point. The seat back was rotated 10°, 20°, and 30° rearward to achieve nominal seat back angles of 33°, 43°, and 53°. Note that SAE A40 was only measured at 23°.
The pivot point of the upper belt anchorage (D-ring bolt) was located 312 mm rearward, 235 mm outboard, and 626 mm up from the seat H-point of the 23° back angle condition. The upper anchorage location was rotated around the seat pivot point to keep it at the same location relative to the seat back for each of the more reclined seat back conditions. The seat pan and the lower belt anchorages were in fixed positions. The lower anchorages were mounted at an angle of 52° up from horizontal with respect to the H-point in the 23° seat back angle condition.
The study protocol was approved by an institutional review board for human subjects research at the University of Michigan (HUM00142287). After giving written informed consent, the participants changed into the testing clothes, underwent standard anthropometry testing, and then had their posture measured in the test seat as well as on a laboratory hard seat.
Eight test conditions (4 seat back angles with and without the headrest) were presented to the subjects in random order. A headrest was provided in half of the conditions. For each condition, the investigator adjusted the seat back angle to 23° and asked the participant to be seated and to make him- or herself comfortable. The investigator then reclined the seat back to the test condition angle. The participant readjusted his or her posture if necessary for comfort and donned the seat belt. If the condition did not include the headrest, the participants were asked to hold their head in a position that allowed them to look straight forward. These postures might be typical of a person looking out the windshield or viewing an entertainment display. If the headrest was included, the participants placed one or more soft foam pieces of 23-mm-thickness behind their heads until they achieved a posture that would be comfortable for “a long rest with eyes closed.”
Posture was recorded by digitizing the location of body landmarks using a FARO Arm coordinate digitizer (FARO Technologies, Lake Mary, FL) and procedures identical to those used in several previous studies (Reed et al. Citation2013; Park et al. Citation2016a, Citation2016b). In addition, a stream of points with approximately 5-mm spacing was recorded along the edges of lap and shoulder portions of the belt between the anchorages and latch plate to facilitate quantification of belt fit.
Body landmark locations were also recorded in a laboratory hard seat that allows access to posterior spine and pelvis landmarks that are inaccessible in the automotive seat (see Reed et al. [Citation2013] and Park et al. [Citation2016b]) for more details on the use of the hard seat). The hard seat has a 14.5° “cushion” (pan) angle and a 23° back angle designed to produce postures similar to those in an automotive seat. To estimate the pelvis location, the adjustment for adiposity described in Reed et al. (Citation2013) was applied to the points recorded on the pelvis.
The position and orientation of the bony pelvis is difficult to measure but of considerable importance. The methods used in the current study are based on those reported by Park et al. (Citation2015). The methods rely on palpation and measurement of the location of surface landmarks over the anterior superior iliac spine (ASIS) and posterior superior iliac spine (PSIS) landmarks on the pelvis. In brief, the steps are as follows:
Using the hard seat ASIS and PSIS locations, estimate the subject-specific pelvis geometry using an estimate flesh margins at the ASIS and PSIS that are based on the adjustment for BMI presented by Reed et al. (Citation2013). The pelvis geometry is defined by surface ASIS, surface PSIS, bone ASIS estimate, bone PSIS estimate, and estimated L5/S1 and left and right hip joint centers. Also record a “thigh length” as the distance between the suprapatellar landmark and estimated hip joint center location on each side obtained in the hard seat. Also record the lumbar link length (distance from estimated T12/L1 to estimated L5/S1 joint centers).
In the vehicle seat data, align the subject-specific pelvis geometry to the measured mid-ASIS point and align the lateral (inter-ASIS) axis.
Rotate around the lateral axis such that the lumbar link length (distance from estimated the L5/S1 to T12/L1 joint locations) matches the hard seat value.
With this as a starting point, apply the optimization method described in Park et al. (Citation2015), which finds the pelvis position and rotation around the lateral axis that best matches both the lumbar and left thigh segment lengths. The constraints were adjusted from those used by Park et al. (Citation2015) to account for the reclined postures. Lumbar link length was permitted to deviate from the hard seat value by up to 20 mm and the pelvis angle could change up to 10° forward or 45° rearward from the initial value. X and Z translation constraints were 25 mm forward/45 mm rearward and 25 mm upward/50 mm downward. In all but 4 cases, the left thigh segment length from the hard seat was matched within 1 mm; in the remaining cases, the resulting thigh segment length was within 10 mm of the hard seat value.
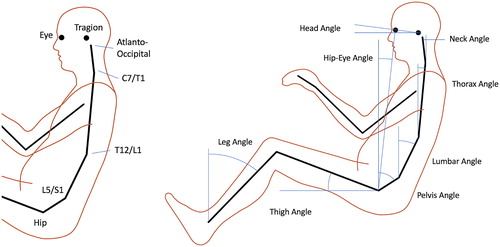
Landmark data from the hard seat and vehicle seat were used to characterize participant posture. illustrates the primary variables, which are based on the posture models reported by Reed et al. (Citation2002) and Park et al. (Citation2016a, Citation2016b). The torso posture was defined based on a kinematic linkage consisting of pelvis, lumbar, thorax, neck, and head segments. The pelvis segment connects the hip joints with L5/S1. The lumbar segment spans L5/S1 to T12/L1 and the thorax segment connects T12/L1 with C7/T1. Note that these spine “joints” are defined as the estimated center of the intervertebral disk (see Reed et al. Citation2002). The neck segment spans C7/T1 to the estimated atlanto-occipital joint location. The mean hip location (average of left and right hip joint centers) was computed with respect to the seat H-point location. The side-view orientations of the pelvis, lumbar, thorax, and neck segments were computed with respect to vertical (positive values indicate reclined from vertical). Head orientation was defined as the angle of the Frankfurt plane with respect to forward horizontal (positive with eyes up). The thigh angle was computed in side view with respect to forward horizontal, and the leg angle was reported positive rearward of vertical. Overall torso recline was quantified by the angle of the side-view vector from mean hip to eye (estimate of the center of the left eyeball) with respect to vertical.
Figure 2. Landmarks, joints, and posture variables. Angles are positive as shown except for neck angle.
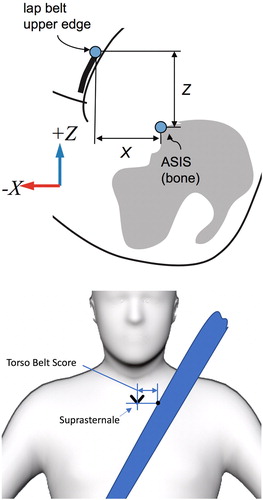
shows the dimensions used to quantify belt fit. The position of the upper/rearward edge of the lap portion of the belt was recorded relative to the estimated ASIS landmark on the bony pelvis at the lateral position of the ASIS (see Reed et al. [Citation2013] and Park et al. [Citation2016a] for additional information on the calculation procedures). The position of the torso portion of the belt was quantified by the lateral distance of the inner edge of the belt from the suprasternale landmark on the body midline at the height of the landmark.
Figure 3. Dependent measures for lap belt fit. The upper/rearward edge of the lap portion of the belt is measured at the lateral position of the right and left the predicted ASIS location. The fore–aft (X) coordinate is positive rearward of the ASIS and the vertical coordinate is positive above the ASIS landmark.
The effects of test conditions and participant characteristics were examined using a range of plotting methods as well as linear regression and analysis of variance. Potential 2-way interactions between participant characteristics and test conditions were considered, and trends were examined within sex as well as with the pooled male/female population. Potential sex differences were examined by testing for 2-way interactions between sex and anthropometric variables such as stature and by restricting the analyses to a subpopulation of men and women with the same range of stature. However, no sex-related effects were found to be significant after accounting for body size. When developing posture prediction models using regression, terms were included only if they were significant with P < .01 and the addition of the term increased the adjusted R2 value (i.e., fraction of variance accounted for by the model) by at least 0.02.
Results
Posture
The mean hip location with respect to seat H-point was not strongly affected by either the experimental variables or participant characteristics. On average, the mean hip location was 11 mm below and 16 mm rearward of the seat H-point. The mean hip location was significantly further rearward at the highest recline angle, but the difference relative to the other conditions was less than half of the standard deviation within condition. Appendix Table A2 (see online supplement) lists the mean and standard deviation of hip location for each condition.
Tables A3 and A4 (see online supplement) list body segment angle results for the headrest and no-headrest conditions. These tables summarize the variable values across subjects, so the effects of body dimensions are not considered. Table A4 lists regression functions that incorporate anthropometric predictors. Results for several variables are summarized here.
EquationEquation (1)(1)
(1) shows the regression model for the overall torso recline, represented by the side-view angle of the vector from the mid-hip location to the eye. Torso recline was strongly affected by seat back angle (BA, °), as expected, but also by BMI (kg/m2), with more upright angles observed with higher BMI. On average, the use of the headrest (HR, 1|0) increased the value of this variable by 5.3°.
(1)
(1)
Pelvis angle is an important variable for crash safety due to the importance of pelvis engagement by the lap belt. Pelvis angle was significantly affected by BMI, with slightly more upright angles associated with higher BMI, but the residual standard deviation of 15° was large relative to this effect. As expected, the pelvis tended to rock backward with increasing back angle (larger pelvis angle values), but the change in pelvis angle was only one-third the change in the seat back angle.
(2)
(2)
A measure of lumbar spine flexion was obtained by subtracting the thorax angle from the pelvis angle. About 24% of the variance in this measure was accounted for by the participant covariates and experimental variables. On average, taller participants had slightly greater lumbar spine flexion, and higher BMI was associated with lower flexion. Using the headrest caused the thorax to rotate rearward, decreasing lumbar flexion by 6.6°. Increasing recline decreased lumbar spine flexion substantially, because the thorax rotated rearward more than the pelvis. On average, an increase in the seat back angle of 30° produced a 17° reduction in lumbar spine flexion.
(3)
(3)
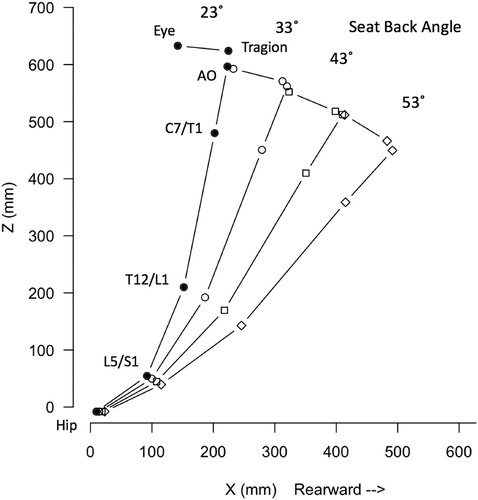
illustrates the effects of back angle on the mean torso posture for conditions with the headrest, using the mean anthropometric values (stature = 1,694 mm, body weight = 84 kg). In the figure, the torso joint locations are calculated using the angle regression functions in Table A5 (see online supplement). The increase in lumbar spine flexion with increasing seat back angle is visible as the larger change in thorax angle compared to pelvis angle.
Figure 4. Illustration of mean torso posture with headrest use across seat back angles.
Belt fit
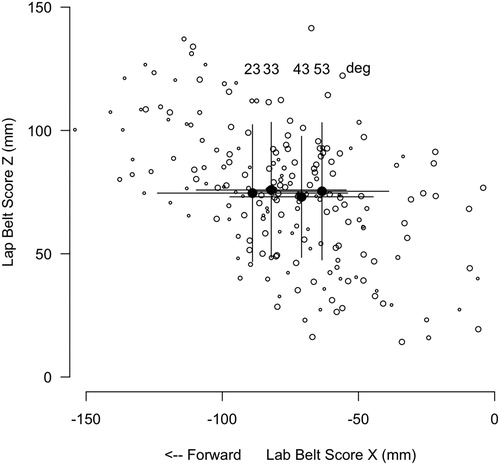
shows the mean lap belt position relative to the bone ASIS on the right side of the pelvis (see Appendix Table A6, online supplement, for summary statistics). On average, the lap belt was forward and above the pelvis. The belt was further rearward relative to the pelvis, on average, with increasing seat back angle, but the vertical position was not significantly affected. Appendix Table A7 (see online supplement) lists regression models for lap belt fit. BMI was the dominant predictor, with higher BMI associated with further forward and higher lap belt positions.
Figure 5. Distribution of lap belt locations relative to estimated bone ASIS on the right side of the pelvis. Condition means and standard deviations are shown. Data from smaller back angles are shown with smaller symbols. For reference, the belt webbing width is 45 mm.
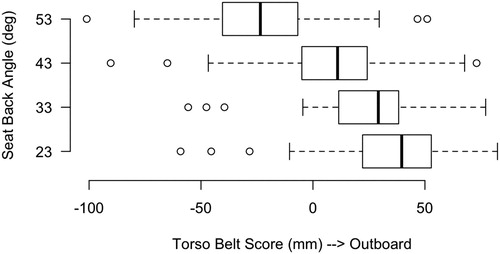
shows the distributions of torso belt score across seat back angles. On average, the torso portion of the 3-point belt was further inward with greater recline. The belt crossed the body midline at the height of the clavicle at the largest recline angle. Torso belt score was significantly affected by stature and the ratio of sitting height to stature. A significant quadratic effect of seat back angle was observed (see Appendix Table A7).
Figure 6. Torso belt score as a function of seat back angle. Higher scores are more outboard. A score of zero indicates that the inner edge of the belt lies on the body centerline at the height of the clavicle (suprasternale landmark).
Discussion
This is the first detailed examination of highly reclined postures in automotive seats. Previous studies had been limited to seat back angles of 30° (Park et al. Citation2016a), but the current data extend to 53° and could reasonably be extrapolated to 60°, based on the finding of predominantly linear effects of seat back angle on posture variables.
This study is unusual in finding hip locations slightly rearward of seat H-point, on average, even at the 23° seat back angle. Many previous studies have found hip locations somewhat forward of the H-point (e.g., Reed et al. Citation2002; Park et al. Citation2016a, Citation2016b). More-rearward hip locations were expected in the more-reclined conditions, because the position of the seat back angle pivot results in the seat back moving rearward behind the pelvis as it reclines. Because the order of test conditions was randomized, the finding of the hips being rearward of the H-point in the 23° condition may result from changes in participant behavior due to the experience of highly reclined conditions.
The pelvis rotated rearward with increasing recline but lagged behind the change in seat back angle. In contrast, the thorax moved approximately at the same rate as the seat back (coefficient 0.9), so that lumbar spine flexion decreased with increasing recline. Over the seat back angle change of 30°, lumbar spine flexion decreased an average of 17°.
Consistent with previous studies (e.g., Reed et al. Citation2013; Park et al. Citation2018), the lap belt was typically above and forward of the pelvis by approximately a belt width on average, with the belt further forward and higher for individuals with higher BMI. Lap belt fit changed slightly with increased recline, with the belt shifting rearward, closer to the pelvis. However, because the vertical position with respect to the ASIS remained the same, on average, the effect that this change would have on lap belt performance in crash scenarios is unclear. Park et al. (Citation2018) showed that the lap belt fit placement on passengers is typically much farther from the pelvis than is the case with anthropomorphic test devices.
The participants placed the shoulder belt significantly further inboard (closer to occupant centerline) at higher recline angles, to the extent that at 53° most participants placed the belt over the top of the sternum (suprasternale landmark) rather than centered on the clavicle. Note that the participants donned the belt after finding a comfortable reclined posture, which may be a different sequence from what would be expected in a vehicle. The D-ring (upper anchorage) location was rotated around the seat H-point at the same rate as the seat back, creating nominally constant belt geometry. More study is needed to understand why the belt fit changed in this way, whether this change is realistic for long-duration sitting, and the potential safety consequences.
This study has important limitations that should be addressed in future work. A single seat was used, and this seat was not designed for highly reclined postures. Seats specifically designed for such postures may have different contours and kinematics and could produce different postures. For example, a different seat contour may produce different effects of seat back angle on lumbar spine flexion. The seat belt was not designed for reclined postures and the particular contour of the seat many have interacted with body shapes in ways that influenced the findings with respect to the effects of body size on posture. Only an approximation of a seat-integrated belt was presented. Posture measurements were made during a short-duration sitting session. The observed postures were largely sagittally symmetric, but long-duration, reclined sitting might result in increased asymmetry. The data were also gathered in a static laboratory setting. Vehicle ride motion could result in differences in posture. The findings are also limited by the characteristics of the subject pool. A larger, more diverse subject pool would allow more powerful tests of the effects of age and body characteristics and particularly the potential interactions among age, sex, and body dimensions.
Supplemental Material
Download PDF (87.2 KB)Related Research Data
References
- Lin H, Gepner B, Wu T, Forman J, Panzer M. 2018. Effect of seatback recline on occupant model response in frontal crashes. Proceedings IRCOBI Conference; Athens, Greece. http://ircobi.org/
- Park J, Ebert SM, Reed MP, Hallman JJ. 2015. Development of an optimization method for locating the pelvis in an automobile seat. Paper presented at: 6th International Conference on Applied Human Factors and Ergonomics, Las Vegas, Nevada.
- Park J, Ebert SM, Reed MP, Hallman JJ. 2016a. A statistical model including age to predict passenger postures in the rear seats of automobiles. Ergonomics. 59(6):796–805. 10.1080/00140139.2015.1088076
- Park J, Ebert SM, Reed MP, Hallman JJ. 2016b. Statistical models for predicting automobile driving postures for men and women including effects of age. Hum Factors. 58(2):261–78. 10.1177/0018720815610249
- Park J, Ebert SM, Reed MP, Hallman JJ. 2018. Comparison of three-point belt fit between humans and ATDs in rear seats. Traffic Inj Prev. 19(sup1):S65–S9.
- Reed MP, Ebert SM, Hallman JJ. 2013. Effects of driver characteristics on seat belt fit. Stapp Car Crash J. 57:43–57.
- Reed MP, Manary MA, Flannagan CAC, Schneider LW. 2002. A statistical method for predicting automobile driving posture. Hum Factors. 44(4):557–68.
- SAE International. 2018a. J826: Devices for use in defining and measuring vehicle seating accommodation. Warrendale (PA): SAE International.
- SAE International. 2018b. J1100: motor vehicle dimensions. Warrendale (PA): SAE International.