
Abstract
Objective: It is well established within the traffic psychology literature that a distinction can be made between driving skill and driving style. The majority of self-report questionnaires have been developed for car drivers, whereas only limited knowledge exists on the riding skill and style of cyclists. Individual differences in cycling skills need to be understood in order to apply targeted interventions.
Methods: This study reports on a psychometric analysis of the Cycling Skill Inventory (CSI), a self-report questionnaire that asks cyclists to rate themselves from definitely weak to definitely strong on 17 items. Herein, we administered the CSI using an online crowdsourcing method, complemented with respondents who answered the questionnaire using paper and pencil (n = 1,138 in total). Our analysis focuses on understanding the major sources of variance of the CSI and its correlates with gender, age, exposure, and self-reported accident involvement as a cyclist.
Results: The results showed that 2 components underlie the item data: Motor–tactical skills and safety motives. Correlational analyses indicated that participants with a higher safety motives score were involved in fewer self-reported cycling accidents in the past 3 years. The analysis also confirmed well-established gender differences, with male cyclists having lower safety motives but higher motor–tactical skills than female cyclists.
Conclusions: The nomological network of the CSI for cyclists is similar to that of the Driving Skill Inventory for car drivers. Safety motives are a predictor of self-reported accident involvement among cyclists.
Introduction
It is well established that a distinction exists between driving skill and driving style. These dimensions arise from self-reports such as the Driving Skill Inventory (DSI), distinguishing between skills and safety motives (Lajunen and Summala Citation1995), and the Driver Behaviour Questionnaire, distinguishing between errors and violations (Reason et al. Citation1990). The majority of questionnaires have been developed for drivers, whereas only limited knowledge exists on the riding skill and style of cyclists. Exceptions are Feenstra et al. (Citation2010), Hezaveh et al. (Citation2018), and Useche, Montoro, Tomas, and Cendales (Citation2018), who developed cycling behavior questionnaires, and Martínez-Ruiz et al. (Citation2014), who found that young males are involved in more cycling accidents than older females. The overinvolvement of males in cycling accidents may be because males cycle more often, behave more riskily, and are more likely to commit traffic violations compared to females (Johnson et al. Citation2011; Useche, Montoro, Alonso, and Tortosa Citation2018).
The high number of cycling accidents raises questions about how to improve cycling safety. Road safety improvements can be categorized into 3 main headings: engineering, education, and enforcement (e.g., Learoyd Citation1950). In addition to improvements in enforcement and engineering (e.g., cycling gear, helmets, bicycle stability, road infrastructure), cycling behavior needs to be addressed; for example, by means of educational interventions. Thus, it is important to understand to what extent individual differences are associated with accident involvement. Herein, we focus on the Cycling Skill Inventory (CSI), a questionnaire that is derived from the DSI. The CSI was introduced by De Groot-Mesken and Commandeur (Citation2014) and reused by Kovácsová et al. (Citation2016) in a sample of middle-aged and older cyclists.
One concern with self-report questionnaires is method bias. In particular, social desirability and the use of similar scale formats can result in inflated correlations between items and between constructs (see online supplement for an illustration). Previous literature using the CSI (Kovácsová et al. Citation2016) showed that the 2 components of the CSI (safety motives and motor–tactical skills) were substantially correlated (Spearman’s ρ = 0.51, n = 61). This strong correlation is theoretically implausible, as can be verified from objective data. De Winter et al. (Citation2009) found in a driving simulator study with 804 participants that participants with a higher violations score (equivalent to low scores on the safety motives component) made fewer steering errors (equivalent to high scores on the motor–tactical skills component), r = −0.28. This negative correlation is in line with Williams and O’Neill (Citation1974), who showed that racing drivers (who must have high motor–tactical skills) had a higher number of speeding violations (i.e., poorer safety motives) than normal drivers.
We aimed to examine the major sources of variance in the CSI ratings, correlations between CSI scores, age, gender, cycling frequency, and accident involvement, using a large sample of respondents. A proposed approach to account for method bias is not to perform an often-recommended oblique rotation but an orthogonal rotation instead, forcing the components to be uncorrelated. Accordingly, we performed a principal component analysis with orthogonal rotation and examined the differences with the obliquely rotated components. Additionally, we used a partial correlation approach to account for method bias. Finally, we aimed to compare the present findings of the CSI with correlational patterns observed for the DSI (Lajunen and Summala Citation1995).
Methods
Participants
A total of 1,138 respondents (63.0% males, mean age = 35.0 years) completed the questionnaire online or using paper and pencil. Respondents who participated online were recruited via CrowdFlower (n = 962) and Facebook (n = 46). These respondents completed the CSI near the end of a study about cyclists’ responses to videos of hazardous traffic situations (Kovácsová, De Winter, and Hagenzieker Citation2019); in Kovácsová, De Winter, and Hagenzieker (Citation2019), the CSI responses were not analyzed. Crowdsourcing participants became aware of our survey by logging into a channel website; they would see the survey among a list of available crowdsourcing projects. The Facebook participants were recruited via cycling-related Facebook groups in the Netherlands.
The online sample was complemented with paper-and-pencil CSI questionnaires (n = 130), which participants completed as part of computer-based hazard perception experiments at the Delft University of Technology, the Netherlands. The CSI was provided in the English language, except for a portion (n = 71) of the paper-and-pencil questionnaires, which were completed in Dutch among middle-aged and older cyclists (Kovácsová, Vlakveld, et al. Citation2019).
The 1,138 participants were mostly from the Netherlands (n = 175), United States (n = 157), Italy (n = 115), Venezuela (n = 112), Canada (n = 67), Serbia (n = 52), and the UK (n = 51). In this study, all countries and subsamples were pooled. The online supplement provides results for the 4 countries with more than 100 respondents and for 3 study subsamples.
The studies were approved by the Human Research Ethics Committee of the TU Delft. All participants provided digital or written informed consent.
Instruments
Cycling skills were measured using the CSI (De Groot-Mesken and Commandeur Citation2014). The inventory was produced based on the taxonomy of motor and safety skills by selecting items from the DSI (Lajunen and Summala Citation1995) that are also relevant to cyclists and by creating several new cycling-related items (Kovácsová et al. Citation2016). Participants rated themselves from 1 = definitely weak to 5 = definitely strong on each of the 17 skill-related items (see online supplement for the 17 items).
In addition to the CSI, the following 5 variables were obtained from the questionnaire:
Gender: 1 = female, 2 = male (63.0% males, n = 1,134, 4 missing values).
Age, years (mean = 35.0 years, SD = 12.4 years, n = 1,138).
Cycling distance: About how many kilometers (miles) on average do you cycle per week in the summertime?, on a scale from 1 = 0 km/miles, 2 = 1–5 km (1–3 miles), 3 = 6–10 km (4–6 miles), 4 = 11–30 km (7–18 miles), 5 = 31–60 km (19–37 miles), …, to 10 = more than 201 km (more than 125 miles; mean = 4.23, SD = 1.91, n = 1,124, 14 missing values).
Cycling frequency: How often do you cycle in the summertime?, from 1 = never to 6 = every day. Participants who reported never were excluded a priori, so effectively the responses ranged from 2 = less than once a month to 6 = every day (mean = 4.19, SD = 1.14, n = 1,133, 5 missing values). For this item and the previous item, the words in the summertime were not used in the paper-and-pencil questionnaires.
Accidents in last 3 years: How many accidents were you involved in as a cyclist during the last 3 years?, on a scale from 0 = 0 to 6 = more than 5 (mean = 0.49, SD = 1.05, n = 1,131, 7 missing values). Respondents had the option to answer the checkbox item, “What was the cause of the accident(s)?” From the 299 respondents who reported an accident in the past 3 years, 282 answered the checkbox item. From those 282, 51.4% selected “fall from bicycle,” 25.2% “collision with a motor vehicle (car, truck, etc.),” 22.7% “collision with obstacle (curb, pole, etc.),” 19.9% “collision with another cyclist,” 11.3% “collision with a pedestrian,” 5.7% “collision with a motorbike/moped,” and 2.8% “other.”
Statistical analyses
The psychometric properties of the CSI were examined by performing several analyses:
Descriptive statistics (means, standard deviations).
Bivariate Pearson product-moment correlations among the 17 items.
Principal component analysis. The decision to retain 2 components was made by visual inspection of the eigenvalues of the correlation matrix, also referred to as the scree plot. The component loadings were obliquely rotated using the Promax procedure with a power of 4 (Hendrickson and White Citation1964; Kovácsová et al. Citation2016). Additionally, an orthogonal rotation was applied, forcing the components to be uncorrelated. Component scores of the retained components were calculated using the regression method, which for principal component analysis simplifies to F = X/LT = X*inv(LT) = X*inv(r)*L*C, with F being the component scores (1,138 × 2 matrix), X being the z-scores of the item responses (1,138 × 17 matrix), L being the rotated component loadings (17 × 2 matrix), r being the correlation matrix among the items (17 × 17 matrix), and C the correlation matrix of the rotated components (2 × 2 matrix). The advantage of the regression method for calculating component scores, as opposed to using sum scores of items with salient loadings on a component, is that the regression method ensures that all 17 items are used.
Bivariate Pearson product-moment correlations between principal component scores and criterion variables.
In addition to orthogonal rotation, another approach to account for method bias is the use of partial correlations (Lindell and Whitney Citation2001). A partial correlation describes the association between 2 variables with the effect of a third variable removed. For the obliquely rotated components, correlations between safety motives and the 5 criterion variables were calculated while partialling out the motor–tactical skills. Similarly, correlations between motor–tactical skills and criterion variables were calculated while partialling out the safety motives score.
The associations between exposure (cycling distance) and the CSI scores were compared with previously published associations between exposure and DSI scores (Lajunen and Summala Citation1995). Furthermore, we compared gender differences in the CSI scores with gender differences in DSI scores.
Finally, a regression analysis was performed for predicting cycling accidents in the past 3 years. In this regression analysis, the orthogonally rotated CSI components, gender, age, and the 2 exposure variables (cycling frequency and cycling distance) were used as predictor variables.
Results
Descriptive statistics
The means and standard deviations of the 17 items are provided in the online supplement. Participants rated themselves as weakest for the item “cycling when it is slippery” (mean = 2.62 on a scale from 1 to 5) and gave relatively high ratings to themselves (>3.85) for “obeying traffic signals,” “controlling the bicycle,” “adjusting speed to the conditions,” “cycling carefully,” “obeying traffic rules,” and “showing consideration for other road users.”
Correlation matrix
First, the correlation matrix among the 17 items was inspected (see online supplement). Except for the first item (“cycling when it is slippery”), the items had positive correlations with each other. These positive correlations could be due to method bias.
Principal component analysis with oblique rotation
Next, we proceeded with a data reduction method without considering method bias. The scree plot suggested that 2 components should be retained (see online supplement). The 2-component solution accounted for 46.8% of the variance: 35.5% and 11.3% for components 1 and 2, respectively.
The rotated component loadings are shown in the online supplement Tucker’s congruence coefficient was computed between the obliquely rotated component loadings and the obliquely rotated factor loadings shown in Kovácsová et al. (Citation2016). The congruence coefficient was 0.91, indicating that the results of Kovácsová et al. (Citation2016) were fairly accurately replicated using a new and larger sample.
The obliquely rotated component loadings suggest that the first component should be interpreted as safety motives and the second component as motor–tactical skills. High loadings (>0.70) on the safety motives component were obtained for (a) “obeying traffic signals,” (b) “avoiding unnecessary risks,” (c) “cycling carefully,” (d) “obeying traffic rules,” and (e) “showing consideration for other road users.” High loadings (>0.50) on the motor–tactical skills component were found for (a) “cycling when it is slippery,” (b) “knowing how to act in particular traffic situations,” (c) “controlling the bicycle,” (d) “sudden braking and/or swerving when needed,” (e) “fast reactions,” (f) “predicting traffic situations ahead,” and (g) “maneuvering smoothly through busy traffic.”
There were a few items (items 4, 6, 8, 9, 14) that loaded (>0.2) on both components (see online supplement). These cross-loadings may occur because these items involve both safety motives and motor–tactical skills. For example, recognizing hazards in traffic can be seen as a tactical skill, where more experienced cyclists are expected to perform better, as well as a safety skill, where more considerate and risk-averse cyclists can be expected to perform better.
The orthogonally rotated loadings (see online supplement) necessarily exhibit a less simple pattern (i.e., more cross-loadings) than the obliquely rotated loadings, because the oblique rotation is not bounded by the constraint to keep the components uncorrelated.
Correlations between principal component scores and criterion variables
Obliquely rotated components
The correlation coefficients between the obliquely rotated CSI component scores and the criterion variables are shown in . The safety motives score and the motor–tactical skills score were strongly correlated (r = 0.51). This strong correlation may be due to method bias, considering that there is no theoretical reason for these 2 constructs to be correlated.
Table 1. Bivariate Pearson product-moment correlation coefficients between the obliquely rotated component scores (orthogonally rotated component scores in parentheses) of the CSI, gender, age, cycling distance, cycling frequency, and number of cycling accidents in the past 3 years.Table Footnotea
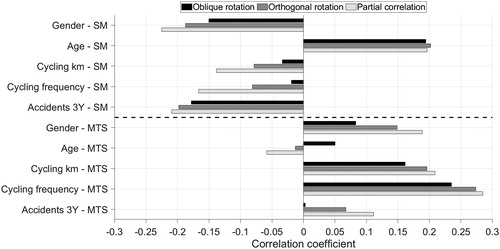
Older participants had a higher safety motives score than younger participants (r = 0.19). Furthermore, males had a lower safety motives score than females (r = −0.15). Participants with a higher safety motives score reported fewer cycling accidents in the past 3 years (r = −0.18). However, the motor–tactical skills score was not significantly associated with cycling accidents in the past 3 years (r = 0.00). Finally, participants who cycled more often (regarding cycling distance and cycling frequency) had higher motor–tactical skills scores (r = 0.16 and r = 0.24, respectively).
Orthogonally rotated components
The correlation matrix between the scores of the 2 orthogonally rotated components of the CSI and the 5 criterion variables is provided in . Due to varimax rotation, the 2 components were uncorrelated (r = 0.00). The scores for the 2 orthogonally rotated CSI components were more discriminative compared to scores after the oblique rotation. For example, males had better motor–tactical skills (r = 0.15) but poorer safety motives (r = −0.19) than females, a distinction that is clearer than the corresponding results for the obliquely rotated components (r = 0.08 and r = −0.15, respectively). Older participants had higher safety motives scores than younger participants (r = 0.20). Further correlation analyses showed that participants with a higher self-reported cycling mileage and cycling frequency had higher motor–tactical skills scores (r = 0.20 and r = 0.27, respectively) but lower safety motives scores (r = −0.08 and r = −0.08, respectively). The number of cycling accidents in the past 3 years was associated with a lower safety motives score (r = −0.20) and a higher motor–tactical skills score (r = 0.07).
Partial correlations
The partial correlations in show that the safety motives score and motor–tactical score are more discriminative compared to the correlations with the obliquely and orthogonally rotated components. For example, when using oblique rotation, cycling frequency had an association of r = −0.02 with the safety motives score and r = 0.24 with the motor–tactical skills score. In comparison, when using partial correlations (), cycling frequency had an association of r = −0.17 with the safety motives score and r = 0.28 with the motor–tactical skills score. In summary, by using the partial correlation technique, the CSI components exhibited a more distinct correlational pattern with the criterion variables.
Figure 1. Correlation coefficients between the 2 CSI component scores and the 5 criterion variables for obliquely rotated components, orthogonally rotated components, and partial correlations between the 2 CSI component scores and the 5 criterion variables. Gender is coded as 1 = female, 2 = male. SM = safety motives score, MTS = motor–tactical skills score.
Comparison between CSI and DSI
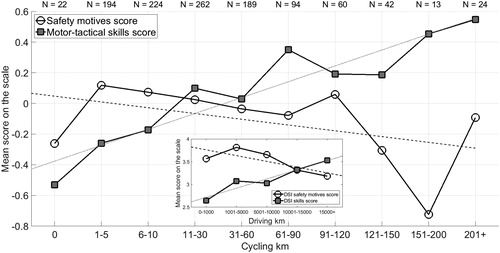
The association between weekly cycling distance and the orthogonally rotated CSI components is illustrated in and compared with results from the DSI from Lajunen and Summala (Citation1995) in the figure inset. The signs of the effects are similar between the DSI and CSI, with the safety motives score decreasing with exposure and the motor–tactical skills increasing with exposure.
Figure 2. Mean safety motives score and mean motor–tactical skills score (based on orthogonally rotated components) for the 10 levels of self-reported weekly cycling kilometers during the summertime (r = −0.08 and r = 0.20, respectively). The sample sizes are indicated at the top of the figure. The inset shows the mean safety motives score and mean skills score for 5 levels of self-reported mileage (r = −0.31 and r = 0.50, respectively) from the DSI (Lajunen and Summala Citation1995). The dashed and dotted lines are least-squares fits of the reported means. The mean and standard deviation of the safety motives score and the motor–tactical skills score of the total sample of the present study are 0 and 1, respectively.
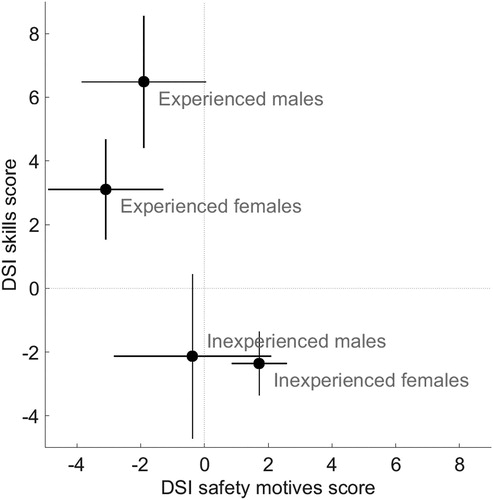
shows the mean CSI scores for 4 groups of cyclists: Inexperienced females (n = 188), inexperienced males (n = 251), experienced females (n = 142), and experienced males (n = 279). Here, inexperienced and experienced cyclists were defined according to a median split (see also Lajunen and Summala Citation1995), with inexperienced cyclists cycling 10 km or less per week and experienced cyclists cycling 31 km or more per week. For both the DSI () and the present CSI scores, experienced males appear as a high-risk group. That is, males who cycle 31 km or more per week had relatively low safety motives scores. Furthermore, despite their high motor–tactical skills scores, experienced males were involved in a disproportionate number of cycling accidents. These results can be explained because those who cycle more are more likely to be involved in an accident. Furthermore, these findings point to an interesting paradox whereby experience may be a prerequisite for acquiring motor–tactical skills, yet the same experience is dangerous. also shows that female cyclists (both inexperienced and experienced) had higher mean safety motives scores than male cyclists, whereas this pattern is not as clear among drivers (), possibly because of the small sample size and wide confidence intervals in Lajunen and Summala (Citation1995).
Figure 3. Mean safety motives score and mean motor–tactical skills score (based on orthogonally rotated components) for combinations of gender and cycling experience. Also shown are the mean numbers of self-reported cycling accidents in the past 3 years. The error bars indicate the mean ± standard error of the mean. The mean and standard deviation of the safety motives score and the motor–tactical skills score of the total sample are 0 and 1, respectively.
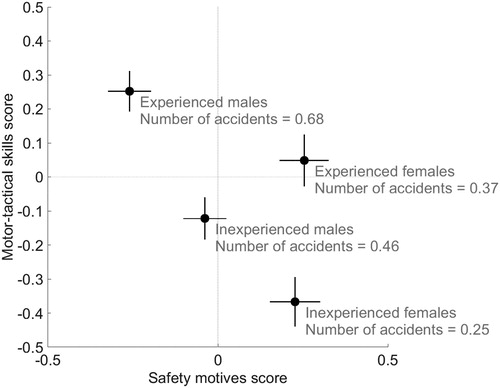
Figure 4. Mean safety motives score and mean skills score for combinations of gender and driving experience from Lajunen and Summala (Citation1995). The error bars indicate the mean ± standard error of the mean.
Regression analysis for predicting the number of cycling accidents in the past 3 years
Because the results in suggest that cycling exposure is a confounder of the relationship between motor–tactical skills and the number of cycling accidents, a regression analysis was performed. shows the results of a regression analysis for predicting cycling accidents in the past 3 years, with the orthogonally rotated CSI components, gender, age, and the 2 exposure variables as predictor variables. The results indicate that the safety motives score was a significant predictor of cycling accidents, whereas the motor–tactical skills score was not a significant predictor when the other variables are held constant.
Table 2. Linear regression analysis for predicting the number of cycling accidents in the past 3 years.Table Footnotea
Discussion
This study administered the CSI among a large sample of respondents (n = 1,138) in a diverse range of countries. The results showed that higher safety motives scores are associated with a smaller number of cycling accidents (r = −0.20). Motor–tactical skills, however, are positively associated with accidents (r = 0.07). The positive correlation between motor–tactical skills and accidents may arise because cyclists that are more skilled cycle more often. The regression analysis showed that the motor–tactical skills score was unrelated to accidents once age, gender, and exposure (cycling distance, cycling frequency) were accounted for. We also found that males are involved in more cycling accidents than females, an effect that can be attributed to males having lower safety motives and higher cycling exposure than females (; see also Lajunen and Summala Citation1995; Useche, Montoro, Alonso, and Tortosa Citation2018). Overall, the factor loading patterns and correlations for gender and exposure are similar to Lajunen and Summala (Citation1995) for the DSI and an early small-sample CSI study by Kovácsová et al. (Citation2016).
Method bias
As with any self-report questionnaire, method bias is a concern. We applied 2 methods to counteract this bias: (1) The use of partial correlations and (2) the use of orthogonal rotation. Each of these approaches resulted in clearer, more distinct correlations with criterion variables compared to the typical oblique rotation of the CSI components.
In the case of the CSI, method bias may be due to individual attitudes regarding the rating of oneself on a scale from very weak to very strong. That is, some people may be inclined to rate themselves as having strong skills, for a variety of reasons—perhaps because of social desirability or because of high self-esteem—whereas others may be inclined to rate themselves as having relatively weak skills, regardless of the item content.
In addition to using statistical corrections for accounting for method bias, as we did, future research could apply procedural remedies. The inclusion of a social desirability scale would be useful for identifying method bias, whereas forced-choice items could remove such bias and improve validity (Nederhof Citation1985; Bartram Citation2007; Brown and Maydeu-Olivares Citation2011). However, perhaps the only convincing remedy against method bias would be to assess correlations between the CSI and objective rather than self-reported accidents. De Winter et al. (Citation2018) observed statistically significant correlations between sensation-seeking scores and registered traffic accidents, thus indicating that self-reports carry some criterion validity. Elsewhere, De Winter et al. (Citation2009) analyzed objective simulator-based driving performance and found by means of factor analysis that a distinction existed between violations (e.g., speeding, tailgating) and errors (e.g., poor lane keeping), suggesting that the distinction between motives and skills is generalizable and not merely a mental construct.
Limitations
Despite our positive assessment of criterion validity of the CSI with respect to age, exposure, and gender, some limitations are acknowledged. First, we did not assess actual cycling skills (but see Kovácsová et al. [Citation2016] for correlations between CSI scores and objective skills). Furthermore, we note that the CSI and DSI have been used in different formats. In this context, it matters whether participants are asked to rate themselves with respect to an average cyclist of the same age, as in Kovácsová et al. (Citation2016), or whether an internal criterion is used, as in the present study (see also Sundström Citation2008).
The sample itself is also of influence; for example, in Lajunen and Summala (Citation1995), the sample consisted of university students and in Kovácsová et al. (Citation2016) it was middle-aged and older cyclists, whereas in the present study the sample consisted of relatively young crowdworkers, university students, and middle-aged users of electric bicycles. Our pooling of subsamples may conflate between-group differences with individual differences within the same group. In the online supplement, we provide subgroup analyses for the 4 largest countries and the 3 sampling methods. The component loadings between the subsamples showed a congruence coefficient of about 0.90, indicating that the CSI structure replicates regardless of context. However, there is heterogeneity between the groups. For example, respondents from the Netherlands reported cycling more frequently than respondents from other countries. Meesmann et al. (Citation2018) found that in the Netherlands cycling is a top 3 mode of transport for 51% of people, whereas this number is only 5% for Venezuela, pointing to major cultural differences. Future research could recruit representative cyclists of a broad age range and use multilevel modeling to separate group differences from individual differences.
We conclude that the pattern of correlations that we observed for the CSI is similar to the pattern of correlations observed for the DSI by Lajunen and Summala (Citation1995). We also showed that safety motives are a predictor of self-reported accident involvement among cyclists. We hope that the present study promotes further research and discussion about whether method bias causes spurious correlations between constructs. A thorough insight into the skill and safety motive constructs and their relations with accidents may enable better-tailored training and education programs.
Funding
This work was supported by the People Programme (Marie Curie Actions) of the European Union’s Seventh Framework Programme FP7/2007-2013/under REA grant agreement no. 608092. An abstract of this work was presented at the International Cycling Safety Conference, October 10–11, 2018, Barcelona, Spain.
Data availability
Supplemental material for this article is available at https://doi.org/10.1080/15389588.2019.1639158, whereas raw data and scripts are available at https://doi.org/10.4121/uuid:daec0b0a-17fc-425b-988c-d55c4fae476a.
Supplemental Material
Download MS Word (197.2 KB)Correction Statement
This article has been republished with minor changes. These changes do not impact the academic content of the article.
Related Research Data
References
- Bartram D. 2007. Increasing validity with forced-choice criterion measurement formats. Int J Sel Assess. 15(3):263–72.
- Brown A, Maydeu-Olivares A. 2011. Item response modeling of forced-choice questionnaires. Educ Psychol Meas. 71(3):460–502.
- De Winter JCF, De Groot S, Mulder M, Wieringa PA, Dankelman J, Mulder J. 2009. Relationships between driving simulator performance and driving test results. Ergonomics. 52(2):137–53.
- De Winter JCF, Dreger FA, Huang W, Miller A, Soccolich S, Machiani SG, Engström J. 2018. The relationship between the driver behavior questionnaire, sensation seeking scale, and recorded crashes: a brief comment on Martinussen et al. (2017) and new data from SHRP2. Accid Anal Prev. 118:54–6.
- Feenstra H, Ruiter RA, Kok G. 2010. Social-cognitive correlates of risky adolescent cycling behavior. BMC Public Health. 10(1):181–7.
- De Groot-Mesken J, Commandeur JJF. 2014. Hoe goed weten oudere fietsers wat ze kunnen?: een veldexperiment met gewone en elektrische fietsen. [How capable are elderly cyclists of assessing their skills? A field experiment with conventional and electric bicycles]. The Hague (The Netherlands): SWOV Institute for Road Safety Research. Report No. R-2014-19.
- Hendrickson AE, White PO. 1964. Promax: A quick method for rotation to oblique simple structure. Br J Stat Psychol. 17(1):65–70.
- Hezaveh AM, Zavareh MF, Cherry CR, Nordfjaern T. 2018. Errors and violations in relation to bicyclists’ crash risks: development of the bicycle rider behavior questionnaire (BRBQ). J Transp Health. 8:289–98.
- Johnson M, Newstead S, Charlton J, Oxley J. 2011. Riding through red lights: the rate, characteristics and risk factors of non-compliant urban commuter cyclists. Accid Anal Prev. 43(1):323–8.
- Kovácsová N, De Winter JCF, Hagenzieker M. 2019. What will the car driver do? A video-based questionnaire study on cyclists’ anticipation during safety-critical situations. J Safety Res. 69:11–21.
- Kovácsová N, De Winter JCF, Schwab AL, Christoph M, Twisk DAM, Hagenzieker MP. 2016. Riding performance on a conventional bicycle and a pedelec in low speed exercises: objective and subjective evaluation of middle-aged and older persons. Transp Res Part F Traffic Psychol Behav. 42:28–43.
- Kovácsová N, Vlakveld WP, De Winter JCF, Hagenzieker MP. 2019. PC-based hazard anticipation training intervention for experienced cyclists: design and evaluation. Manuscript submitted for publication.
- Lajunen T, Summala H. 1995. Driving experience, personality, and skill and safety-motive dimensions in drivers’ self-assessments. Pers Individ Dif. 19(3):307–18.
- Learoyd CG. 1950. The carnage on the roads. Lancet. 255(6600):367–9.
- Lindell MK, Whitney DJ. 2001. Accounting for common method variance in cross-sectional research designs. J Appl Psychol. 86(1):114–21.
- Martínez-Ruiz V, Jiménez-Mejías E, de Dios Luna-del-Castillo J, García-Martín M, Jiménez-Moleón JJ, Lardelli-Claret P. 2014. Association of cyclists’ age and sex with risk of involvement in a crash before and after adjustment for cycling exposure. Accid Anal Prev. 62:259–67.
- Meesmann U, Torfs K, Nguyen H, Van den Berghe W. 2018. Do we care about road safety? Key findings from the ESRA1 project in 38 countries. ESRA project. Brussels, Belgium: Vias Institute.
- Nederhof AJ. 1985. Methods of coping with social desirability bias: A review. Eur J Soc Psychol. 15(3):263–80.
- Reason J, Manstead A, Stradling S, Baxter J, Campbell K. 1990. Errors and violations on the roads: a real distinction? Ergonomics. 33(10–11):1315–32.
- Sundström A. 2008. Self-assessment of driving skill–A review from a measurement perspective. Transp Res Part F Traffic Psychol Behav. 11(1):1–9.
- Useche SA, Montoro L, Alonso F, Tortosa FM. 2018. Does gender really matter? A structural equation model to explain risky and positive cycling behaviors. Accid Anal Prev. 118:86–95.
- Useche SA, Montoro L, Tomas JM, Cendales B. 2018. Validation of the cycling behavior questionnaire: a tool for measuring cyclists’ road behaviors. Transp Res Part F Traffic Psychol Behav. 58:1021–30.
- Williams AF, O’Neill B. 1974. On-the-road driving records of licensed race drivers. Accid Anal Prev. 6(3-4):263–70.