
Abstract
Introduction
Excessive Daytime Sleepiness is a core symptom of narcolepsy and idiopathic hypersomnia, which impairs driving performance. Adequate treatment improves daytime alertness, but it is unclear whether driving performance completely normalizes. This study compares driving performance of patients with narcolepsy and idiopathic hypersomnia receiving treatment to that of healthy controls.
Methods
Patients diagnosed with narcolepsy type 1 (NT1, n = 33), narcolepsy type 2 (NT2, n = 7), or idiopathic hypersomnia (IH, n = 6) performed a standardized one-hour on-the-road driving test, measuring standard deviation of lateral position (SDLP).
Results
Results showed that mean SDLP in patients did not differ significantly from controls, but the 95%CI of the mean difference (+1.02 cm) was wide (-0.72 to +2.76 cm). Analysis of subgroups, however, showed that mean SDLP in NT1 patients was significantly increased by 1.90 cm as compared to controls, indicating impairment. Moreover, four NT1 patients requested to stop the test prematurely due to self-reported somnolence, and two NT1 patients were stopped by the driving instructor for similar complaints.
Conclusion
Driving performance of NT1 patients may still be impaired, despite receiving treatment. No conclusions can be drawn for NT2 and IH patients due to the low sample sizes of these subgroups. In clinical practice, determination of fitness to drive for these patients should be based on an individual assessment in which also coping strategies are taken into account.
Introduction
Adequate alertness is crucial for safely operating a vehicle. Several studies have shown that sleepiness while driving is one of the major causes of car accidents (Sagberg et al. Citation2004; Higgins et al. Citation2017). Severe daytime sleepiness is the most common and disturbing complaint of patients with narcolepsy and idiopathic hypersomnia (IH). Without adequate treatment, sleepiness and associated vigilance impairments in these patients may lead to impaired performance during the waking state, and thus, be potentially dangerous for traffic safety.
The current international classification of sleep disorders distinguishes two types of narcolepsy. Type 1 (NT1) is characterized by excessive daytime sleepiness (EDS), disturbed nocturnal sleep, the rapid eye movement (REM) sleep related symptoms cataplexy (i.e., sudden loss of muscle tone evoked by strong emotions), hypnagogic hallucinations and sleep paralysis. Its hallmark is hypocretin deficiency that can be measured in cerebrospinal fluid. Type 2 (NT2) presents with similar symptomatology except for cataplexy. Hypocretin measurement, if performed, must show a normal concentration. In patients with IH, excessive sleepiness manifests without evidence of REM sleep dysregulation nor hypocretin deficiency. Symptomatic management of narcolepsy and IH consists of a combination of behavioral- (e.g., the adoption of regular sleep schedules and planned daytime naps) and pharmacological treatments (Kornum et al. Citation2017). Stimulants are used as first-line treatment for daytime sleepiness. Sodium oxybate and antidepressants are primarily prescribed for treatment of cataplexy, but sodium oxybate can also improve other core symptoms of narcolepsy including sleepiness.
Patients with narcolepsy and IH are indeed known to have impaired driving performance. Driving simulator studies consistently show poor driving performance in these patients (George et al. Citation1996; Findley et al. Citation1999; Kotterba et al. Citation2004; Philip et al. Citation2013). Several studies have shown that pharmacological treatment of central hypersomnolence disorders can significantly improve patients’ daytime performance. For example, Philip and colleagues (Philip et al. Citation2014) found that modafinil 400 mg improved patients’ lane-keeping performance in an on-road driving test after 5 days of treatment, as compared to placebo. Performance was still significantly impaired, however, as compared to healthy controls. Dauvilliers and colleagues found improvements in a Sustained Attention to Respond Task (SART) after administration of modafinil and pitolisant in patients with narcolepsy, as compared to placebo treatment (Dauvilliers et al. Citation2013). More recently, Van Schie and colleagues (Van Schie et al. Citation2016) found that sodium oxybate improved daytime vigilance performance of patients with narcolepsy after 3 months of treatment, as compared to performance before treatment and to that of healthy controls. Yet, similar to the findings by Philip et al., performance was still significantly impaired as compared to healthy controls. Pizza and colleagues compared frequency of self-reported car crashes between patients with narcolepsy or IH and healthy controls and found that crash risk was significantly increased in both treated and untreated patients (Pizza et al. Citation2015). However, crash risk of patients treated for at least 5 years was not different from healthy controls, suggesting that long-term treatment protected patients from driving risk.
This raises the question whether driving performance of narcolepsy and IH patients receiving treatment (pharmacological, behavioral or both) is comparable to that of the general population. The present study aimed to determine whether actual on-the-road driving performance, measured as lateral control, of these patients is inferior to that of healthy controls. Patients with NT1, NT2 or IH presenting to sleep clinics for the evaluation of their fitness to drive to allow continuation of their license were invited for this study. Their performance was assessed using a standardized highway driving test (O'Hanlon Citation1984; Ramaekers Citation2017) and compared to that of a normative group of healthy controls who completed the same test, using identical procedures, equipment and test environment (Van der Sluiszen et al. Citation2019).
Methods
Design and participants
The current analysis compares driving performance of a group of patients with narcolepsy and idiopathic hypersomnia receiving treatment with that of a group of healthy controls. Forty-six patients (29 male, 17 female) were recruited from a larger group of 96 patients who were evaluated for their fitness to drive at the Stichting Epilepsie Instelling Nederland (SEIN, Hoofddorp, The Netherlands) and Sleep Medicine Center Kempenhaeghe (Heeze, The Netherlands), between June 2015 and January 2017. At these clinical centers, patient’s fitness to drive was evaluated for (re)granting their driving license, using a Maintenance of Wakefulness Test as part of regular care.
For participation in the highway-driving test, patients had to meet the following inclusion criteria: Diagnosis of NT1, NT2 or IH according to ICSD-3 criteria (American Academy of Sleep Medicine Citation2014), no changes in the treatment of hypersomnolence for at least 6 weeks, age between 18–75 years, and possession of a valid driver’s license. Patients were not restricted with regard to napping, smoking, drinking, food- or caffeine intake, given that the study aimed to evaluate patients’ performance in their everyday lives.
Thirty-one healthy subjects (20 male, 11 female) formed a control group. Their data were retrieved from a normative dataset collected in a previous study using the same driving test and procedures (Van der Sluiszen et al. Citation2019). Control subjects had a valid driving license for at least 3 years and drove at least 3000 km per year. Exclusion criteria were: drinking more than 21 units of alcohol per week; smoking more than 10 cigarettes a day; history of drug or alcohol abuse; presence of a significant medical-, neurological-, psychiatric- or sleep-disorder and the use of central nervous system (CNS)-active medication that may affect driving.
The Medical Ethics Committee of Maastricht University and academic hospital Maastricht approved the study (www.toetsingonline.nl, NL50579.068.14). The study was conducted in agreement with the code of ethics on human experimentation established by the Declaration of Helsinki (1964) and subsequent amendments. All participants signed an informed consent form before enrollment.
Highway driving test
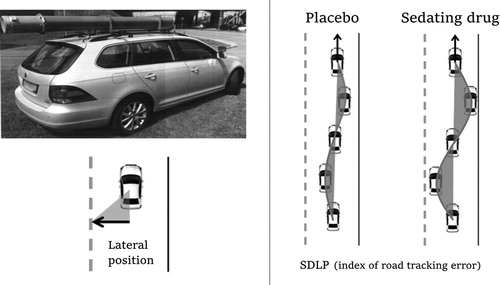
Driving performance was assessed using a standardized on-the-road highway-driving test (), which assesses standard deviation of lateral position (SDLP, in cm) as a measure of driver vehicle control (O’Hanlon Citation1984; Ramaekers Citation2017). In this test, participants drove a specially instrumented car for about 1 hour over a 100-km (61-mile) primary highway circuit (road E25, 50 km each way, between fixed terminal points at the Dutch cities of Maastricht and Kelpen-Oler), accompanied by a licensed driving instructor having access to dual controls (brakes and accelerator). The participants’ task was to drive with a steady lateral position between the delineated boundaries of the slower (right) traffic lane, while maintaining a constant speed of 95 km/h (58 mph). Participants were allowed to deviate from those instructions only to pass a slower vehicle, and to leave and reenter the highway at the mid-circuit turnaround point. Participants were instructed beforehand to terminate the test by stopping the car on the road shoulder if they have doubts about their competence to continue safely. If, however, they failed to do this and the driving instructor judged their performance to become unsafe, the participants could be ordered to stop the vehicle.
Figure 1. Standard highway driving test. Left: Volunteers drive a specially instrumented vehicle for about 1 hr over a 100-km primary highway circuit, accompanied by a licensed driving instructor having access to dual controls. The volunteer's task is to drive with a steady lateral position between the delineated boundaries of the slower (right) traffic lane, while maintaining a constant speed of 95 km/hr. The lateral position of the car relative to the middle line, between the left and right traffic lane, is continuously measured by means of a camera that is mounted on the roof of the car. Right: schematic drawing of the highway-driving test. The standard deviation of lateral position (SDLP) is an index of road tracking error or “weaving”. Sleepiness, or drugs that induce sleepiness or sedation, causes loss of vehicle control, leading to increased road tracking error. Figure and description adapted from van der Sluiszen et al. (Citation2019).
During the drive, the vehicle's speed and lateral distance relative to the left lane-line were continuously recorded via a camera mounted on top of the vehicle. These signals were captured at a rate of 4 Hz and stored on an on-board computer disk file for later pre-processing and analysis. Data pre-processing consisted of off-line visual inspection of all data by trained processors to mark data segments that revealed signal loss or disturbances, such as overtaking maneuvers and the turn-around point. The pre-processed dataset was then used to calculate means and standard deviations of lateral position, for each successive 5-km segment and for the test as a whole. The primary outcome variable was SDLP, which is a measure of road tracking error, or ‘weaving’. SDLP scores of prematurely terminated tests were calculated from the data collected until termination of each ride. Performance as measured by mean SDLP has repeatedly been found sensitive to effects of alcohol, sleep deprivation and sedating drugs (Vermeeren Citation2004; Jongen et al. Citation2015; Ramaekers Citation2017).
Drug-induced impairments in the highway-driving test have been compared to that of alcohol. Alcohol is a well-known benchmark drug that jeopardize traffic safety and shows a clear exponential dose-dependent relationship with traffic accident risk (Borkenstein et al. Citation1974; Blomberg et al. Citation2009). The clinical relevance of performance changes in the driving test have previously been determined by establishing the relationship between blood alcohol concentration (BAC) and SDLP (Louwerens et al. Citation1987). A recent meta-analysis of nine alcohol-calibration studies revealed that a mean increment in SDLP of 2.5 cm was observed during the standardized on-the-road highway-driving test at a BAC of 0.5 mg/ml. This increment has been defined as the cutoff point for clinically relevant differences in SDLP (the non-inferiority limit) (Jongen et al. Citation2017).
For both patients and healthy controls, the highway-driving test was conducted between 10:00am and 4:30pm to avoid large changes in level of traffic and to have constant lighting conditions. Furthermore, the highway-driving test was only conducted when weather conditions were expected to have a minimal influence on lateral control measures (e.g., no hail, no heavy rain, no heavy wind, etc.).
Karolinska sleepiness scale
The Karolinska Sleepiness Scale (KSS) (Åkerstedt and Gillberg Citation1990) is a subjective rating scale that measures instantaneous sleepiness. The KSS contains nine points and ranges from extremely awake (1), to, very sleepy, great effort to stay awake (9). Higher values on the KSS indicate greater subjective sleepiness. To determine the effects of driving on subjective sleepiness, patients filled out the KSS at the start (KSSstart) and end (KSSend) of the highway-driving test. The change in KSS scores (ΔKSS = KSSend - KSSstart) was used to determine the relation between changes in subjective sleepiness during the on-the-road driving test and absolute road-tracking error. The KSS data was only available for patients, given that the healthy controls were selected from a study that used general measures of sleepiness (instead of instantaneous sleepiness).
Maintenance of wakefulness test
The Maintenance of Wakefulness Test (MWT) measures how well participants can stay awake, while sitting comfortably in bed, resting against pillows, in a quiet dimly lit room. The primary outcome is mean sleep latency (in minutes) over four 40-minute sessions every 2 hour’s during the day, i.e., 10:00 am, 12:00 pm, 2:00pm and 4:00pm (Littner et al. Citation2005). A session ended when the first sign of sleep was detected (defined as either three 30 second epochs of stage 1, or, a single 30 second epoch from each other sleep stage) or after staying awake for 40 minutes.
Statistical analysis
The primary aim was to compare the on-the-road driving performance of all patients to that of a group of healthy controls. To explore performance differences between subgroups of patients, comparative analyses were planned for each type of diagnosis (NT1, NT2 and IH) and type of CNS active treatment. Treatment was classified as use of stimulants only (STI), sodium oxybate only (SBX), a combination of stimulants, sodium oxybate and/or antidepressants (COM), or no CNS active treatment (NO).
Statistical power to detect a clinically relevant mean difference in SDLP of 2.5 cm between patients and controls was as follows: all patients vs. controls, β = 0.79; NT1 patients vs. controls, β = 0.74; NT2 patients vs. controls, β = 0.39; IH patients vs. controls, β = 0.36.; STI vs. controls, β = 0.62; SBX vs. controls, β = 0.32; COM vs. controls, β = 0.58 and NO vs. controls, β = 0.32. Between-group comparisons with SDLP whose power fell below 0.50 are not reported. Assumptions for the power calculations are an alpha of 0.05 and a between subjects standard deviation of 4.3 cm (Jongen et al. Citation2017). Univariate ANOVAs were used to compare driving performance between patients and controls. Covariate corrections were added to the ANOVA model if a demographic parameter (i.e., age or driving experience) showed a significant difference between patients and controls, and, the covariate in the ANCOVA model approximated significance (p ≤ 0.10). Non-linear effects of covariates on SDLP were examined based on visual inspection of scatterplots, combined with non-linear curve estimation analyses. Exploratory analyses between controls and each patient subgroup were conducted with ANOVA simple contrasts and corrected with Least Significant Difference (LSD). The healthy control group was selected as the reference group.
GLM repeated measures were used to evaluate the effects of Time-on-Task and interactions between Time-on-task and Group. To this end, the 100 km dataset (20 segments of 5 Km each) was binned into 4 segments of approximately 25 Km each. Time-on-Task effects were determined by comparing SDLP scores of the first and fourth 25 Km-segments. These segments, represent driving on the same section of the highway (i.e., the same physical lay-out of the road). Individuals with prematurely terminated highway driving tests that had no or insufficient data in the fourth 25 km segment were excluded from time-on-task analysis.
Non-inferiority analyses were used to determine whether the 95% confidence interval CI of performance differences between patients and controls exceeded the criterion level of clinical relevance, i.e., an equivalent performance change as seen at a BAC of 0.5 mg/ml (Ramaekers et al. Citation2011). The interpretation of the non-inferiority analyses were based upon Piaggio et al. (Citation2012) and Althunian et al. (Citation2017). Patients’ performance was considered non-inferior when the upper limit of the 95% CI of the difference from controls was below the alcohol criterion for impairment. Patients’ performance was considered inferior when the lower limit of the 95% CI of the difference from controls was above the alcohol criterion. When the 95% CI of the difference from controls included both zero and the alcohol criterion for impairment, the results were considered inconclusive. Lastly, when the lower limit of the 95% CI of the difference between patients and control was above zero and the upper limit exceeded the alcohol criterion for impairment, the results were considered within the spectrum of inconclusive and inferior. Even if only a fraction of drivers showed impaired driving, thus leading to a potential increase in traffic risk, the results are advised to be seen as inferior. The non-inferiority limit for the on-the-road driving test was obtained from Jongen et al. (Jongen et al. Citation2017).
All statistical analyses were conducted by using the IBM Statistical Package for the Social Sciences for Windows, version 24 (IBM Corp., Armonk, N.Y., USA). Power calculations were performed using G*Power version 3.1 (Faul et al. Citation2007).
Results
Prematurely terminated driving tests and missing data
The driving tests of six out of 46 patients (13%) were terminated prematurely, because the driving instructor or the participant judged that it was unsafe to continue. All six prematurely terminated tests were NT1 patients who received pharmacological treatment. Four patients reported sleepiness and requested to stop the test after driving for 45 to 51 minutes. Their SDLP scores were 15.8, 18.7, 19.1, and 24.7 cm. Tests of two patients were stopped by the driving instructor (after driving for 30 and 35 minutes), because the participants was judged to be too drowsy to continue safely. Their SDLP scores were 23.1 and 30.4 cm, respectively. Data from all six patients were excluded from the Time-on-Task analysis, because of incomplete data in the fourth 25 Km segment. For one patient (diagnosed with NT1) data of the highway-driving test were missing due to failure of writing an output file after the completion of the test. This patient was excluded from all analysis. In summary, 45 patients were included in the SDLP between-group analyses, of which 39 patients were included in the Time-on-Task analyses.
Participant sample
Of the 45 patients (29 males, 16 females) included in the analyses, 32 were diagnosed with NT1, seven with NT2, and 6 with IH (). Their mean (±SD) age was 41.9 (±15.8) years, their mean (±SD) sleep latency on the MWT was 30.4 (± 9.6) minutes and they drove on average 10258 (±10424) km per year. Nineteen patients (10 NT1, 5 NT2, 4 IH) were treated with stimulant drugs only (dexamphetamine, methylphenidate, modafinil), five with sodium oxybate only (4 NT1) and sixteen patients (14 NT1) used a combination of stimulants, sodium oxybate and/or antidepressants (clomipramine, mirtazapine, venlafaxine). Five patients (4 NT1) used no medication for their hypersomnolence. Seventeen patients reported taking a scheduled nap before the start of the testing day. The mean nap duration was 32.9 (± 15.2) minutes.
Table 1. Demographic data for patients and healthy controls. Mean (±SD) is reported, if applicable.
The control group comprised 31 healthy participants (20 males, 11 females) with a mean (±SD) age of 59.8 (±10.8) years. Their annual driving experience was on average 12577 (±7684) km/year. Controls were older than patients (F1,74 = 30.18, p < 0.01), but driving experience did not differ significantly between groups.
Driving performance
Mean (±SE) SDLP scores were 18.68 (±0.56) cm in patients and 17.66 (±0.67) cm in healthy controls. The difference (1.02 cm) was not significant (F1,74 = 1.37, p = 0.25). The 95% CI of the mean difference (-0.72 cm to +2.76 cm) included zero as well as the 2.5 cm non-inferiority limit, indicating that individual variation was large and that the results should be considered as inconclusive.
To correct for the age difference between groups, univariate analysis of SDLP was repeated with age as a co-variate. Results show no significant effect of age as a co-variate on SDLP (p = 0.76), and the difference between groups remained not significant (p = 0.20). Furthermore, curve estimation analyses showed no significant (all p > 0.10) non-linear pattern of age on SDLP. Therefore, further analyses of SDLP were performed without age as a linear or non-linear covariate.
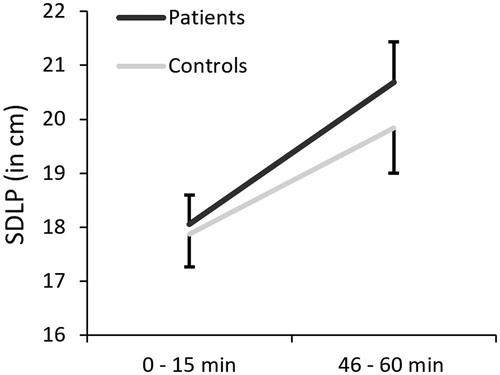
Mean SDLP scores increased from the first to the last 25 km-segment of the driving test in patients and controls (). Time-on-task analysis showed a significant effect for Segment (F1,68 = 36.16, p < 0.01), but no significant interaction between Group and Segment (F1,63 = 0.77, p = 0.39). On average, the SDLP of both groups did not significantly differ over time.
Figure 2. The mean (±SE) SDLP from the 1st to 4th segment (i.e. Time-on-Task effect) for both groups separately. Error bars are depicted 1-tailed for visualization purposes.
Mean (±SD) SDLP scores for NT1 patients was 19.56 cm (± 4.08) (). Simple contrasts revealed that SDLP was significantly increased by +1.90 cm in NT1 patients as compared to controls (p = 0.04). The upper limit of the 95% CI was above the non-inferiority limit, and the lower limit of the 95% CI above zero. Therefore, non-inferiority was not demonstrated, although the difference was statistically significant and considered clinically relevant. The mean (±SD) SDLP scores for patients treated with stimulants only, or a combination, were 18.31 cm (± 3.82) and 18.61 cm (± 4.94). No significant differences were found between treatment groups and controls (F2,63 =0.42, p = 0.66). All confidence intervals of mean differences included zero as well as the non-inferiority limit, indicating that these results should be considered inconclusive (). Individual SDLP values for each patient (sub)group and healthy controls are reported in .
Figure 3. Mean (95%CI) difference from controls in SDLP (i.e. ΔSDLP) for patient subgroups based on diagnosis and treatment. The dotted line indicates the threshold for clinically relevant impairment. Abbreviations: NT1 = narcolepsy type 1 (n=32); STI = stimulants only (n=19); COM = combination of stimulants, sodium oxybate, antidepressants (n=16).
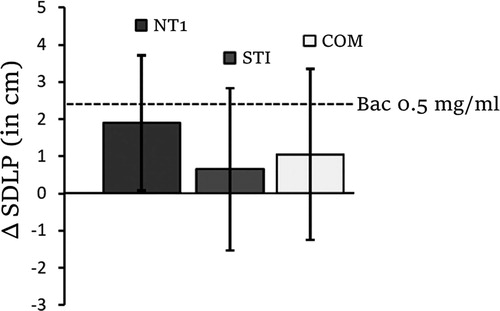
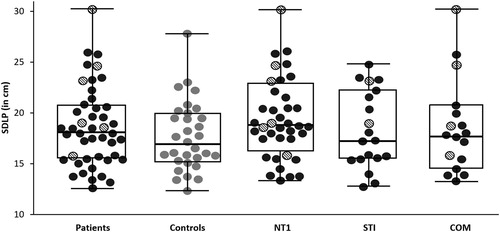
Figure 4. Individual SDLP values for healthy controls (grey circles) and each patient (sub)group (black circles). The median SDLP value for each group is shown in each box as a horizontal bar. The box lengths represents the 25th and 75th percentiles, whereas the whiskers represent the minimum and maximum values for each group. Terminated driving tests are shown as striped circles. Abbreviations: NT1 = narcolepsy type 1; STI = stimulants only; COM = combination of stimulants, sodium oxybate and/or antidepressants.
Sleepiness
Analyses showed a significant difference between treatment groups on the mean MWT score (F2.42 = 5.79, p < 0.01). The mean (±SD) MWT score for NT1, NT2 and IH patients was 27.6 (± 9.9), 35.4 (± 4.4) and 39.2 (±2.0), respectively. Subsequent analyses showed significant differences in MWT score between the NT1 and NT2 subgroup (p = 0.04), and the NT1 and IH subgroup (p < 0.01). On average, NT1 had lower MWT scores compared to NT2 or IH patients. Patients whose driving tests were terminated prematurely had significantly lower mean MWT scores (23.2 ± 6.8) as compared to patients who completed the test as scheduled (31.5 ± 9.6; F1.43 = 4.20, p = 0.05). Furthermore, across all patients, there was a significant correlation (2-tailed) between mean MWT score and SDLP (r (45) = −0.37, p = 0.01).
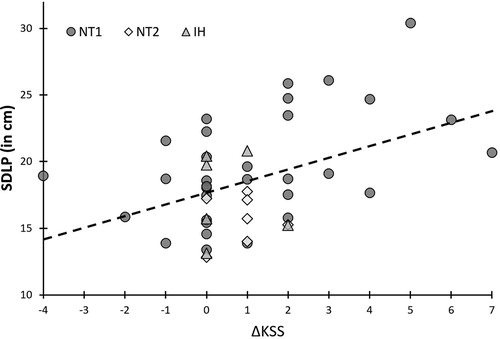
Analysis based on the KSS showed no significant difference between NT1, NT2 and IH patients groups on the KSSstart (F2.42 = 0.12, p = 0.89). Mean (±SD) KSSstart scores were 3.2 (±1.5), 2.9 (±1.6) and 3.2 (±1.5), respectively. Similar non-significant (p = 0.65) differences were obtained for sleepiness rating after the driving test. For the three groups, mean (±SD) KSSend scores were 4.3 (±2.2), 3.7 (±1.6) and 3.7 (±2.3), respectively. Patients whose driving tests were terminated prematurely had significantly higher sleepiness ratings after the completion of the driving test (7.3 ± 1.2) as compared to patients who completed the test as scheduled (3.7 ± 1.8; F1.43 = 23.86, p < 0.01). Across all patients, there was a significant correlation (2-tailed) between ΔKSS scores and SDLP (r (45) = 0.44, p < 0.01, ).
Figure 5. Correlation between individual driving performances (n = 45) as indicated by the standard deviation of lateral position (SDLP) and changes in subjective sleepiness during driving, as indicated by the delta Karolinska Sleepiness Scale (ΔKSS). Approximately 20% of the variance in SDLP across patient groups is explained by subjective sleepiness. Abbreviations: NT1 = Narcolepsy with cataplexy; NT2 = narcolepsy without cataplexy; IH = Idiopathic Hypersomnia.
Discussion
The current study examined the driving performance of patient’s with central disorders of hypersomnolence receiving treatment in comparison to a normative control group. To the best of our knowledge, this is the first study to compare on-the-road driving performance in treated patients with narcolepsy and IH to that of a group of healthy controls. Overall results showed that the 95% CI around the mean increase in SDLP between all patients and controls included the non-inferiority limit (i.e., +2.5 cm) and zero. This indicates that inter-individual differences in driving performance were large between patients, and results for the group as a whole should be considered inconclusive. This finding is in line with previous research showing large variation between patients (Findley et al. Citation1999; Kotterba et al. Citation2004).
Analyses revealed a clinically relevant increment in SDLP was observed for NT1 patients. Moreover, six out of 33 NT1 patients were not able to complete the 1 hour on-the-road driving test, which is notably more than what is commonly observed in other on-the-road driving studies with healthy volunteers (Verster and Roth Citation2012). Results demonstrate that driving performance in NT1 patients is, on average, not completely normalized after receiving treatment.
Transferring the current results to the medicolegal discussion of fitness to drive in nonprofessional drivers with NT1 involves a careful weighing between mobility and safety. Appropriate legislation would help patients better integrate in society and contribute to their quality of life. The most extreme position therefore, to disqualify all patients with NT1 to drive, is neither reasonable nor in agreement with current findings. To illustrate, while the driving performance of NT1 patients on group level should be regarded as impaired, a substantial part of this group performed within the boundaries of what is considered “normal” vehicle control. Furthermore, of the NT1 patients with non-completed on-the-road driving tests, the majority requested to stop the test themselves, indicating that these patients choose to act cautiously when participating in actual real-world traffic. Furthermore, patients who stopped the driving test by themselves had, on average, lower SDLP values than patients whose driving test was terminated by the driving instructor. Increases in weaving during the highway-driving test are linked to drivers becoming, or being, drowsy. It is therefore possible that patients who stopped the driving test themselves did so before the onset of increased weaving. The self-awareness of possible driving impairment, combined with the decision to discontinue driving, reflects the adequate use of coping strategies employed by narcolepsy patients (Kotterba et al. Citation2002). Indeed, a recent French cross-sectional study involving a large cohort of narcolepsy patients with long-term treatment (duration >5 years) showed that long-term treated patient had a lower crash risk then healthy controls, possibly due to the increased disease insight and awareness of possible driving risk (Pizza et al. Citation2015).
Nevertheless, the overall unrestored driving performance in treated NT1 indicates a need for appropriate tests to predict fitness to drive. The problem is, however, that most laboratory tests and subjective scales currently available lack sufficient agreement with real driving performance (Verster and Roth Citation2012; Jongen et al. Citation2015). Ideally, fitness to drive of patients with narcolepsy and IH should be evaluated by standardized on-the-road driving assessments, but these tests are costly and cumbersome. Instead, fitness to drive assessments could consist of a combination of objective and subjective tests assessing different cognitive processes involved in driving, such as vigilance and executive aspects of attention, and subjective feelings of sleepiness (Philip et al. Citation2013; Pizza et al. Citation2015; Bakhtiari et al. Citation2020).
Several aspects of this study may limit the generalization of the obtained results. First, the included patient groups were pre-selected based of the possession of a valid driver’s license in accordance with the Dutch driving license regulations. It is therefore possible that the currently included group fails to grasp the performance of patients whose hypersomnolence is, on average, more severe and lost their driver’s license. Second, the study only included driving skills for which drivers have developed automaticity, given that SDLP is an outcome measure at the operational level of driving (Michon Citation1989). Driving performance incorporates several components, such as risk assessment, decision making, and interaction with other traffic. Future studies should therefore assess the effects of multiple components of driving performance in order to generalize findings. Third, the cross-sectional nature of this study leaves the question unanswered whether treatment had a positive effect on driving performance. Due to the specific symptom profile of NT1 (existence of cataplexy), the selected pharmacological treatment is usually different from what is used in NT2 or IH patients. Suggestions for future research are to explore the facets of patient treatment with a suggested focus on treatment duration as a factor of importance (Pizza et al. Citation2015), and, to examine performance changes longitudinally by means of a pre- and post-treatment design. Furthermore, future research could investigate individual patients whose performance (strongly) deviates from the overall group as an in-depth case study. Lastly, future research could investigate the extent to which drivers who should have stopped during the highway-driving test actually did so. Such an approach would involve the use of a different driving test, such as the on-road driving assessment employed by the CBR (the Dutch driving test organization). The outcomes of this assessment provides in-depth information about driver fitness (e.g., gap distance, perception, merging) and forms a starting point for signal detection analyses. An example of this approach is described in the study by Piersma et al. Citation2016 involving fitness to drive assessments in Alzheimer patients (Piersma et al. Citation2016).
In conclusion, driving performance of the group as a whole varied widely. NT1 patients showed impaired driving performance compared to controls reflected in increased SDLP and the high frequency of stopped tests. Therefore, determination of fitness to drive in clinical practice should be based on an individual assessment. The optimization of detecting risky drivers in clinical practice benefits further by the inclusion of subjective (e.g., individual awareness) or objective sleepiness measures, in combination with objective tests that assess vigilance.
Author contributorship
All authors (NS, BU, GL, SO, JR, AV) contributed to the study design, manuscript drafting, writing, data inspection, interpretation of study results, reviewing of several manuscript drafts and approval of the final manuscript. NS and BU took care of the data preparation, statistical analyses, tables and figures.
Acknowledgment
Authors would like to thank M. Dingemanse, F.R.J. Vinckenbosch, S. Coleman, C. Steins and J. Jongen for data collection; A. van Oers and I. Brauers for the logistics work and H. Brauers for ensuring the safety of the participants during the highway driving test.
Additional information
Funding
References
- Åkerstedt T, Gillberg M. 1990. Subjective and objective sleepiness in the active individual. Int J Neurosci. 52(1-2):29–37. doi:10.3109/00207459008994241
- Althunian TA, de Boer A, Groenwold RH, Klungel OH. 2017. Defining the noninferiority margin and analysing noninferiority: an overview. Br J Clin Pharmacol. 83(8):1636–1642. doi:10.1111/bcp.13280
- American Academy of Sleep Medicine. 2014. International classification of sleep disorders—third edition (ICSD-3). AASM Resource Library [online].
- Bakhtiari R, Tomczak MV, Langor S, Scanlon JE, Granley A, Singhal A. 2020. Application of tablet-based cognitive tasks to predict unsafe drivers in older adults. Transp Res Interdiscip Perspect. 4:100105. doi:10.1016/j.trip.2020.100105
- Blomberg RD, Peck RC, Moskowitz H, Burns M, Fiorentino D. 2009. The long beach/fort lauderdale relative risk study. J Saf Res. 40(4):285–292. doi:10.1016/j.jsr.2009.07.002
- Borkenstein RF, Crowther R, Shumate R. 1974. The role of the drinking driver in traffic accidents (The Grand Rapids Study). Blutalkohol. 11:1–131.
- Dauvilliers Y, Bassetti C, Lammers GJ, Arnulf I, Mayer G, Rodenbeck A, Lehert P, Ding C, Lecomte J, Schwartz J. 2013. Pitolisant versus placebo or modafinil in patients with narcolepsy: a double-blind, randomised trial. Lancet Neurol. 12(11):1068–1075. doi:10.1016/S1474-4422(13)70225-4
- Faul F, Erdfelder E, Lang A-G, Buchner A. 2007. G*Power 3: a flexible statistical power analysis program for the social, behavioral, and biomedical sciences. Behav Res Methods. 39(2):175–191. doi:10.3758/bf03193146
- Findley LJ, Suratt PM, Dinges DF. 1999. Time-on-task decrements in “steer clear” performance of patients with sleep apnea and narcolepsy. Sleep. 22(6):804–809. doi:10.1093/sleep/22.6.804
- George C, Boudreau A, Smiley A. 1996. Comparison of simulated driving performance in narcolepsy and sleep apnea patients. Sleep. 19(9):711–717. doi:10.1093/sleep/19.9.711
- Higgins JS, Michael J, Austin R, Åkerstedt T, Van Dongen HP, Watson N, Czeisler C, Pack AI, Rosekind MR. 2017. Asleep at the wheel—the road to addressing drowsy driving. Sleep. 40(2):zsx001. doi:10.1093/sleep/zsx001
- Jongen S, Perrier J, Vuurman EFPM, Ramaekers JG, Vermeeren A. 2015. Sensitivity and validity of psychometric tests for assessing driving impairment: effects of sleep deprivation. PloS One. 10(2):e0117045. doi:10.1371/journal.pone.0117045
- Jongen S, Vermeeren A, van der Sluiszen N, Schumacher MB, Theunissen EL, Kuypers KPC, Vuurman EFPM, Ramaekers JG. 2017. A pooled analysis of on-the-road highway driving studies in actual traffic measuring standard deviation of lateral position (i.e., "weaving") while driving at a blood alcohol concentration of 0.5 g/L). Psychopharmacology (Berl). 234(5):837–844. doi:10.1007/s00213-016-4519-z
- Kornum BR, Knudsen S, Ollila HM, Pizza F, Jennum PJ, Dauvilliers Y, Overeem S. 2017. Narcolepsy. Nat Rev Dis Primers. 3:16100. doi:10.1038/nrdp.2016.100
- Kotterba S, Mueller N, Leidag M, Widdig W, Rasche K, Malin J-P, Schultze-Werninghaus G, Orth M. 2004. Comparison of driving simulator performance and neuropsychological testing in narcolepsy. Clin Neurol Neurosurg. 106(4):275–279. doi:10.1016/j.clineuro.2003.12.003
- Kotterba S, Müller N, Steiner G, Mayer G. 2002. Fahrverhalten bei Narkolepsie–Fragebogenanalyse unter Betroffenen: driving in narcolepsy–analysis by questionnaire among patients. Somnologie. 6:26–33.
- Littner MR, Kushida C, Wise M, Davila G, Morgenthaler T, Lee-Chiong T, Hirshkowitz M, Loube DL, Bailey D, Berry RB, et al. 2005. Practice parameters for clinical use of the multiple sleep latency test and the maintenance of wakefulness test. Sleep. 28(1):113–121. doi:10.1093/sleep/28.1.113
- Louwerens JW, Gloerich ABM, DeVries G, Brookhuis KA, O’Hanlon JF. 1987. The relationship between drivers’ blood alcohol concentration (BAC) and actual driving performance during high speed travel. In: Noordzij PC, Roszbach R, editors. Alcohol Drugs Traffic Safety - T86. Amsterdam: Elsevier. p. 183–186.
- Michon JA. 1989. Explanatory pitfalls and rule-based driver models. Accid Anal Prev. 21(4):341–353. doi:10.1016/0001-4575(89)90025-0
- O’Hanlon JF. 1984. Driving performance under the influence of drugs: rationale for, and application of, a new test. Br J Clin Pharmacol. 18(S1):121S–129S. doi:10.1111/j.1365-2125.1984.tb02590.x
- Philip P, Chaufton C, Taillard J, Capelli A, Coste O, Leger D, Moore N, Sagaspe P. 2014. Modafinil improves real driving performance in patients with hypersomnia: a randomized double-blind placebo-controlled crossover clinical trial. Sleep. 37(3):483–487. doi:10.5665/sleep.3480
- Philip P, Chaufton C, Taillard J, Sagaspe P, Leger D, Raimondi M, Vakulin A, Capelli A. 2013. Maintenance of Wakefulness Test scores and driving performance in sleep disorder patients and controls. Int J Psychophysiol. 89(2):195–202. doi:10.1016/j.ijpsycho.2013.05.013
- Piaggio G, Elbourne DR, Pocock SJ, Evans SJ, Altman DG, CONSORT Group. 2012. Reporting of noninferiority and equivalence randomized trials: extension of the CONSORT 2010 statement. JAMA. 308(24):2594–2604. doi:10.1001/jama.2012.87802
- Piersma D, Fuermaier AB, de Waard D, Davidse RJ, de Groot J, Doumen MJ, Bredewoud RA, Claesen R, Lemstra AW, Vermeeren A, et al. 2016. Prediction of fitness to drive in patients with Alzheimer's dementia. PLoS One. 11(2):e0149566. doi:10.1371/journal.pone.0149566
- Pizza F, Jaussent I, Lopez R, Pesenti C, Plazzi G, Drouot X, Leu-Semenescu S, Beziat S, Arnulf I, Dauvilliers Y. 2015. Car crashes and central disorders of hypersomnolence: a French study. PloS One. 10(6):e0129386. doi:10.1371/journal.pone.0129386
- Ramaekers JG. 2017. Drugs and driving research in medicinal drug development. Trends Pharmacol Sci. 38(4):319–321. doi:10.1016/j.tips.2017.01.006
- Ramaekers JG, Conen S, de Kam PJ, Braat S, Peeters P, Theunissen EL, Ivgy-May N. 2011. Residual effects of esmirtazapine on actual driving performance: overall findings and an exploratory analysis into the role of CYP2D6 phenotype. Psychopharmacology (Berl). 215(2):321–332. doi:10.1007/s00213-010-2149-4
- Sagberg F, Jackson P, Krüger H-P, Muzet A, Williams A. 2004. Fatigue, sleepiness and reduced alertness as risk factors in driving (TØI report 739/2004). Oslo, Norway: Institute of Transport Economics Oslo.
- Van der Sluiszen N, Vermeeren A, Verster J, van de Loo AJAE, van Dijken J, Veldstra J, Brookhuis KA, de Waard D, Ramaekers JG. 2019. Driving performance and neurocognitive skills of long‐term users of benzodiazepine anxiolytics and hypnotics. Hum Psychopharmacol Clin Exp. 34(6):e2715. doi:10.1002/hup.2715
- Van Schie MKM, Werth E, Lammers GJ, Overeem S, Baumann CR, Fronczek R. 2016. Improved vigilance after sodium oxybate treatment in narcolepsy: a comparison between in‐field and in‐laboratory measurements. J Sleep Res. 25(4):486–496. doi:10.1111/jsr.12386
- Vermeeren A. 2004. Residual effects of hypnotics: epidemiology and clinical implications. CNS Drugs. 18(5):297–328. doi:10.2165/00023210-200418050-00003
- Verster JC, Roth T. 2012. Predicting psychopharmacological drug effects on actual driving performance (SDLP) from psychometric tests measuring driving-related skills. Psychopharmacology (Berl). 220(2):293–301. doi:10.1007/s00213-011-2484-0
