
 ?Mathematical formulae have been encoded as MathML and are displayed in this HTML version using MathJax in order to improve their display. Uncheck the box to turn MathJax off. This feature requires Javascript. Click on a formula to zoom.
Abstract
Objective
The S-shaped function of probability of pedestrian fatality with respect to impact speed of vehicle is well known in road safety literature. However, the implication of this evidence for changes in speed for a population of drivers has not been explored.
Method
An integrated model has been developed to estimate pedestrian fatalities resulting from changes in speed of traffic. The model uses combined relative risks of injury crash rate of drivers and probability of pedestrian fatality resulting from an injury crash. Two approaches have been used—an individual approach using probability distribution of speed, and an aggregate approach, using only mean speed. The application of the model has been demonstrated using four case studies with speed of traffic before and after an intervention.
Results
It is found that even small reductions in mean speed translate to large reductions in pedestrian fatalities. The risk contributed by speeding vehicles is highly disproportionate to their share in vehicle population. In a case study from Delhi (India), in which at-grade junction was replaced with a grade-separated junction, 74% of risk of pedestrian fatalities is contributed by less than 5% speeding vehicles (>50km/h). Changes in mean speed is a poor indicator of changes in injury risk if the standard deviation of the distribution also changes significantly. A surprising finding was that large variation in the S-shape of pedestrian fatality risk function has relatively small effects on overall results.
Conclusions
A new model has been developed to estimate changes in pedestrian fatalities resulting from changes in traffic speed. The application of the model using four speed-related interventions emphasize that deterrence of a small proportion of drivers using speed enforcement can have large implications for pedestrian safety.
Introduction
There is strong evidence that speed reduction measures prevent road crashes or injuries. This evidence has resulted in multiple traffic-related measures to reduce speed, such as setting speed limits on certain roads or areas (Cairns et al. Citation2015), or introducing engineering measures such as traffic calming (Retting et al. Citation2003). Besides making roads safer, speed interventions also have the potential to reduce air pollution, increase physical activity level and improve livability (Cleland et al. Citation2020). There is now an increasing focus on risk faced by active road users such as pedestrians and cyclists, as these are linked to improved population health through higher physical activity.
The relationship between mean speed of traffic and number of crashes was first developed as a power model (Elvik et al. Citation2004; Nilsson Citation2004), and then more recently reparametrized as an exponential model (Elvik et al. Citation2019). These models, however, are not specific to a road user. Consequently, this evidence cannot be used to inform changes in injury burden of, say, pedestrians, when speed limits are imposed on certain roads. This is a major limitation of the speed-related literature. Further, these models are aggregate in nature, applicable to a population of vehicles and their total crash outcomes. They use mean speed of the traffic and therefore do not account for the variation of speed across the vehicles. However, there is ample evidence indicating that distribution of speed, and not just mean speed, has implications on crash outcomes (Elvik Citation2019).
In a recent meta-analysis reported by Elvik et al. (Citation2019), authors reported an individual-level counterpart of the aggregate exponential model. This model relates the speed of individual driver with their crash involvement rate. The authors noted that the individual-level relationship was found to be the same as aggregate-level relationship, in terms of parameters and analytical relationship. The only difference being that the former uses individual driver speed as its input while the latter uses mean speed of traffic. Elvik (Citation2019) demonstrated the application of this individual-level model to changes in speed distributions of the traffic. The study concluded that mean speed alone is a poor predictor of traffic injuries when changes in speed distribution affects one part of it (e.g., higher speed) more than other (e.g., lower speed).
There are no aggregate level models for pedestrian injuries. For pedestrians, the evidence relating speed and injuries is based on individual crash-based analysis (Hussain et al. Citation2019; Kröyer et al. Citation2014). This is the popular S-shaped relationship between speed of impact and probability of a pedestrian sustaining one of the injury severity levels (slight, severe, fatal). For example, see dotted curve in using Hussain et al. (Citation2019) for fatalities. Even though quantitative in nature, it has found mostly a conceptual application in road safety literature, such as highlighting the pedestrian survival rate at a lower speed compared to a higher speed. In the context of speed reduction measures, it is indeed significant, however, this is applicable to an individual vehicle crashing into a pedestrian, and not to the population of vehicles. This model has been limited in its use for real-world traffic, where vehicles have a wide variation in their individual speeds.
Figure 1. Individual and aggregate models of pedestrian fatality risk.
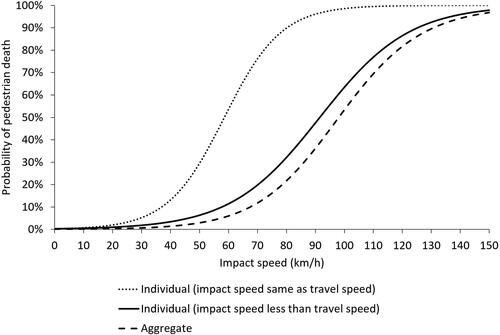
The individual-level model reported in Elvik et al. (Citation2019) is conceptually different from the individual-level model of pedestrian fatality risk (Hussain et al. Citation2019). The former relates the speed of an individual driver with the number of crashes the driver is involved in. The latter estimates the probability of pedestrian fatality given that a crash has occurred. In other words, it is a conditional probability. Therefore, unlike the individual driver model, pedestrian model cannot be applied standalone. It needs to be applied in combination with a crash prediction model. In this paper I will build upon the work by Elvik (Citation2019), and develop an integrated model to predict relative changes in pedestrian fatal crashes resulting from the changes in speed distribution of traffic. An aggregate-level approach will also be developed using only mean speed to compare estimates from the two methods.
Data and method
Case studies of speed-related interventions
I aim to use real-world data on changes in speed distribution resulting from an intervention. Since the aim is to understand the impact of changes in speed on pedestrian injuries, the focus is on the studies based in urban areas. Using the latest systematic reviews of 20 mph limits (Cairns et al. Citation2015; Cleland et al. Citation2020) individual studies were reviewed to find data on speed before and after the implementation. The reference list of each of those studies were also reviewed. Most studies reported only the mean values of speed. To develop a parametric speed distribution, the minimum set of values required are mean and standard deviation. Additional information on descriptive statistics such as median and 85th percentile is also helpful as these can be used to verify if the fitted distribution represents the underlying data well.
I present four case studies that report traffic speed before and after an intervention in urban areas. Three studies report implementation of speed limits ranging from 30 km/h to 60 km/h (Mackie Citation1998; Kidd and Radalj Citation2003; Bornioli et al. Citation2018). The fourth study, Khatoon et al. (Citation2013), is an infrastructure-based intervention where speed of vehicles has been reported before and after the conversion of an at-grade intersection to a grade-separated junction with an uninterrupted flow. The details of intervention and speed data reported by studies are presented in the online supplement. Mackie (Citation1998) has two before-after comparisons—before vs after (4 months) and before vs after (9 months) and Kidd and Radalj (Citation2003) has four such comparisons with two pairs of before-after for 50 km/h speed limit and two pairs for 60 km/h speed limit. Both Bornioli et al. (Citation2018) and Khatoon et al. (Citation2013) have one comparison each. In total there are eight before-after comparisons. The speed data in the case studies has been modeled as normal or Weibull distribution (see online supplement for details).
Integrated model of pedestrian fatalities
As seen in the introduction section, there are two sets of evidence relating speed with injury outcomes. The first is the driver crash rate model and the other is the pedestrian fatality risk model. We will integrate the two using a probabilistic relationship. The probability of pedestrian fatality can be expresses as follows using Bayes theorem:
(1)
(1)
In EquationEq. (1)(1)
(1) ,
is the (marginal) probability of pedestrian deaths,
is the probability of pedestrian death given that there is an injury,
is the probability of injury crashes, and
is the probability of an injury crash given that there is a pedestrian fatality. The latter probability is 1. Thus, above equation can be expressed as:
(2)
(2)
For the purpose of this study, all these probabilities are functions of speed. This equation can be expressed for a scenario speed and a reference speed, and the two equations are divided to obtain the following, where subscripts and
refer to the speed in a scenario and a reference speed, respectively:
(3)
(3)
As the ratio of probability of an event in a treatment to the probability of an event in a control (or reference) is referred to as relative risk, the above equation can be expressed as:
(4)
(4)
To simplify the nomenclature, we refer to the two terms on right-hand side as follows:
(5)
(5)
where C in
indicates that it is a conditional probability. In simple terms, the above equation means that number of pedestrian fatalities is a function of number of injury crashes drivers are involved in (represented by
) and the likelihood of those injuries resulting in pedestrian deaths (represented by
). In the following sections, the two relative risk terms on the right-hand side of the above equations are described first for individual-level approach followed by aggregate-level approach.
Individual-level approach
Pedestrian fatality risk
The latest evidence of fatality risk function for pedestrians has been reported by Hussain et al. (Citation2019), using a meta-analysis of 15 primary studies from multiple settings. The studies are based on outcome-based samples in which relative probability of sustaining different levels of severity of injury (including death) is modeled using case-level data of traffic crashes in which pedestrians are struck by a motor vehicle. The resulting logistic function is a conditional probability according to which given that there is a crash, it estimates the probability that it results in the death of pedestrian (see EquationEq. (6)(6)
(6) ). The subscript
for speed indicates that this model uses impact speed. Input speed in all the models presented in this paper is expressed as km/h. We can express this probability as relative risk by dividing it by the probability of fatality risk at a reference speed (see EquationEq. (7)
(7)
(7) ) and using the nomenclature for relative risk as shown in EquationEq. (5)
(5)
(5) . This is the first term in the right-hand side of the EquationEq. (5)
(5)
(5) .
(6)
(6)
(7)
(7)
To test the sensitivity of fatality risk function, two alternative functions will be used with different values of coefficients in the logistic function, which then determine the shape of the function. These include one reporting lowest odd ratio per 1 km/h increase in speed (Garrett Citation1981) and the other reporting the highest odd ratio (Zhao et al. Citation2010) as reported in the meta-analysis of 15 studies in Hussain et al. (Citation2019). Figure A2 in online supplement presents the three functions.
Driver injury crash rate
The model for driver injury crash rate is based on the individual-level exponential function reported by Elvik et al. (Citation2019). This model estimates the relative number of all injury crashes, irrespective of the road user injured, in which a driver is involved for a given travel speed compared to a reference speed. These estimates are based on case-control studies including drivers involved in crashes as cases with controls of cars not in crashes driving under comparable conditions. The speed of travel is determined by crash-reconstruction methods (Aarts and Van Schagen Citation2006). The model is shown in EquationEq. (8)(8)
(8) , where
and
are the number of fatal accidents at the reference speed and scenario speed, respectively. The subscript travel for speed implies that the input for this model is the travel speed. This is the second term in the right-hand side of the EquationEq. (5)
(5)
(5) .
(8)
(8)
Additional references can be found in the bibliography in the online supplement.
Relationship between travel speed and impact speed
The driver injury rate model presented in EquationEq. (8)(8)
(8) is a relationship between travel speed of vehicles and number of crashes. The studies included in such models use speed of general traffic. The fatality risk model for pedestrians, presented in EquationEq. (6)
(6)
(6) , are based on crash-reconstruction studies. As their aim is etiological in nature, they are concerned with the speed with which a moving vehicle struck a pedestrian i.e., the impact speed. This speed could be the same as vehicle’s original travel speed or lower depending on whether the driver had any time to initiate the breaking. To investigate the empirical relationship between vehicle’s original travel speed and the impact speed in pedestrian crashes, crash-level information reported by Kloeden et al. (Citation1997) and Anderson et al. (Citation1997) was used. Using 19 data points from the two studies, which involved a vehicle striking a pedestrian, the average ratio of impact speed to travel speed is 0.64, implying that on an average speed reduces by 36% before the vehicle struck the pedestrian. Thus the relationship between impact speed and travel speed can be expressed as:
(9)
(9)
where,
Given the limited number of data points (n = 19), there remains uncertainty in this ratio, and therefore a sensitivity analysis will be carried out to estimate its effect on fatality estimates.
Estimating changes in the number of pedestrian fatalities using individual-level approach
The percentage change in pedestrian fatalities () using the individual-level approach is presented in EquationEq. (10)
(10)
(10) . The subscript
refers to the speed bin of a distribution of speed, and subscripts
and
refer to before and after the intervention. When expressed in this form, the reference speed (as shown in EquationEqs. (7–8)) has no effect as its terms gets canceled from numerator and denominator.
(10)
(10)
The above equation effectively integrates the relative risk values across the traffic speed distributions. The calculations to estimate relative changes in the total fatalities and pedestrian fatalities are presented in section 2 in online supplement.
Aggregate-level approach
For both the pedestrian fatality risk model and driver fatality rate model, there are aggregate counterparts that use mean travel speed as input. Kröyer (Citation2015) developed a pedestrian fatality risk model using mean travel speed of the traffic instead of the impact speed of the crashing vehicle (see aggregate model in ). For this study, speed of traffic was measured at the location where pedestrian crashes occurred. This model is unique because it develops a relationship between mean speed of traffic (an aggregate-level metric) with the individual pedestrian fatality risk. In other words, this model estimates the probability of pedestrian death when crash occurs in traffic with a given mean speed. This model uses age as one of the covariates, which is assumed as 40 years for this analysis (see EquationEq. (11)(11)
(11) ). A sensitivity analysis will be carried out by varying this age from 30 to 60 years.
(11)
(11)
As in the individual model (see EquationEq. (7)(7)
(7) ), this probability will be expressed as relative risk (
) by dividing it by the probability at a reference speed.
The aggregate driver fatality model has the same expression as its individual counterpart in EquationEq. (8)(8)
(8) (Elvik Citation2019; Elvik et al. Citation2019). In this model, mean speed of traffic is used instead of individual driver’s speed. The calculation for percentage change in pedestrian fatalities using aggregate approach is as follows:
(12)
(12)
Results
Pedestrian fatalities
The relative changes in pedestrian fatalities are presented in for both individual and aggregate approaches. In Mackie (Citation1998), a 7% reduction (before vs after 4 months) in mean speed resulted in 40% reduction in pedestrian fatalities, and 1% reduction in mean speed (before vs after 9 months) resulted in 18% reduction in traffic fatalities. In Kidd and Radalj (Citation2003), 4% (50 km/h in 6 months) and 3% (60 km/h in 6 months) reduction in mean speed resulted in 21% and 17% reduction, respectively. Bornioli et al. (Citation2018), at 17% reduction in mean speed, there is 66% reduction in fatalities. Khatoon et al. (Citation2013) is estimated to have the largest increase in pedestrian fatalities by more than 250 percent.
Table 1. Changes in mean and standard deviation (SD) of speed for each intervention, model predicted changes in pedestrian fatalities and ratio of relative change in fatalities to relative change in mean speed.
Comparison between individual and aggregate-level estimates show varied results. Five out of eight cases show two estimates to be close. The two comparisons in Mackie (Citation1998), and one in Khatoon et al. (Citation2013) show a large gap between individual and aggregate estimates. In these three cases, percentage change in standard deviation of speed is much greater than percentage change in mean speed. This difference is especially stark in Khatoon et al. (Citation2013), in which mean speed is relatively the same compared to the standard deviation which increased by more than 80% (see in online supplement for before and after distributions). In other words, there is much greater change in speed distribution than explained by mean alone. Hence, aggregate methods that use mean speed are expected to have different estimates than individual approach. also presents the effectiveness of speed reduction expressed as ratio of change in fatalities to change in speed. According to individual approach, there is an average of 7% reduction in pedestrian fatalities for every unit percent reduction in mean speed. This excludes the outlying case of Khatoon et al. (Citation2013), for which changes in fatalities are much higher than the corresponding change in mean.
Individual-level approach also gives an opportunity to calculate contribution to total risk by specific parts of the speed distribution. In Khatoon et al. (Citation2013) before the intervention, there were 0.2% drivers over the speed of 50 km/h (speed limit in Delhi) and contributed 2% of total risk. The latter value is calculated from the weighted relative risk (shown in the last two columns in in online supplement). Post-intervention, the proportion of such drivers increased to 6.3% and their contribution to total risk increased to 71%. Thus, about three-quarters of the massive increase in post-intervention risk is contributed by a small minority of the drivers. In Bornioli et al. (Citation2018), pre-intervention, those over the speed of 50 km/h, comprised 27% of all drivers, but contributed to 75% of total risk. Post-intervention, their proportion reduces to 9.3% and contribution to total risk to 48%.
Table 2. Sensitivity analysis of fatality risk models.
Sensitivity analyses
The sensitivity of the results was tested against the different specifications of fatality risk functions (see in online supplement). The other sensitivity analysis is that of value of proportion () used to convert travel speed to impact speed. The two analyses are related as the proportion
effectively changes the fatality risk function and reduces the probability of death at every speed compared to the model which assumes impact speed to be the same as travel speed. shows the individual-level by Hussain et al. (Citation2019) and aggregate-level pedestrian fatality risk model by Kröyer (Citation2015). The two versions of individual-level model include the one in which impact speed is assumed to be the same as travel speed, and the one in which impact speed is a proportion (0.64) of travel speed. It is the latter version which has been used in the main analysis. The modified version of fatality risk model is close to the aggregate travel speed model. The results for the two sensitivity analyses are in and . Here also, same two cases stand out—Mackie (Citation1998) and Khatoon et al. (Citation2013), for which the effects of the risk function and values of proportion are most significant, while the rest of the cases show only small changes with respect to this proportion. The effect of age on the estimates of pedestrian fatalities using the aggregate approach had only negligible effects on the results ( in online supplement).
Table 3. Sensitivity analysis of travel speed conversion to impact speed.
Discussion
A model has been developed which integrates individual-level driver injury rates with pedestrian fatality risk conditional to injury. The model estimates relative changes in pedestrian fatalities resulting from changes in speed distribution. The application of the model has been shown for retrospective evaluation of four case studies of speed-related interventions. Speed distributions before and after the interventions were modeled using normal or Weibull distributions. We found that small changes in mean speed leads to large reduction in pedestrian fatalities—1% reduction in mean speed results in an average of 7% reduction in pedestrian fatalities. Though this finding is difficult to generalize as unexpected results are obtained if standard deviation also changes along with the mean. When changes in speed are captured well by changes in mean values, such as when the standard deviation remains the same, aggregate models using only mean speed predict as well as individual-level model using speed distributions. It was found that a small minority of high-speed vehicles contribute to a highly disproportionate risk to pedestrians. The intervention reported by Khatoon et al. (Citation2013) resulted in large increase in the pedestrian fatalities compared to other interventions where the percentage increase is much smaller. This is because Khatoon et al. (Citation2013) includes an infrastructure-based intervention in which a grade-separated intersection using a flyover replaced an at-grade intersection. As a result, there is an uninterrupted flow of the vehicles compared to before the intervention. This resulted in a large increase in the spread of the speed distribution of vehicles.
This is the first model to estimate changes in pedestrian fatalities resulting from changes in speed distribution. The literature often overlooks that most of road safety literature uses travel speed as its determinant of risk, which is different from the impact speed. This study considers the two forms of speed explicitly and relates the evidence based on these using empirical findings. As a result, the method presented in this paper integrates two isolated streams of evidence, one that focuses on drivers and the other that focuses on pedestrian crashes.
The model developed in this study provides an important analytical tool for researchers and policy makers. The proposed model can be used for quantitative estimates of the changes in pedestrian fatalities resulting from speed-related interventions such as traffic calming and changes in speed limit. Given the increasing interest of cities to reduce traffic speed to encourage use of active travel (Cleland et al. Citation2020), the estimates from the model can add to the potential health benefits. Many studies that were reviewed for speed-related data before and after an intervention did not report adequate descriptive statistics of the speed data. Most reported only mean and few reported mean and standard deviation. With such data, it is not possible to estimate skewness in the distribution, or whether the intervention changes speed distribution asymmetrically. Road safety journals should pursue standardization of reporting speed data.
Supplemental Material
Download MS Word (151.4 KB)References
- Aarts L, Van Schagen I. 2006. Driving speed and the risk of road crashes: a review. Accid Anal Prev. 38(2):215–224. doi:https://doi.org/10.1016/j.aap.2005.07.004
- Anderson RWG, McLean AJ, Farmer MJB, Lee B-H, Brooks CG. 1997. Vehicle travel speeds and the incidence of fatal pedestrian crashes. Accid Anal Prev. 29(5):667–674. doi:https://doi.org/10.1016/S0001-4575(97)00036-5
- Bornioli A, Bray I, Pilkington P, Bird EL. 2018. The effectiveness of a 20 mph speed limit intervention on vehicle speeds in Bristol, UK: a non-randomised stepped wedge design. J Transp Health. 11:47–55. doi:https://doi.org/10.1016/j.jth.2018.09.009
- Cairns J, Warren J, Garthwaite K, Greig G, Bambra C. 2015. Go slow: an umbrella review of the effects of 20 mph zones and limits on health and health inequalities. J Public Health (Oxf)). 37(3):515–520. doi:https://doi.org/10.1093/pubmed/fdu067
- Cleland CL, McComb K, Kee F, Jepson R, Kelly MP, Milton K, Nightingale G, Kelly P, Baker G, Craig N, et al. 2020. Effects of 20 mph interventions on a range of public health outcomes: a meta-narrative evidence synthesis. J Transp Health. 17:100633. doi:https://doi.org/10.1016/j.jth.2019.100633
- Elvik R. 2019. A comprehensive and unified framework for analysing the effects on injuries of measures influencing speed. Accid Anal Prev. 125:63–69. doi:https://doi.org/10.1016/j.aap.2019.01.033
- Elvik R, Christensen P, Amundsen A. 2004. Speed and road accidents: an evaluation of the power model. TØI Rep. 740:2004.
- Elvik R, Vadeby A, Hels T, van Schagen I. 2019. Updated estimates of the relationship between speed and road safety at the aggregate and individual levels. Accid Anal Prev. 123:114–122. doi:https://doi.org/10.1016/j.aap.2018.11.014
- Garrett JW. 1981. An analysis of fatal pedestrian accidents. SAE Technical Paper.
- Hussain Q, Feng H, Grzebieta R, Brijs T, Olivier J. 2019. The relationship between impact speed and the probability of pedestrian fatality during a vehicle-pedestrian crash: A systematic review and meta-analysis. Accid Anal Prev. 129:241–249. doi:https://doi.org/10.1016/j.aap.2019.05.033
- Khatoon M, Tiwari G, Chatterjee N. 2013. Impact of grade separator on pedestrian risk taking behavior. Accid Anal Prev. 50:861–870. doi:https://doi.org/10.1016/j.aap.2012.07.011
- Kidd B, Radalj T. 2003. Post 50 km/h implementation driver speed compliance: Western Australian Experience in Perth Metropolitan Area. In: Road Safety Research, Policing and Education Conference, 2003, Sydney, New South Wales, Australia.
- Kloeden CN, McLean AJ, Moore VM, Ponte G. 1997. Travelling speed and the risk of crash involvement volume 2-case and reconstruction details. Adelaide NHMRC Road Accid Res Unit, Univ Adelaide.
- Kröyer HRG. 2015. Is 30 km/ha ‘safe’speed? Injury severity of pedestrians struck by a vehicle and the relation to travel speed and age. IATSS Res. 39(1):42–50. doi:https://doi.org/10.1016/j.iatssr.2014.08.001
- Kröyer HRG, Jonsson T, Várhelyi A. 2014. Relative fatality risk curve to describe the effect of change in the impact speed on fatality risk of pedestrians struck by a motor vehicle. Accid Anal Prev. 62:143–152. doi:https://doi.org/10.1016/j.aap.2013.09.007
- Mackie A. 1998. Urban speed management methods. Transport Research Laboratory. TRL Report 363.
- Nilsson G. 2004. Traffic safety dimensions and the Power Model to describe the effect of speed on safety. Bulletin 221. Lund Institute of Technology, Department of Technology and Society, Traffic Engineering, Lund.
- Retting RA, Ferguson SA, McCartt AT. 2003. A review of evidence-based traffic engineering measures designed to reduce pedestrian-motor vehicle crashes. Am J Public Health. 93(9):1456–1463. doi:https://doi.org/10.2105/ajph.93.9.1456
- Zhao H, Yin Z, Chen R, Chen H, Song C, Yang G, Wang Z. 2010. Investigation of 184 passenger car–pedestrian accidents. Int J Crashworthiness. 15(3):313–320. doi:https://doi.org/10.1080/13588260903335290