
 ?Mathematical formulae have been encoded as MathML and are displayed in this HTML version using MathJax in order to improve their display. Uncheck the box to turn MathJax off. This feature requires Javascript. Click on a formula to zoom.
Abstract
Objective: Speeding is a prevalent and complex risky behavior that can be affected by many factors. Understanding how drivers speed is important for developing countermeasures, especially as new automation features emerge. The current study seeks to identify and describe types of real-world speeding behaviors with and without the use of partial-automation.
Methods: This study used a combination of supervised and unsupervised data analysis techniques to assess relevant factors in real-world speeding epochs, extracted from the MIT Advanced Vehicle Technology Naturalistic Driving Study, and classified them into distinct speeding behaviors. Speeding epochs were defined as traveling at least 5 mph over the speed limit for a minimum duration of 3 s. Vehicle speed-exceedance profiles were characterized over time using Dynamic Time Warping and included in multivariate models that evaluated the associations between different features of the speeding epochs, such as speeding duration and magnitude. Finally, the identified features were used to cluster speeding behaviors using the Gower dissimilarity measure.
Results: The analysis yielded four types of behaviors in both partially-automated and manual driving: (i) Incidental speeding (low duration, low magnitude), (ii) Moderate speeding (low duration, moderate magnitude), (iii) Elevated speeding (moderate duration, high magnitude), and (iv) Extended speeding (long duration, high magnitude). When comparing the behaviors with and without partial-automation use, both Incidental and Moderate speeding were found to have significantly longer durations with partial-automation than manual driving. Elevated speeding was found to be more prevalent and associated with higher magnitudes during manual than with partially-automated driving. Finally, although Extended speeding was more prevalent during automation use, it was associated with a lower mean and maximum speed magnitude compared to Extended speeding during manual driving.
Conclusions: This work highlights the variability in speeding behavior between and within partially-automated and manual driving. The design of systems that mitigate risky speeding behaviors should consider targeting divergent behaviors observed between manual and automated driving as a mechanism to mitigate the prevalence of the different behaviors associated with each state.
Introduction
Speeding is a prevalent and risky behavior that not only increases the likelihood of a crash, but also the severity of the injury if a crash were to occur (Aarts and van Schagen Citation2006). In 2019, speed was a factor in 9,478 fatalities and an estimated 326,000 injuries in crashes, accounting for 26% of US traffic fatalities and 12% of traffic injuries (National Center for Statistics and Analysis Citation2021). A recent study found that 99.8% of drivers drove 10 mph above the speed limit at least once per trip with the average driver engaging in a speeding behavior of over 10 mph above the speed limit 2.75 times per trip (Richard et al. Citation2020). Monfort et al. (Citation2022) found that when on motorways and driving manually, drivers traveled above the speed limit 77% of the time.
Speeding is considered a complex behavior that can be affected by many factors. For example, speeding has been shown to be more prevalent among males, younger drivers, and at lower speed limits (Richard et al. Citation2013; Ankem et al. Citation2018; Perez et al. Citation2021). Teens’ speeding behavior has been shown to be affected by social norms, the presence of risky friends, and socio-economic status (Simons-Morton et al. Citation2012, Citation2017; Kar et al. Citation2018). Further, speeding has been shown to be influenced by emotions such as anger or anxiety (Roidl et al. Citation2014) and the driver’s attitude toward speeding (Richard et al. Citation2016). Understanding why and how drivers speed is important for developing successful countermeasures. A study examining naturalistic data from drivers in Seattle and Texas conducted a cluster analysis and identified six types of speeding: (1) speeding up (common prior to an increase in speed limit), (2) speed drop (common after a speed limit decrease), (3) incidental speeding (characterized by short durations and low speed exceedances), (4) casual speeding (similar to incidental speeding, but characterized by higher speed exceedances), (5) cruising speeding (characterized by long durations), and (6) Aggressive speeding (characterized by moderate durations, and relatively high speed exceedances and speed variability) (Richard et al. Citation2016).
The National Survey of Speeding Attitudes and Behaviors, conducted by the National Highway Traffic Safety Administration in 2011, interviewed over 6,000 households across the US to ascertain driver behavior and attitude toward speeding (Schroeder et al. Citation2013). The survey found that while most drivers agreed that speed limits should be obeyed, speeders were more likely to agree that people should travel with the flow of traffic. The survey also examined the interviewees’ attitudes toward in-vehicle speeding countermeasures, such as “a device that slows down the vehicle when it senses another car or object is too close”, and found that about 60% of drivers (45% of speeders) thought that such a feature would prevent them from speeding.
Driver support features that can control the longitudinal and/or lateral vehicle kinematics (SAE Level 1 and Level 2 automation), are increasingly available and may change the prevalence and characteristics of drivers’ speeding behavior (SAE International Citation2021). Adaptive Cruise Control (ACC) is an SAE Level 1 driver support feature that can maintain a set vehicle speed and, in the presence of a slower moving lead vehicle, can adjust the speed to maintain time headway. Partial-automation systems, such as Volvo’s Pilot Assist (PA), combine ACC with a lane centering feature that can control the vehicle’s lateral position and keep the vehicle within the travel lane. As partial-automation features are relatively new, there is limited information on how drivers use these systems and the effect that these systems have on driver behaviors such as speeding.
Monfort et al. (Citation2022), examined driver speeding behavior in Volvo S90 and Land Rover Evoque vehicles with partial-automation systems. In their study, Monfort et al. (Citation2022), defined speeding as any event in which the driver was traveling over the speed limit and examined the prevalence of speeding behavior during manual driving and when driving with ACC and PA. They found that drivers were more likely to speed when using ACC compared to when driving manually and that drivers tended to speed with higher magnitude when using ACC (Monfort et al. Citation2022).
The current study seeks to characterize real-world speeding behaviors when driving with and without partial-automation by identifying relevant speeding features and classifying them into types of speeding behaviors. Knowledge of these types of behaviors is important for understanding why and how drivers are speeding and can support the design of automation systems and features that mitigate risky speeding behaviors.
Methods
This study used a combination of supervised and unsupervised data analysis techniques to assess relevant factors in speeding behavior and classify them. First, we used Dynamic Time Warping (DTW) to characterize speed-exceedance profiles over time. We then conducted multivariate modeling to discern measures that characterize speeding epochs, such as duration of the speeding event. Finally, we utilized the measures that were found significant to cluster the speeding epochs and provide context as to the type of observed speeding behavior.
Data source
This study utilized data from the MIT Advanced Vehicle Technology (AVT) Naturalistic Driving Study which is an ongoing data collection effort of real-world driving. The current analysis used data from 15 drivers (5 F, 10 M) who drove a Volvo S90 for a one-month period (Seaman et al. Citation2022). Drivers ranged from 21 to 62 years of age with a mean age of 43 years old (sd 13.6 years) and most (13/15) had not previously driven a vehicle with Adaptive Cruise Control (ACC) or similar technology. Drivers had to be licensed, commute in the greater Boston metro area, and complete 1.5 h of training which included on-road training with the partial-automation systems. The Volvos used in this study were equipped with ACC and Pilot Assist (PA). Each vehicle was instrumented with RIDER (Real-time Intelligent Driving Environment Recording), a custom data acquisition system, that was used to collect four camera views, GPS, vehicle speed, and vehicle acceleration at 30 Hz (Fridman et al. Citation2019). Computer vision was then used to identify the automation state from video footage of the instrument panel at 30 fps. In the case where the computer vision output was inconclusive, experienced human annotators manually labeled the automation state from the video footage.
Data reduction
To examine speeding behavior with and without automation engaged we first filtered the data to ensure similar speeding conditions. Both ACC and PA are designed to function on motorways, and as such we limited the analysis to driving segments, or epochs, that occurred on motorways. We also controlled for the opportunity to speed by only examining free-flow epochs. Free-flow epochs were defined as driving segments in which the driver was traveling within 5 mph of the speed limit or greater for at least 30 s (Richard et al. Citation2013, Citation2020; Monfort et al. Citation2022). While there are many different speeding definitions that have been used in literature (Richard et al. Citation2013; Perez et al. Citation2021), in this study we defined speeding epochs as segments in which the driver was traveling at least 5 mph over the speed limit for a minimum duration of 3 s. For more details on the selection of the speeding threshold see Haus et al. (Citation2022).
Trips in which the automation state was unknown for more than 85% of the trip were removed from the analysis (n = 141 trips). Additionally, speeding epochs in which the speed limit was less than 45 mph (n = 312 epochs), or in which there was a change of speed limit (n = 35 epochs), or when the primary driving state was not manual, ACC or PA (n = 54 epochs) were excluded. The final dataset consisted of 3,413 speeding epochs. For each epoch we calculated the following features: (i) duration: the length of the epoch in seconds, (ii) mean speed magnitude: the mean speed over the epoch minus the speed limit; (iii) maximum speed magnitude: the maximum speed over the epoch minus the speed limit; and (iv) standard deviation of speed over the epoch length.
Statistical analysis
Dynamic time warping (DTW)
We clustered the speeding epoch profiles with DTW distance using the “dtwclust” R package (Sardá-Espinosa Citation2017). We used partitional clustering to group the time series data into four unique speed profiles. The optimal number of speeding profile clusters minimized the number of clusters while maximizing the distinctness between cluster medoids.
While DTW can handle time series data with different lengths, it is more efficient if the length is similar (Sardá-Espinosa Citation2017). As such, the DTW analysis examined the first 2 min of the speeding epochs which captured 90% of the full speeding data. If a speeding epoch was shorter than 2 min, we assigned the remaining time series data a value at the speeding threshold. To further prepare the data for DTW, we used time series decomposition to remove noise and then down sampled the data to 3 Hz. Speed profiles were normalized by the speed limit, resulting in the speed differential above the speed limit referred to as the speed-exceedance. We used the original data to calculate speeding magnitude, duration, and speed variability features to provide context to each of the identified DTW speed-exceedance profiles.
Multivariable modeling
Multivariate models were used to evaluate the associations between the different features of speeding epochs, such as speeding duration and magnitude. The final models are shown in EquationEqs. (1)–(4) in which was the epoch length in seconds,
was the mean speed magnitude in mph,
was the maximum speed magnitude in mph,
was the standard deviation of the speed magnitude,
was the identifier from the DTW speed-exceedance profiles (1–4),
was grouped into 45–50 mph, 55–60 mph, and 65–70 mph bins,
and
were the proportion of the epoch in which ACC or PA was used. Study week (ordered, 1–5), driver gender (M, F), and driver age were also evaluated, but were excluded based on forward and backward model selection as they were not found to be significant predictors. All models had random intercepts controlling for the driver and trip.
(1)
(1)
(2)
(2)
(3)
(3)
(4)
(4)
Gower dissimilarity cluster analysis
Gower distance approximation was used to calculate a multidimensional dissimilarity measure between speeding epochs which was then clustered using the Partitioning Around Medoids (PAM) algorithm. A Gower distance approximation was used because it can handle mixed data (quantitative and categorical). Speeding epochs were clustered into 8 clusters based on the significant features identified in the multivariable modeling described above. The number of clusters was selected using Silhouette width (Rousseeuw Citation1987) and Dunn Index (Dunn Citation1973) as measures of cluster separation. The differences between the manual and partial-automation clusters were evaluated using linear mixed-models with driver and trip as random effects (intercept only).
Results
Overall, drivers in this study were more likely to use PA during free-flow driving on motorways and spent more time driving with PA than driving with ACC and manually, combined. When accounting for driving exposure in each driving mode (manual, ACC, and PA), drivers were more likely to speed when using ACC and PA. Speeding with partial-automation (ACC and PA) tended to have longer durations, but lower magnitude than in manual driving (Haus et al. Citation2022).
Speeding epoch duration ranged from 3 s to 26 min with a mean duration of 77.7 s (SD 120 s). Overall, when considering only speeding in free-flow traffic on motorways, drivers used PA 56% of the time, compared to 16% with ACC and 26% when driving manually.
shows the medoid of each of the DTW speed-exceedance profiles and describes the distribution of speeding features across the epochs in each of the profiles. Speed-exceedance profile 1 was characterized by longer speeding durations, relatively high mean speeding magnitudes (11.4 mph), and multiple instances of acceleration that maybe consistent with the performance of a driving maneuver. Epochs within speed-exceedance profile 2 were characterized by the highest variability in speed, with about 1-min mean duration. Speed-exceedance profile 3 was characterized by lower mean and maximum speed magnitudes and lower standard deviations of speed compared to speed-exceedance profiles 1 or 2. Finally, speed-exceedance profile 4 was characterized by the shortest duration, lowest mean and maximum speeding magnitude, and lowest standard deviation of speed.
Figure 1. DTW speeding-exceedance profile medoids.
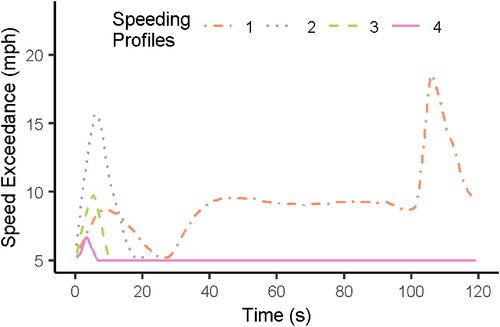
Table 1. Distribution of speeding parameters by speed-exceedance profile and for the overall data.
We then used multivariable models to evaluate the associations between different features that characterized speeding behavior including: speed-exceedance profiles, speed duration, mean speed magnitude, maximum speed magnitude, and standard deviation of the speed magnitude (summarized in ). Speeding duration was longer as the speed limit increased and with increased maximum speed magnitude. Standard deviation of speed was negatively associated with speeding duration and positively associated with maximum speeding magnitude. Speed-exceedance profiles 2, 3, and 4 were associated with shorter durations than profile 1. Mean speed magnitude was lower for speed-exceedance profiles 2,3, and 4, and in higher speed limits. Automation use (driving with ACC and PA) was associated with lower maximum speed magnitude and higher speeding duration. Time in the study, gender, and age were not found to be associated with the features we examined.
Table 2. Multivariable model estimates for dependent variables: duration, mean speeding magnitude, max speeding magnitude, and standard deviation of speeding.
A Gower dissimilarity matrix was calculated based on the features identified in the multivariable models and then clustered using PAM. Overall, as summarized in and , there was a good separation between the clusters within and across automation levels (silhouette width = 0.7, Dunn Index = 0.05). Speeding epochs in which the primary driving state was partial-automation (ACC or PA) were assigned to the same clusters and these clusters were distinct from the manual driving clusters. As such, hereafter the speeding clusters with ACC and PA will be collectively referred to as “partially-automated”.
Figure 2. Distribution of clusters across primary driving state (Manual, PA, ACC), duration, and mean speed magnitude.
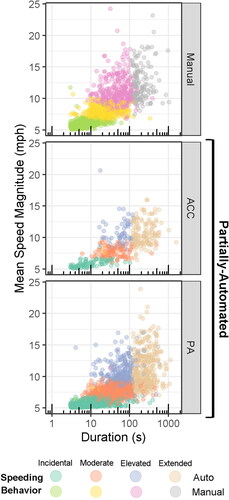
Table 3. Distribution of speeding parameters, speed limit, and automation use by cluster.
Four clusters were identified within both the partially-automated and manual speeding epochs which we labeled as: Incidental, Moderate, Elevated, and Extended speeding behaviors. Incidental speeding, was characterized by very short speeding durations and low speeding magnitudes with a mean duration of less than 17 s and mean magnitude under 6 mph for both partially-automated and manual driving. Findings indicate that the speeding epochs classified as Incidental were 7.6 s [4.9 − 10.4, p < 0.001] longer with partial-automation than in manual driving. The epochs in the Moderate speeding clusters had a mean magnitude interquartile range of 7.1–8.4 mph and were characterized by relatively short durations. Moderate speeding durations in partially-automated epochs were on average twice as long, 26 s longer [20.1 − 32.1, p < 0.001], as moderate speeding in manual driving (27 s). Elevated speeding was characterized by longer durations and higher magnitudes compared to Incidental and Moderate speeding behaviors. We found that Elevated speeding was more prevalent during manual driving (24% compared to 14%) and had slightly higher mean and max speeding magnitudes than Elevated speeding with partial-automation. Finally, extended speeding behavior was characterized by similar mean magnitudes, but over four times the mean duration of the elevated speeding group. While Extended speeding was more prevalent with partial-automation, Extended speeding in manual driving had a significantly higher mean, 1.7 mph [1.2 − 2.3 mph, p < 0.001], and maximum speeding magnitude, 4.5 mph [3.5 − 5.4 mph, p < 0.001].
Discussion
This study used real-world driving data from automation equipped vehicles to further understand speeding behaviors with and without partial-automation use. The observed speeding patterns were mapped into four distinct clusters with similar spatial relationships in both manual and automated driving. Thus, automation did not eliminate or introduce new types of speeding behaviors, but rather modified the characteristics of the observed behaviors. The identified speeding behaviors in partially-automated and manual driving were similar to the behaviors described by Richard et al. (Citation2013). Both studies observed an incidental, an intermediate, a more extreme, and a longer duration speeding behavior pattern. Although, Richard et al. (Citation2013) did not evaluate the use of automation systems, they hypothesized that the cruising speeding behavior they observed, characterized by long durations and consistent speeding, may have been related to the use of standard cruise control. In the current study, the speeding behaviors when using partial-automation tended to have longer durations, lower maximum speeds, and smaller standard deviations compared to speeding in manual driving. We found that Incidental and Moderate speeding with partial-automation had a mean duration approximately twice that of manual driving which is consistent with the nature of partially-automated speed management. Elevated speeding was more common during manual driving, while Extended speeding was more common during partial-automation use. Extended speeding epochs using partial-automation tended to have lower speed magnitudes possibly indicating a moderating effect of the automation, especially during longer duration speeding events. These findings may explain why previous work has linked automation use with increased speeding prevalence (Haus et al. Citation2022; Monfort et al. Citation2022).
While longer speeding durations and higher magnitudes are both related to increased crash likelihood and injury severity, these relationships may be more complex when considering the use of partial-automation. For example, extended speeding with partial-automation had a large proportion of epochs with lower magnitude and less variable speeding behavior compared to manual driving, indicating that partial-automation may mediate some of the risk during long speeding epochs. On the other hand, some studies have observed that automation use is associated with greater secondary task engagement and longer glances away from the road (Gershon et al. Citation2022). This, coupled with speeding, could impose a safety concern, especially if the driver is required to quickly shift from a supervisory role to manual driving, as the higher driving speed would give the driver less time to react. Future work should examine the prevalence of safety critical events with and without partial-automation to assess whether the increase in speeding duration with automation may relate to increased risk.
This study specifically examined speeding behaviors that occurred on motorways, and at the posted speed limits of 45 mph and greater. The focus on motorway driving restricted the analysis to areas in which PA was within its operational design domain (S90 Owner’s Manual Citation2016). ACC was available at speeds up to 125 mph whereas PA’s lane centering feature was only available up to 87 mph. At higher speeds, PA essentially has the same functionality as ACC (S90 Owner’s Manual Citation2016). Analysis of these automation modes did not reveal differences between speeding behaviors when primarily speeding with PA or ACC. One possible explanation is that while using partial-automation, ACC or PA, the speeding behaviors were effectively controlled by the same mechanism (i.e., ACC) as PA is a combination of ACC and lane centering features. The definition of free-flow used in this study may have underestimated free-flow epochs when drivers were traveling near or around the free-flow threshold. This may have skewed the data away from highly variable driving epochs and potential aggressive speeding in which drivers were accelerating and decelerating quickly among slower moving traffic. This definition may also have excluded driving segments during adverse weather where drivers may have been traveling slower than the speed limit, but too fast for the conditions. Future work would benefit from examining how factors such as the speeding environment and driver attitudes toward speeding may shed light on the motivations to speed.
As highly automated vehicles become more common, it is important to understand how automation use may affect risky behaviors, such as speeding, to support the development of appropriate mitigation strategies. In the EU, Intelligent Speed Assistance (ISA) systems that inform the driver of the speed limit and, in some cases, act as a speed limiter are currently required in all new model vehicles (European Parliament Citation2019). In the US, ISAs are not required, but vehicles on the road today are being equipped with advanced technology designed to assist drivers in speed selection (for example, Ford Motor Corporation Citation2021 and Tesla Citation2022).
This study provides evidence to changes in speeding behavior when using partial-automation and highlights the need for mitigation strategies that address both speeding magnitude and speeding duration. The design of systems that mitigate risky speeding behaviors should consider both manual and automated driving and may require mitigation strategies specific to each driving state.
Data availability statement
Data are AVT proprietary and at this time of writing is not publicly available.
Additional information
Funding
References
- Aarts L, van Schagen I. 2006. Driving speed and the risk of road crashes: a review. Accid Anal Prev. 38(2):215–224. doi:10.1016/j.aap.2005.07.004
- Ankem G, Gorman T, Klauer C, Ehsani JP, Simons-Morton B, Gershon P, Dingus T. 2018. An objective evaluation of novice teen driver speeding behavior [accessed 2022 Mar 11]. https://trid.trb.org/view/1495642..
- Dunn JC. 1973. A fuzzy relative of the ISODATA process and its use in detecting compact well-separated clusters. J Cybernet. 3(3):32–57. doi:10.1080/01969727308546046
- European Parliament 2019. Regulation 2019/2144 - Type-approval requirements for motor vehicles and their trailers, and systems, components and separate technical units intended for such vehicles, as regards their general safety and the protection of vehicle occupants and vulnerable road users - EU monitor [accessed 2022 May 17]. https://www.eumonitor.eu/9353000/1/j9vvik7m1c3gyxp/vl4j8yycs6xo.
- Ford Motor Corporation 2021. Ford Mustang Mach-E Owner’s Manual 2021.
- Fridman L, Brown DE, Glazer M, Angell W, Dodd S, Jenik B, Terwilliger J, Patsekin A, Kindelsberger J, Ding L, et al. 2019. MIT advanced vehicle technology study: large-scale naturalistic driving study of driver behavior and interaction with automation. IEEE Access. 7:102021–102038. doi:10.1109/ACCESS.2019.2926040
- Gershon P, Mehler B, Reimer B, Coughlin J. 2022. Driver distraction and inattention when using partial-automation. In: Driver Distraction and Inattention, Gothenburg, Sweden.
- Haus SH, Gershon P, Mehler B, Reimer B. 2022. Speeding behavior when using automation: a descriptive analysis of naturalistic driving data. Atlanta, GA.
- Kar IN, Guillaume C, Sita KR, Gershon P, Simons-Morton BG. 2018. U.S. adolescent street racing and other risky driving behaviors. J Adolesc Health. 62(5):626–629. doi:10.1016/j.jadohealth.2018.01.006
- Monfort SS, Reagan IJ, Cicchino JB, Hu W, Gershon P, Mehler B, Reimer B. 2022. Speeding behavior while using adaptive cruise control and lane centering in free flow traffic. Traffic Inj Prev. 23(2):85–90. doi:10.1080/15389588.2021.2013476
- National Center for Statistics and Analysis 2021. Speeding: 2019 data. Washington, DC: National Highway Traffic Safety Administration [accessed 2021 Nov 22]. https://crashstats.nhtsa.dot.gov/Api/Public/ViewPublication/813194.
- Perez MA, Sears E, Valente JT, Huang W, Sudweeks J. 2021. Factors modifying the likelihood of speeding behaviors based on naturalistic driving data. Accid Anal Prev. 159:106267. doi:10.1016/j.aap.2021.106267
- Richard CM, Campbell JL, Brown JL, Lichty MG, Chrysler ST, Atkins R. 2013. Investigating speeding behavior with naturalistic approaches: methodological lessons learned. Transport Res Rec. 2365(1):58–65. doi:10.3141/2365-08
- Richard CM, Divekar G, Brown JL. 2016. Motivations for speeding - additional data analysis. Washington, DC: National Highway Traffic Safety Administration. p. 117.
- Richard CM, Lee J, Atkins R, Brown JL. 2020. Using SHRP2 naturalistic driving data to examine driver speeding behavior. J Safety Res. 73:271–281. doi:10.1016/j.jsr.2020.03.008
- Roidl E, Frehse B, Höger R. 2014. Emotional states of drivers and the impact on speed, acceleration and traffic violations—a simulator study. Accid Anal Prev. 70:282–292. doi:10.1016/j.aap.2014.04.010
- Rousseeuw PJ. 1987. Silhouettes: a graphical aid to the interpretation and validation of cluster analysis. J Comput Appl Math. 20:53–65. doi:10.1016/0377-0427(87)90125-7
- S90 Owner’s Manual 2016. [accessed 2022 Apr 29] https://az685612.vo.msecnd.net/pdfs/3ff699a21a6850bba6a724a05464cdfd747a8dac/S90_OwnersManual_MY17_en-GB_TP22280.pdf.
- SAE International. 2021. Taxonomy and definitions for terms related to driving automation systems for on-road motor vehicles. Warrendale, PA: SAE International. doi:10.4271/J3016_202104
- Sardá-Espinosa A. 2017. Comparing time-series clustering algorithms in R using the dtwclust package. p. 45. https://rdrr.io/cran/dtwclust/f/inst/doc/dtwclust.pdf
- Schroeder P, Kostyniuk L, Mack M. 2013. 2011 National Survey of Speeding Attitudes and Behaviors. National Highway Traffic Safety Administration. https://www.nhtsa.gov/sites/nhtsa.gov/files/2011_n_survey_of_speeding_attitudes_and_behaviors_811865.pdf.
- Seaman S, Gershon P, Angell L, Mehler B, Reimer B. 2022. Evaluating the associations between forward collision warning severity and driving context. Safety. 8(1):5. doi:10.3390/safety8010005
- Simons-Morton BG, Ehsani JP, Gershon P, Klauer SG, Dingus TA. 2017. Teen driving risk and prevention: naturalistic driving research contributions and challenges. Safety. 3(4):29. doi:10.3390/safety3040029
- Simons-Morton BG, Ouimet MC, Chen R, Klauer SG, Lee SE, Wang J, Dingus TA. 2012. Peer influence predicts speeding prevalence among teenage drivers. J Safety Res. 43(5-6):397–403. doi:10.1016/j.jsr.2012.10.002
- Tesla 2022. Model 3 Owner’s Manual [accessed 2022 May 17]. https://www.tesla.com/ownersmanual/model3/en_us/GUID-5D3D4014-4E98-45D7-8BBC-F76BCA9CEC05.html.