
 ?Mathematical formulae have been encoded as MathML and are displayed in this HTML version using MathJax in order to improve their display. Uncheck the box to turn MathJax off. This feature requires Javascript. Click on a formula to zoom.
Abstract
Objective
This paper characterizes the actions of pedestrian-driver dyads by examining their interdependence across intersection types (e.g., zebra crossings, stop signs). Additionally, the analysis of interdependence captures other external factors, such as other vehicles or pedestrians, that may influence the interaction.
Methods
A 228 epoch vehicle-pedestrian interaction dataset was extracted from a large naturalistic driving data collection effort, which included vehicle, pedestrian, and contextual information (e.g., intersection type, jaywalking, vehicle maneuver, and lead vehicle presence). An expanded Actor-Partner Interdependence Model (APIM) was used to analyze driver-pedestrian dyads using driver and pedestrian standard deviations of velocity as the independent variables and wait times as dependent variables. APIM structural equation models were augmented to include driver effects (i.e., lead vehicle and maneuver type) and pedestrian effects (i.e., lead pedestrian, crossing group size, crossing direction).
Results
The level of protection afforded by an intersection had an effect on the extent of driver-pedestrian dyadic behavior. Interactions in undesignated crossings (i.e., jaywalking) were associated with interdependent behavior whereas interactions in designated crossings (i.e., crosswalks and parking lots) showed a partner effect on the driver’s wait time but no significant corresponding partner effect on the pedestrian. Finally, protected intersection interactions (i.e., traffic lights and stop signs) demonstrated no significant partner effects.
Conclusions
The difference in behavior patterns associated with the intersection type and level of protection shows that context can mediate the level of negotiation required between drivers and pedestrians. These findings inform how context and driver-pedestrian interactions should be incorporated in future modeling efforts which may, ultimately, support design of automated systems that are able to interact more safely, efficiently, and socially.
Introduction and background
Negotiating right-of-way between drivers and pedestrians can be a complex social dilemma. This negotiation occurs when drivers and pedestrians determine “the order of access to some shared region of space” (Markkula et al. Citation2020). Drivers and pedestrians have competing motivations, each preferring stable speeds and minimum delay (Katz et al. Citation1975). However, understanding the way road users reconcile these competing motivations is far from simple. To add to the complexity, this interaction is not entirely competitive, as both drivers and pedestrians have a shared motivation to act in a way that avoids safety critical outcomes, such as collisions. This dilemma is exacerbated by the inherent vulnerability of pedestrians compared to drivers. There were 6,205 pedestrian fatalities in the U.S. in 2019 due to traffic crashes–17.2% of all crash fatalities (NHTSA. Citation2021). And misjudgment of the situation due to missed observations or unexpected behavior have been found to be contributing factors in safety critical incidents between drivers and pedestrians at intersections (Habibovic et al. Citation2013). Significant improvements to the safety of driver-pedestrian interactions can come from development of systems that mitigate these missed observations and unexpected behaviors while considering the roadway environment.
In addition to miscommunication, another safety consideration in driver-pedestrian interactions is the roadway environment. Prior work found improved surrogate safety measures (e.g., longer time to crossing and lower deceleration required to stop) associated with driver yielding behavior and pedestrian crossing decisions in crossings protected by stop signs compared to crossings without stop signs or traffic signals (Fu et al. Citation2018). Crossings without traffic signals were also associated with a lower prevalence of some safe pedestrian crossing behaviors–e.g., looking at traffic while crossing and waiting for traffic to stop–compared to signalized crossings (Hatfield and Murphy Citation2007). As autonomous agents are substituted for human actors, effective encoding of human behavior to guide interactions will become necessary to ensure driver and pedestrian safety and achieve a comfortable and efficient automated mobility system.
Interaction between road users involves road users’ conveyance of information about their position, trajectory, timing, intended actions, or other social messages like gratitude or anger (Markkula et al. Citation2020). While this communication can be explicit–e.g., hand signals or honking–the majority of communication between drivers and pedestrians is implicit (Lee et al. Citation2021), which arises as drivers use action as a form of communication (Domeyer et al. Citation2020). Considering the effect of action which signals information to the partner, and the effect of action which achieves the goal of the actor to minimize delay (Markkula et al. Citation2020), leads to modeling driver-pedestrian encounter outcomes as interdependent with respect to the actions of each other. The actions of drivers and pedestrians are additionally impacted by the roadway and infrastructure, including signals, signs, and markings. This car-driver-roads-infrastructure system can be described as a joint cognitive system where the roadway, infrastructure, and other external features represent artifacts influencing the behavior of the actors to achieve the antientropic ends of the system as a whole (Hollnagel and Woods Citation2005).
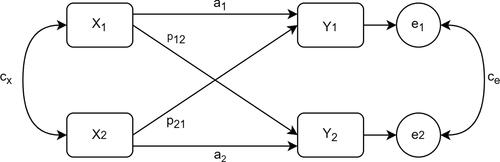
Simple linear models that do not consider actors’ mutual influence on each other are not sufficient in measuring the interconnected behavior of drivers and pedestrians. The actor-partner interdependence model (APIM) resolves this limitation by simultaneously estimating actor and partner effects to make inferences about interdependence (Cook and Kenny Citation2005; Kenny and Cook Citation1999). A structural equation model (SEM) of the APIM is shown in . Square elements represent observed variables and circle elements are latent variables. One-directional straight arrows are SEM path effects and two-directional curved arrows represent correlations between variables. The APIM provides a way to estimate the degree to which an actor’s independent variable behavior affects a dependent behavior (X1 →Y1 or X2 →Y2) – the so-called actor effects (a1, a2) – while also accounting for the influence an actor’s independent variable on the partners dependent variable (X1 →Y2 or X2 →Y1) which are the partner effects (p12, p21). Additionally, the model can account for correlation between the independent variables (cx), which may be due to shared attributes of the independent variables beyond random chance, and correlations in the error residuals of the dependent variable (ce), which may be the result of non-independence of Y1 and Y2 not accounted for by the predictors of the model (Fitzpatrick et al. Citation2016).
This paper characterizes the actions of pedestrian-driver dyads by examining their interdependence across intersection types (e.g., zebra crossings, stop signs). Additionally, the analysis of interdependence captures other external factors, such as other vehicles or pedestrians that may influence the interaction. We build upon previous work that identified how initial conditions of interactions lead to interdependencies between drivers and pedestrians (Domeyer et al. Citation2022). The previous analysis revealed that drivers and pedestrians were interdependent in “unprotected” zebra crossings but did not find evidence for “non-intersections” or “stop signs.” We extend this analysis by using a feature that captures the dynamics of the interaction, the standard deviation of speed, rather than the initial conditions to evaluate the interdependence afforded by different intersection types. This analysis contributes to a detailed understanding of the complex decision-making required to negotiate mixed-traffic environments in assisted and automated vehicles.
Figure 1. A structural equation model (SEM) representation of the basic actorpartner interdependence model (APIM).
Methods
This study used a vehicle-pedestrian encounter dataset developed as a subset of the ongoing MIT AgeLab Advanced Vehicle Technology (MIT-AVT) naturalistic driving study (Fridman et al. Citation2019). This dataset is comprised of real-world interactions between drivers and pedestrians collected naturalistically that captured a variety of intersection types, pedestrians, and other environmental factors as they occurred. The dataset included data collected from drivers driving either sedan or compact SUV vehicles in the Northeastern US over periods ranging from 6 months to several years. Vehicles did not have active automation for the vehicle-pedestrian encounters in this analysis. Vehicles were equipped with 720p 30 Hz cameras with a 78° diagonal field of view: forward-facing to capture the roadway (and, in this case, pedestrian encounters) and driver-facing to capture driver behavior. Vehicle CAN data was used to obtain vehicle state information including speed, GPS data provided information about vehicle position, and IMU data provided information on vehicle kinematics. A series of steps were undergone to reduce the full MIT-AVT dataset to the pedestrian-encounter dataset (Terwilliger et al. Citation2019). First, a kinematic filter selected for driving segments of driving under 50 mph. Then potential pedestrian interactions were identified using the YOLO v3 object detection algorithm (Redmon et al. Citation2016) to detect instances where pedestrians appeared in the middle of the frame of the forward-facing camera (i.e., were crossing the path of the vehicle). These instances were then filtered manually and the final reduced dataset consisted of interactions where: pedestrians crossed the path of the vehicle in groups of less than five, pedestrians were visible at the time they entered the vehicle’s path, there was no other lead vehicle between the subject vehicle and the crossing pedestrian, and the vehicle was moving at some point before the pedestrian finished crossing. Example frames from three interactions are shown in .
Figure 2. Examples of driver-pedestrian interactions at a protected intersection with a stop sign (top), a designated crossing (middle), and undesignated crossing (bottom).
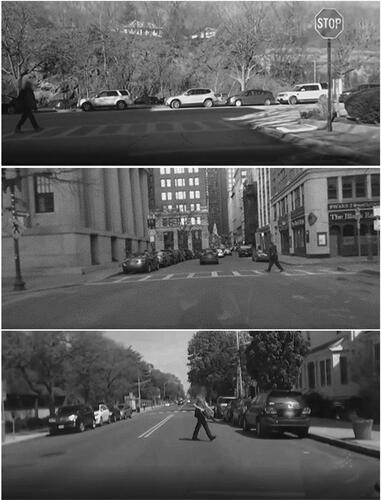
Additional manual annotation was conducted to code the following: (a) pedestrian movement (walking, pausing, or standing), (b) points in time at which the pedestrian is visible, enters the vehicle’s path, exits the vehicle’s path, and is no longer visible, (c) time at which the subject vehicle enters the path of the pedestrian, (d) pedestrian travel direction, (e) number of pedestrians crossing together, (f) presence of a lead pedestrian crossing ahead of the subject pedestrian, (g) presence of a lead vehicle prior to the pedestrian entering the roadway, (h) vehicle maneuver left, right, or straight immediately prior to or during the encounter (e.g., a pedestrian crossing at a crosswalk after a left turn would be coded as left turn but a vehicle traveling straight and then stopping at a stop sign waiting for a pedestrian was coded as straight even if the vehicle then turned right or left after the encounter), (i) the presence of a blocker (i.e., anything between the vehicle and the pedestrian during the crossing that could impede the path of the subject vehicle such as a crossing vehicle), and (j) level of intersection protection: protected, designated, and undesignated. Protected crossings were encounters that occurred when the vehicle was approaching a stop sign or traffic light (see example in ). Designated crossings were encounters that occurred while the pedestrian was crossing in a space designed for pedestrian crossings but not offering any other level of protection including crosswalks (with or without accompanying pedestrian lights but no other traffic signals) and parking lots. Undesignated crossings occurred when the pedestrian was crossing at a point not appropriated for pedestrians either through an intersection or across a roadway. There was a total of 228 vehicle-pedestrian encounters: 52 protected, 111 designated, and 65 undesignated crossings.
For the APIM model, the independent variable used for both drivers and pedestrians was standard deviation of speed. This is a single metric related both to the actors’ behavior performed to achieve their goal of minimizing delay and the kinematic variation used to communicate and negotiate with their partners. For the driver, the standard deviation was calculated from the CAN speed data from the point when the pedestrian is first visible until the time at which the pedestrian has exited the path of the vehicle. For the pedestrians, the speed was estimated by assuming a constant walking speed and zero speed while pausing or standing. The walking speed for each pedestrian was then estimated by assuming a 3.66 m (12 feet) vehicle path width estimate–the upper bound of most US roadway lane widths (American Association of State Highway and Transportation Officials 2001) (EquationEq. (1)(1)
(1) ). Applying this walking speed to all frames where the pedestrian was walking, the standard deviation was then calculated from the speed from when the pedestrian was first visible until the pedestrian exited the vehicle path.
(1)
(1)
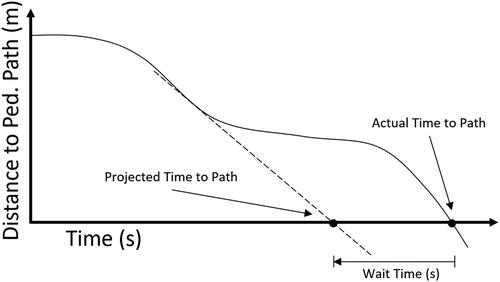
The dependent variable in the APIM model was wait time as it relates to the desired outcome for both drivers and pedestrians. The wait times were calculated differently for the vehicle and the pedestrian, but both calculations result in a metric for time lost due to waiting or yielding. For the vehicle, the projected time to intersection (TTI) was estimated at each time point by taking the current path distance between the driver and the pedestrian’s path divided by the current speed. The wait time was then calculated as the maximum difference between the projected TTI and the actual time until the vehicle crosses the pedestrian’s path (EquationEq. (2)(2)
(2) )
(2)
(2)
where
is the vehicle’s distance to the pedestrian’s path at time t,
is the vehicle’s speed at time t, and
is the actual time until the vehicle reaches the pedestrian’s path at time t. depicts the wait time calculation for an example vehicle trajectory. The wait time for the pedestrian was defined as the amount of time not walking from when the pedestrian was visible until the pedestrian exited the lane of the vehicle (EquationEq. (3)
(3)
(3) ).
(3)
(3)
Figure 3. An example vehicle trajectory demonstrating the calculation of vehicle wait time as the maximum difference between projected time to pedestrian path and actual time to pedestrian path.
In addition to the standard deviation of velocity (independent variable) and wait time (dependent variable), the APIM was augmented to include external effects on the vehicle variables (independent and dependent) and pedestrian variables (independent and dependent): lead vehicle presence (binary), blockers (binary), and maneuver type (categorical: left, right, straight) for the vehicle variables and lead pedestrian (binary), number of pedestrians (numerical), and direction of crossing (categorical: left-to-right or right-to-left) effects for the pedestrian variables. Furthermore, the analysis was grouped based on level of protection (protected, designated, and undesignated). The APIM was assessed via structural equation modeling (SEM) using the latent variable analysis (LAVAN) package in R (Rosseel Citation2012). Since the vehicle maneuver effect took on three categorical values, it was modeled as two binary dummy variables. Direction of crossing was coded as a binary in the model with “left-to-right” as the reference category. Model coefficients and correlations were estimated along with the introduced variables to estimate the differences between model parameters and to characterize the dyadic pattern (Fitzpatrick et al. Citation2016).
Results
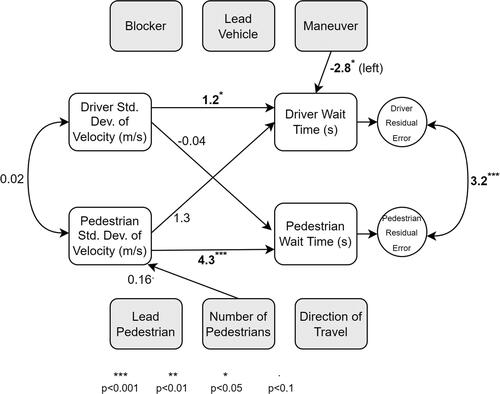
There were significant differences in driver-pedestrian interactions based on the level of intersection protection in the observed dyadic behavior pattern, the magnitude of behavior effects, and the influence of environmental factors. The estimated model parameters for the protected crossings (N = 52) are shown in . Both the driver and pedestrian have significant positive actor effects, meaning that greater standard deviation in velocity was associated with longer wait times. The mean driver wait time was 4.87 s and the mean pedestrian wait time was 1.11 sec. The driver actor effect estimate was 1.2, which indicates a 1 m/s increase in driver velocity standard deviation was associated with 1.2 seconds longer driver wait. The pedestrian actor effect was 4.3. Neither partner effect was statistically significant, suggesting that there was no interdependence between the standard deviation of velocity and wait times of the partners (drivers and pedestrians). This means that in protected crossings, drivers and pedestrians exhibit an actor-only dyadic pattern (i.e., there are no significant partner effects but the actor dependent variables are correlated to the actor independent variables). Standard deviations of velocity were not correlated, but the error residuals in the wait time estimates were correlated. The significant environmental factor was presence of a left turn maneuver which was associated with a 2.3 second decrease in driver wait time.
Figure 4. The expanded APIM for protected intersection driver-pedestrian interactions. The numbers represent the path coefficients (for one-directional straight arrows) and correlations (two-directional curved arrows) and superscripts notate significance with bolded values for statistically significant effects (p < 0.05).
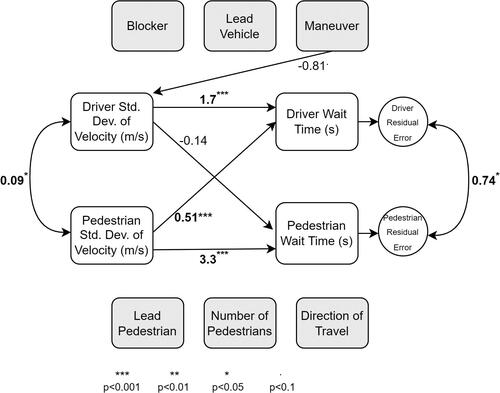
shows the model parameter estimates for designated crossings (N = 111). Like the previous model, designated crossings had significant positive actor effects with values of 1.7 and 3.3 for the driver and pedestrian respectively. Unlike the previous model, interactions in designated crossings demonstrated a significant partner effect from the pedestrian to the driver of 0.51. This means that variation in the pedestrians’ velocity was associated with longer wait times for the driver. The mean driver wait time was 5.02 s and mean pedestrian wait was 1.68 s. However, there was no statistically significant partner effect from the driver to the pedestrian. Also, both the standard deviation of velocity and error residuals in wait time estimates were correlated in designated crossing interactions. Therefore, in designated crossings, pedestrians were observed to follow an actor-only behavioral pattern, but drivers followed a couple-oriented behavioral pattern.
Figure 5. The expanded APIM for designated intersection driver-pedestrian interactions. The numbers represent the path coefficients (for one-directional straight arrows) and correlations (two-directional curved arrows) and superscripts notate significance with bolded values for statistically significant effects (p < 0.05).
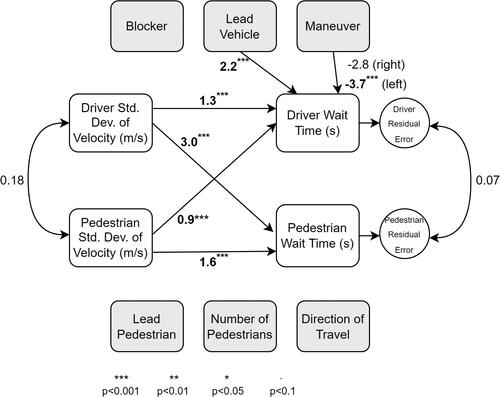
The model parameter estimates for undesignated crossings (N = 65) are shown in . Unlike the previous two models, vehicle-pedestrian encounters in undesignated intersections demonstrated significant partner and actor effects for both drivers – actor effect of 1.3 and partner effect of 0.9 – and pedestrians – actor effect of 1.6 and partner effect of 3.0. Therefore, both drivers and pedestrians were observed following couple-oriented dyadic behavior. Mean driver wait time was 4.0 s and mean pedestrian wait time was 1.95 s. Lead vehicle presence and left turn maneuvers were also associated with longer wait times of 2.2 seconds and 3.7 seconds, respectively. Standard deviations of velocity and wait time error residuals were not correlated in undesignated crossings.
Figure 6. The expanded APIM for undesignated intersection driver-pedestrian interactions. The numbers represent the path coefficients (for one-directional straight arrows) and correlations (two-directional curved arrows) and superscripts notate significance with bolded values for statistically significant effects (p < 0.05).
Discussion
Driver and pedestrian behavior were less interdependent when there was greater protection offered by the roadway infrastructure. The most regulated intersections–the protected intersections with stop signs and traffic lights–were associated with actor-only dyadic patterns. This is consistent with traffic infrastructure playing a role in mediating the negotiation between drivers and pedestrians. It is possible that road users are not required to communicate their intentions through kinematic behaviors because the expected behavior is dictated by the intersection environment. The actor-only pattern provides evidence that the driver and pedestrian kinematic behaviors are independent of one another in protected intersections.
The middle level of protection is the designated crossing. There is no traffic infrastructure specifically instructing the driver to stop, but the pedestrian is crossing at an appropriate location and the driver is required to yield if they observe the pedestrian’s intention to cross. What is interesting is that the designated crossings only had couple-oriented dyadic patterns for the drivers, but not the pedestrians. It is possible that the designated crossing informs the pedestrian’s decision-making, but this is not necessarily the case for the driver who needs to extract information from the pedestrian’s behavior to inform their own decisions. Future analysis of encounters in this intersection type may focus on the mechanism by which pedestrians convey information to drivers implicitly. A unique feature of the designated intersection model was the correlated standard deviation of velocity between driver and pedestrian. This may represent a compositional effect where encounters in certain intersections have longer or shorter waits for both drivers and pedestrians.
The undesignated crossing provides the least protection from the environment to the pedestrian. The observed couple-oriented behavior pattern for both drivers and pedestrians is, again, consistent with the hypothesis that the intersection infrastructure mediates the conflict since here in the absence of such a moderator, each actor’s wait time is associated with changes in the velocity of the other. This finding may inform future analyses of driver-pedestrian interaction as this interdependence could be appropriately modeled through game theory or other equilibrium-seeking modeling methods (Camara et al. Citation2018; Fox et al. Citation2018). The dominant partner effect from the driver to the pedestrian may even suggest a Stackelberg game could be appropriate as the driver could be viewed as the “leader” given the strong association the pedestrian’s wait time has on the driver’s velocity deviation (Yoo and Langari Citation2013). In addition, the undesignated intersection model was the only one without correlated error residuals which may be due to an undefined latent variable which also could be addressed in future modeling efforts. This analysis extends previous findings of Domeyer et al. (Citation2022) by revealing interdependence in undesignated crossings when using standard deviation of velocity rather than initial speed and distance. This may suggest that pedestrian-driver interdependence in these encounters develops over time and is not necessarily the sole result of the initial decision of the pedestrian.
Our findings suggest that drivers and pedestrians modulate their behavior given the context of the interaction. The design of automated features may need to account for the signaling characteristics of their kinematic behavior in unprotected and undesignated crossings, and less so in protected intersections.
There are some key limitations in this study. For one, due to the selection criteria, this dataset only contains instances of the subject vehicle yielding to a crossing pedestrian and no instances of a pedestrian yielding to the subject vehicle. Furthermore, this dataset is comprised of real-world naturalistic data which means there is inherent variation that comes with analyzing human behavior without experimental control. Additionally, it is difficult to draw strong conclusions from the differences in effect magnitudes as the velocities of vehicle and pedestrian were obtained through different methods. It is possible that some more subtle effects went undetected in this modeling due to the estimation of pedestrian velocity from video data. It is also difficult to draw strong conclusions about the actor-only behavior patterns as the absence of an observed partner effect does not mean there is no communication or even negotiation between drivers and pedestrians in encounters in protected intersections, just that velocity deviation is not associated with wait time in these encounters. The effects that were reported represent an average across all observed interactions and it is worth noting that these behaviors exist across a distribution. Future work may benefit from expanding the area of study to other parts of the US or other countries as some driver and pedestrian behaviors may be differ regionally or globally.
Safe interaction between drivers and pedestrians requires clear communication about intentions and actions. When drivers and pedestrians interact in space-sharing conflicts, it is difficult to determine when actions taken to change one’s trajectory are done to achieve a desired outcome or to communicate with other road users or both. Analyses of the joint behavior of drivers and pedestrians should consider how the environment may support or replace some of this negotiation by coordinating behaviors of the road users and mitigating the risks of miscommunication. This analysis provides nuanced models of road users (drivers and pedestrians) interactive behaviors which may support the design of safer and more effective advanced driver assistance systems, vehicle automation systems, and external human-machine interfaces that are able to interact more socially with pedestrians to increase roadway efficiency and reduce adverse outcomes.
Additional information
Funding
References
- American Association of State Highway and Transportation Officials. 2001. A policy on geometric design of highways and streets, 2001. 4th ed. Washington, DC: American Association of State Highway and Transportation Officials.
- Camara F, Romano R, Markkula G, Madigan R, Merat N, Fox C. 2018. Empirical game theory of pedestrian interaction for autonomous vehicles. Proc Measuring Behav. 2018:238–244.
- Cook WL, Kenny DA. 2005. The Actor–Partner Interdependence Model: a model of bidirectional effects in developmental studies. Int J Behav Dev. 29(2):101–109. doi:10.1080/01650250444000405
- Domeyer JE, Lee JD, Toyoda H. 2020. Vehicle automation–other road user communication and coordination: theory and mechanisms. IEEE Access. 8:19860–19872. doi:10.1109/ACCESS.2020.2969233
- Domeyer JE, Lee JD, Toyoda H, Mehler B, Reimer B. 2022. Interdependence in vehicle-pedestrian encounters and its implications for vehicle automation. IEEE Trans Intell Transport Syst. 23(5):4122–4113. doi:10.1109/TITS.2020.3041562
- Fitzpatrick J, Gareau A, Lafontaine M-F, Gaudreau P. 2016. How to use the actor-partner interdependence model (APIM) to estimate different dyadic patterns in MPLUS: a step-by-step tutorial. Quant Methods Psychol. 12(1):74–86. doi:10.20982/tqmp.12.1.p074
- Fox C, Camara F, Markkula G, Romano R, Madigan R, Merat N. 2018 Jan 26. When should the chicken cross the road? - Game theory for autonomous vehicle - human interactions. In: Proceedings of the 4th International Conference on Vehicle Technology and Intelligent Transport Systems. 4th International Conference on Vehicle Technology and Intelligent Transport Systems. doi:10.5220/0006765404310439
- Fridman L, Brown DE, Glazer M, Angell W, Dodd S, Jenik B, Terwilliger J, Patsekin A, Kindelsberger J, Ding L, et al. 2019. MIT advanced vehicle technology study: large-scale naturalistic driving study of driver behavior and interaction with automation. IEEE Access. 7(1):102021–102038. doi:10.1109/ACCESS.2019.2926040
- Fu T, Miranda-Moreno L, Saunier N. 2018. A novel framework to evaluate pedestrian safety at non-signalized locations. Accid Anal Prev. 111:23–33. doi:10.1016/j.aap.2017.11.015.
- Habibovic A, Tivesten E, Uchida N, Bärgman J, Ljung Aust M. 2013. Driver behavior in car-to-pedestrian incidents: An application of the Driving Reliability and Error Analysis Method (DREAM). Accid Anal Prev. 50:554–565. doi:10.1016/j.aap.2012.05.034.
- Hatfield J, Murphy S. 2007. The effects of mobile phone use on pedestrian crossing behaviour at signalised and unsignalised intersections. Accid Anal Prev. 39(1):197–205. doi:10.1016/j.aap.2006.07.001.
- Hollnagel E, Woods DD. 2005. Joint cognitive systems: Foundations of cognitive systems engineering. 1st ed. Boca Raton (FL): CRC Press. doi:10.1201/9781420038194.
- Katz A, Zaidel D, Elgrishi A. 1975. An experimental study of driver and pedestrian interaction during the crossing conflict. Hum Factors. 17(5):514–527. doi:10.1177/001872087501700510
- Kenny DA, Cook W. 1999. Partner effects in relationship research: conceptual issues, analytic difficulties, and illustrations. Pers Relat. 6(4):433–448. doi:10.1111/j.1475-6811.1999.tb00202.x
- Lee YM, Madigan R, Giles O, Garach-Morcillo L, Markkula G, Fox C, Camara F, Rothmueller M, Vendelbo-Larsen SA, Rasmussen PH, et al. 2021. Road users rarely use explicit communication when interacting in today’s traffic: Implications for automated vehicles. Cogn Tech Work. 23(2):367–380. doi:10.1007/s10111-020-00635-y
- Markkula G, Madigan R, Nathanael D, Portouli E, Lee YM, Dietrich A, Billington J, Schieben A, Merat N. 2020. Defining interactions: a conceptual framework for understanding interactive behaviour in human and automated road traffic. Theor Issues Ergon Sci. 21(6):728–752. doi:10.1080/1463922X.2020.1736686
- NHTSA. 2021. Traffic safety facts annual report. https://cdan.nhtsa.gov/tsftables/tsfar.htm#.
- Redmon J, Divvala S, Girshick R, Farhadi A. 2016. You only look once: unified, real-time object detection. In: Proceedings of the IEEE Conference on Computer Vision and Pattern Recognition. doi:10.48550/arXiv.1506.02640
- Rosseel Y. 2012. lavaan: an R package for structural equation modeling. J Stat Soft. 48(2):1–36. doi:10.18637/jss.v048.i02
- Terwilliger J, Glazer M, Schmidt H, Domeyer J, Toyoda H, Mehler B, Reimer B, Fridman L. 2019. Dynamics of pedestrian crossing decisions based on vehicle trajectories in large-scale simulated and real-world data. In: Proceedings of the 10th International Driving Symposium on Human Factors in Driver Assessment, Training, and Vehicle Design (pp. 64–70). Santa Fe, NM.
- Yoo JH, Langari R. 2013. Stackelberg game based model of highway driving. In: ASME 2012 5th Annual Dynamic Systems and Control Conference Joint with the JSME 2012 11th Motion and Vibration Conference. p. 499–508. doi:10.1115/DSCC2012-MOVIC2012-8703