
Introduction
Scenario-based testing
Scenario-based testing is being proposed as a method for evaluating the performance of an Automated Driving System (ADS). A scenario, in the driving context, is described as “a temporal sequence of scene elements, with actions and events of the participating elements occurring within this sequence” (Riedmaier et al. Citation2020). To evaluate an ADS, the ADS may be placed in a number of scenarios contained in a collection, or database. This database could include scenarios that represent nominal driving situations, reactions to critical events, or test the failsafe operation of an ADS.
The outcome of the scenarios, e.g., crash, no crash, or injury risk mitigation, is often heavily dependent on the evasive maneuvers taken by the actors in the scenario. To be able to evaluate the performance of an ADS using scenarios, those scenarios should represent a potential collision of sufficiently high severity so that the ability of the ADS to avoid an outcome involving possible serious injury can be assessed. For example, if a scenario database is composed of only scenarios with vehicles traveling at low speed in the same direction, then an assessment of an ADS’s ability to avoid serious injury collisions is not meaningful because there would be little possibility for a serious injury to occur regardless of the ADS’s performance. The objective of this study is to propose a method to estimate the probability of an injury outcome in a scenario, e.g., Maximum Abbreviated Injury Scale of 3 or greater, given the worst case of little or no evasive maneuvers before the collision. This injury potential can be used as a means for comparing scenario-based testing datasets to each other or to real-world crash data to determine the appropriateness of the scenario database.
Previous work
Victor et al. (2015, Chapter 8 and Appendix A) proposed several metrics (maximum severity delta velocity, MSDeltaV, model-estimated injury risk, MIR) that computed injury risk of conflicts assuming no reaction or reactions across a distribution (see also, Bärgman et al. Citation2015, Citation2017). The target crash mode under investigation in these studies was front-to-rear conflicts, and as such they used a simple inelastic collision model and closing speed to estimate delta-V assuming collinear collisions. Arun et al. (Citation2021) proposed combining an extreme value theory model with a severity measure, which also estimated potential delta-V in a collision using an inelastic collision model but also including relative headings. Laureshyn et al. (Citation2017) proposed using “extended delta-V” as a severity threshold method in a traffic conflict technique survey. The extended delta-V was computed using the same inelastic collision assumption as in the previously cited studies, but assuming some amount of brake maneuvering from each actor at the point of minimum spatio-temporal distance (point of minimum TTC).
The method presented in this paper aims to improve previous methods in three ways. First, we use a momentum-impulse based collision model instead of using an inelastic collision model for a more accurate estimation of delta-V and an estimation of the principal direction of force (PDOF). Second, we use a continuous injury risk function that can estimate injury risk over a full 360° of PDOF values, whereas previous studies used injury risk curves developed for a single impact direction. Third, we perform counterfactual simulations of the pre-crash trajectories to determine if small perturbations in acceleration or steering would have led to a collision. This counterfactual simulation is important because certain conflict geometries may lack a collision course assuming constant speed and heading, for example, straight crossing path conflicts where the actors may pass close to each other but never have a collision course.
Methods
To compute the maximum injury potential, the following properties of a scenario are required as input: the paths of the vehicles (position, heading, speed) as a function of time, the size of the vehicles (either in the form a bounding box or a contour representing their outline), and the inertial properties of the vehicle (mass, center of gravity, yaw moment of inertia). At each timestep of the scenario, counterfactual simulations are performed where each actor is assumed to either continue moving at constant speed, or given a small acceleration or steering input. If a collision occurs under the counterfactual kinematics, a momentum-impulse based collision model is used to estimate the delta-V and PDOF as a result of the collision. A continuous injury risk function is used to compute the probability of Maximum AIS 3 or greater (MAIS3+) for each vehicle. The maximum injury potential of the scenario is the maximum MAIS3+ probability for any of the counterfactuals. Each component of this method is discussed in more detail below.
Counterfactual simulations
At each instance in a scenario, the states of the actors are specified as a position (e.g., in a local cartesian reference plane), heading, velocity, and acceleration. The trajectories are then projected forward in time from their positions using one of the following assumptions for each actor separately: (a) constant velocity with no change in heading, (b) constant acceleration of +/- 0.1 g with no change in heading, and (c) a constant path curvature resulting from a +/- 0.1 g lateral acceleration with constant velocity. For (c), the curvature was set as a +/- 0.1 g lateral acceleration divided by the vehicle speed. Each of these assumptions was applied to each actor one at a time, while the other actor was assumed to continue at constant velocity and acceleration with no change in heading. The threshold of 0.1 g was selected as a moderate input, such as coasting after releasing the accelerator or a slight steering input. The counterfactual trajectories were limited to either 1.5 seconds or 145 m of either vehicle traveling.
Collision model
If the bounding boxes of the counterfactual trajectories intersected to produce a collision, a delta-V and PDOF were estimated using a momentum-impulse collision model described in Scanlon et al. (Citation2021). The turning vehicle in the left turn scenario was assumed to be a 2019 Chrysler Pacifica minivan with mass 2487 kg, yaw moment of inertia of 5799 kg m2, length of 4.8 m, and width of 2.14 m. The other vehicle was assumed to be a passenger vehicle with mass of 2016 kg, yaw moment of inertia of 4436 kg m2, length of 4.8 m, and width of 2.14 m or a heavy vehicle with mass of 3897 kg, yaw moment of inertia of 9807 kg m2, length of 7.0 m, width of 2.5 m.
Injury risk function
The continuous omni-direction injury risk model of McMurry et al. (Citation2021) was used to predict the probability of a MAIS3+ injury given the delta-V and PDOF of each actor. The statistical model was developed using real-world crash data for vehicle-to-vehicle, planar collisions. Unlike previous risk curves that are developed for specific impact directions (e.g., front, side), the construction of the model in McMurry et al. (Citation2021) provides a continuous estimate of injury risk for planar impacts of any direction, making it well suited for use in this injury potential metric.
Left turn scenario
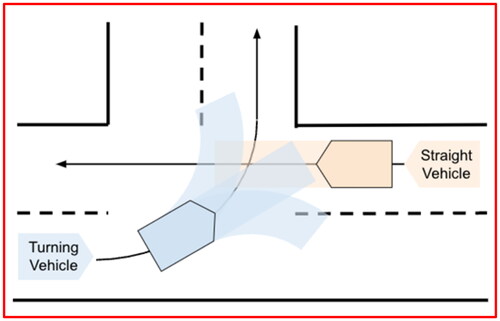
To illustrate the utility of this methodology, a left turn across path, opposite direction (LTAP/OD) scenario was constructed, as shown in . In this scenario, a turning vehicle follows a circular path at constant velocity. A straight traveling vehicle, also traveling at constant velocity, approaches the turning vehicle from the opposite direction. The road was modeled as an intersection of two two-lane roads where the vehicles travel in the middle of the lane approaching from opposite directions. The turn radius of the turning vehicle would then be 1.5 times the lane width. In a proposed left turn across path test scenario, Azeredo et al. (Citation2021) proposed that the initial lateral distance (measured from the side to side of the vehicles) should be 12 ft to 24 ft (3.66 m to 7.32 m). Assuming a vehicle width of 2.3 m, this means the effective lane width would need to be 5.96 m to 9.62 m. In this study, we used the average of this range, 7.79 m, which results in a 11.7 m (38.4 ft) turning radius. The trajectories of the vehicles were aligned such that the centers of their bounding boxes overlapped.
Figure 1. Left turn across path opposite direction scenario with visualization of counterfactual trajectories of turning vehicle.
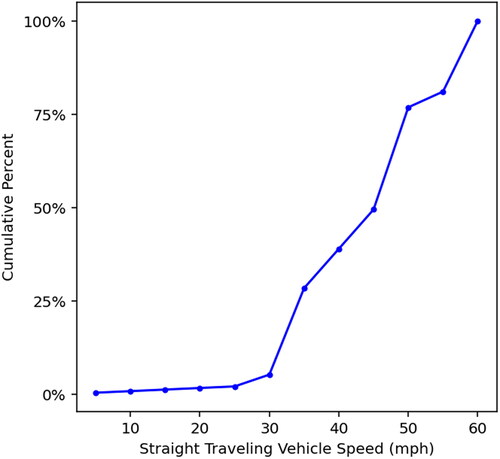
The speeds of the vehicles were parameterized using crash data. Najm et al. (Citation2013) provided a distribution of speeds of the straight traveling vehicle in LTAP/OD scenarios using EDRs from the National Automotive Sampling System, Crashworthiness Data System (NASS/CDS). The data in Appendix A.2.1 “LTAP/OD at signal” was used. The EDR pre-crash data at 3 seconds before the recorded event was used, as the distributions for 5, 4, and 3 seconds before the event seemed similar, suggesting most straight traveling vehicles were traveling at a constant speed before some evasive maneuver. This cumulative distribution was given for speeds of 5 mph to 60 mph and was reported using the NASS/CDS case weights, which is reproduced in . In the data in Najm et al. (Citation2013) the speeds of the turning vehicle varied, as some vehicles started from a stop, some slowed slightly (rolling stop), and others had no speed change. For this study we assumed the turning vehicle was traveling at a constant speed of 15 mph as reported in Table 23 of Stevens et al. (Citation2020).
Figure 2. Cumulative distribution of straight traveling vehicles in LTAP/OD collision at signalized intersections (Najm et al. Citation2013, Appendix A.2.1).
Results
shows the maximum injury potential in the LTAP/OD scenario parameterized using EDR data, where the different colored bars represent different assumptions about the straight traveling vehicle. First, the straight traveling vehicle was assumed to be a passenger vehicle (“Pass. Veh.”). In one version, a collision occurred (“Collision”). In another version, the turning vehicle applied the brakes at 0.6 g to come to a stop just short of the path of the straight traveling vehicle (“Avoidance”). This evasive maneuver results in what would be considered a near-crash, or close call, where there is no collision but the actors come close spatiotemporally. The maximum injury potential in avoidance version was on average −0.5% the collision version (0.4% standard deviation, maximum absolute difference of 1.3%). Although there is no actual collision in the “avoidance” case, the maximum injury potential metric predicts a probability of injury due to the counterfactual simulations resulting in a collision. The “collision” and “avoidance” scenarios have similar maximum injury potential because the counterfactual collisions with the maximum injury risk generally occur before the onset of the avoidance braking. This result suggests the metric is robust to evasive maneuvers in this scenario.
Figure 3. Maximum injury potential for parameterized LTAP/OD scenario with straight traveling vehicle as a passenger and heavy vehicle.
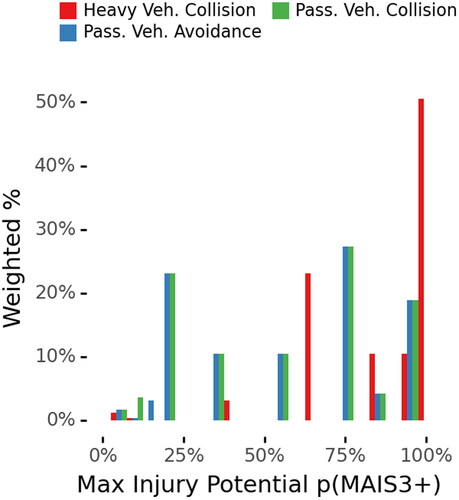
Another important determinant of injury potential is the mass of the colliding vehicles. The scenario was modified so that the straight traveling vehicle was a heavy truck. The “Heavy Veh. Collision” bars in shows the weighted distribution of maximum injury potential. For the heavy vehicle, the maximum injury potential is skewed toward the right compared to the straight traveling vehicle as a passenger vehicle, with all travel speeds above 45 mph resulting in over 95% probability of a MAIS3+ event.
Discussion
This type of maximum injury potential metric is potentially useful in quantifying the severity of proposed scenarios to evaluate ADS. One benefit of the metric that the results of this study illustrated is that the metric is independent of the avoidance maneuvers that the actors may perform. This solves an issue with comparing different crash and near-crash data sources where the amount of avoidance maneuver may be the differentiation between a crash and no crash or between a property damage and serious injury outcome. This metric could be applied to different data sources, e.g., human crash reconstructions and naturalistic driving near-crash events, as a way to compare these data sources. For example, a threshold of maximum injury potential could be applied to near-crash events as those that are relevant for evaluating an ADS for high-severity collision avoidance.
Although this metric appears to be independent of avoidance maneuvers, less urgent maneuvers (e.g., slowing down earlier because of an occluded view) could affect the value of this metric. For example, consider a scenario where a pedestrian is standing in the middle of the road and a vehicle approaches. In one instance, the vehicle approaches at constant speed and brakes urgently to avoid a collision. In a second instance, the vehicle slowly decelerates and comes to rest far from the pedestrian. In the second instance, the injury potential would be lower or even potentially zero, because of the restriction on the counterfactual lookahead time (1.5 sec) or distance (145 m) used in this metric. Future research should investigate appropriate counterfactual assumptions or models. Furthermore, future work should investigate the sensitivity of this metric using naturalistic and crash data. An ideal data source would contain both “normal” driving and serious injury crashes so that the rate of encountering high maximum injury potential events could be investigated.
Funding
The author(s) reported there is no funding associated with the work featured in this article.
References
- Arun A, Haque MM, Bhaskar A, Washington S, Sayed T. 2021. A bivariate extreme value model for estimating crash frequency by severity using traffic conflicts. Anal Methods Accid Res. 32:100180. doi:10.1016/j.amar.2021.100180
- Azeredo P, Tiernan T, Najm WG. 2021. Test procedures with countermeasure timing constraints for intersection movement and left turn assist safety applications. Report DOT HS 812 893. Washington, DC: United States Department of Transportation. National Highway Traffic Safety Administration.
- Bärgman J, Lisovskaja V, Victor T, Flannagan C, Dozza M. 2015. How does glance behavior influence crash and injury risk? A ‘what-if’ counterfactual simulation using crashes and near-crashes from SHRP2. Trans Res Part F: Traff Psychol Behav. 35:152–169. doi:10.1016/j.trf.2015.10.011
- Bärgman J, Boda CN, Dozza M. 2017. Counterfactual simulations applied to SHRP2 crashes: The effect of driver behavior models on safety benefit estimations of intelligent safety systems. Accid Anal Prev. 102:165–180. doi:10.1016/j.aap.2017.03.003
- Laureshyn A, De Ceunynck T, Karlsson C, Svensson Å, Daniels S. 2017. In search of the severity dimension of traffic events: extended Delta-V as a traffic conflict indicator. Accid Anal Prev. 98:46–56. doi:10.1016/j.aap.2016.09.026
- Najm WG, Toma S, Brewer J. 2013. Depiction of priority light-vehicle pre-crash scenarios for safety applications based on vehicle-to-vehicle communications. Report DOT-VNTSC-NHTSA-11-12. Washington, DC: United States National Highway Traffic Safety Administration.
- McMurry TL, Cormier JM, Daniel T, Scanlon JM, Crandall JR. 2021. An omni-directional model of injury risk in planar crashes with application for autonomous vehicles. Traffic Inj Prev. 22(sup1):S122–S127. doi: 10.1080/15389588.2021.1955108. Epub 2021 Aug 17. PMID: 34402345.
- Riedmaier S, Ponn T, Ludwig D, Schick B, Diermeyer F. 2020. Survey on scenario-based safety assessment of automated vehicles. IEEE Access. 8:87456–87477. doi:10.1109/ACCESS.2020.2993730
- Scanlon JM, Kusano KD, Daniel T, Alderson C, Ogle A, Victor T. 2021. Waymo simulated driving behavior in reconstructed fatal crashes within an autonomous vehicle operating domain. Accid Anal Prev. 163:106454. doi: 10.1016/j.aap.2021.106454.
- Stevens S, Lam AH, Bellone J, Azeredo P, Mui E, Guglielmi J, Medri M. 2020. Baseline analysis of driver performance at intersections for the left-turn assist and intersection movement assist applications. Report DOT HS 812 914. Washington, DC: United States National Highway Traffic Safety Administration.
- Victor T, Dozza M, Bärgman J, Boda CN, Engström J, Flannagan C, Markkula G. 2015. Analysis of naturalistic driving study data: safer glances, driver inattention, and crash risk. Strategic Highway Research Program (SHRP 2) Report No. S2-S08A-RW-1. Washington, DC: Transportation Research Board.