
 ?Mathematical formulae have been encoded as MathML and are displayed in this HTML version using MathJax in order to improve their display. Uncheck the box to turn MathJax off. This feature requires Javascript. Click on a formula to zoom.
Abstract
Objective: Vehicle collisions are described with the help of collision severity parameters such as energy equivalent speed (EES) and the collision-based change of velocity (delta-v). These serve as an input for injury outcome estimations through injury risk functions (IRF) or for the virtual assessment of active safety systems in case of a modified collision. A novel method was developed with the aim of simulating various vehicle collisions within a short time frame while ensuring the accuracy of the collision severity parameters.
Methods: Previously developed three-dimensional EES models were used in this study. They were used to compute 2 D vehicle substitute models, which are deformed during a new, time-discrete method. By using fundamentals of mechanical impact calculation and vehicle kinematics, relevant collision severity parameters are calculated. These steps are executed in an own developed standalone tool named impactEES. The results obtained were verified against measured crash test data from the European New Car Assessment Programme (Euro NCAP) and the Technical Center of Allgemeiner–Deutscher–Automobil-Club (ADAC).
Results: The novel method enables the automated computation of various car-to-car and car-to-object collisions. The output of impactEES includes the deformation area, EES, and delta-v. Furthermore, it includes the following time-discrete data for each vehicle: translational and angular accelerations, translational and angular velocities, and the position of the center of gravity in addition to the heading of the vehicle. Finally, without the need of highly sophisticated hardware, a single simulation of a collision between two vehicles can be calculated within only a few seconds including collision severity parameters. Based on the comparison of measured crash test data and results obtained from impactEES the mean percentage error (MPE) and its standard deviation (SD) were calculated for EES (MPE= − 2.0%, SD = 8.4%, n = 14) and delta-v (MPE= − 1.2%, SD = 14.2%, n = 18).
Conclusions: The novel method allows for the 2 D computation of various car-to-car and car-to-object collisions. Using predefined IRF allows the assessment of injury probabilities relative to the change of collision severity parameters. Both can be used for the virtual assessment of injury mitigation capabilities of active safety systems and thus represent an important contribution to its targeted development.
Introduction
The severity of real-world crashes is quantified through technical severity parameters, such as energy equivalent speed (EES) and collision-based change of velocity (delta-v). Both are found to influence the severity of occupant injuries (e.g., Miltner and Salwender (Citation1995)). Therefore, EES and delta-v are used as input parameters for injury risk functions (IRFs). These functions describe “the relationship between the risk of injury and some [collision severity] parameters […] based on a particular sample of casualties and injuries” (Alvarez et al. Citation2017).
Active safety systems can either avoid crashes or mitigate the crash severity, therefore altering EES, delta-v, and injury outcomes. Alvarez et al. (Citation2017) show, that simulating the same collision without and with an active safety system allows a comparison of the results and thereby an evaluation of the system-caused mitigation. Based on the mitigated values and IRFs the assessment of injury and severity reduction due to an active safety system is possible.
To simulate these vehicle collisions, different methods are described in the literature. A distinction can be made between momentum-based methods (e.g., PC-Crash (DSD Dr. Steffan Datentechnik)), stiffness-based methods (e.g., PC-Crash or DyMesh (York et al. Citation1999)) and the finite element method. Breitlauch (Citation2020) analyzed these methods and revealed a gap between two groups: The first one being fast but delivering only a few, partly inaccurate results and the other delivering detailed and accurate results but requiring high computing time. But, a time-effective computation of numerous and reliable results is needed, since the reliability of an active safety system benefit estimation increases with the number of considered collision situation variations. To close the gap between both mentioned existing groups of methods, a novel method was developed with the following objectives:
Fast computation compared to previous methods, without sacrificing accuracy
Prediction of deformations for vehicle collisions
Estimation of 2D time-discrete acceleration pulses of the impacting vehicles
Estimation of valid EES and delta-v
Methods
Energy equivalent speed (EES) models
The EES is the velocity for which its corresponding kinetic energy is equal to the energy of a collided vehicle transformed into plastic deformation (Campbell Citation1972). Therefore, the EES is used to link visual deformation of a crashed vehicle with the aggregated energy transformations during the impact.
As a basis, three-dimensional EES models developed in previous research were used in this study (Breitlauch et al. Citation2022; Breitlauch and Erbsmehl Citation2021b, Citation2021a; Erbsmehl Citation2013, Citation2014; Breitlauch and Erbsmehl Citation2021c). These 3 D EES models exist for six common passenger vehicle types (super-compact, mini-compact, compact, station wagon, sedan, SUV) each divided by twelve principal directions of force (PDOF (SAE International März 1980)). This leads to 72 usable 3 D EES models. Their most important data sources are deformed vehicles with reconstructed EES values from real-world crash databases (Breitlauch et al. (Citation2022), Table 1). To compensate a possible bias of the reconstructed EES values, additional crash data from recent crash tests have been used to scale the 3 D EES models (Euro NCAP 2021). Simplified, these models represent three-dimensional volumetric pixel (voxel) models, where each voxel inherits an EES value, which is equivalent to the energy that is necessary to deform this voxel. For more information, see Chapter A1 (Supplementary material).
In a first simplifying step, the 3 D EES models were used to derive 72 2 D vehicle substitute models, one for each vehicle type and PDOF. For this, all vertical layers of voxels with identical lateral and longitudinal positions were summarized into one layer of voxels. The derived 2 D vehicle substitute models were then used during the new, time-discrete method to convert deformation into collision energy. Therefore, for each colliding vehicle one 2 D vehicle substitute model was selected, based on vehicle type and PDOF.
Collision computation core
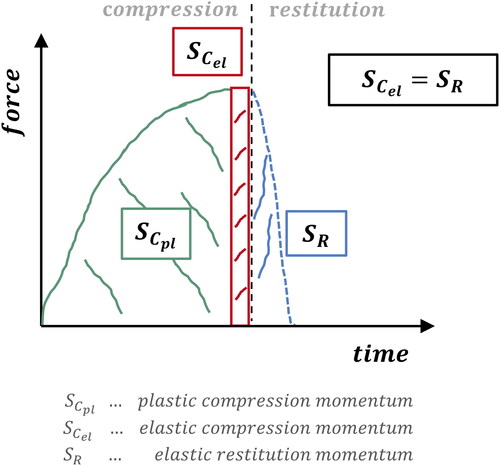
In classical mechanics (as described by Goldsmith (Citation1960)), an impact is divided into a compression phase and a restitution phase. During the compression phase the material is elastically and plastically deformed, whereby only the elastic deformations will be restored during the restitution phase. Since the EES is defined by referring to plastic deformation, the used 3 D EES models and 2 D vehicle substitute models only represent plastic deformation too. Therefore, the compression phase had further to be divided into a plastic and an elastic compression phase. In the resulting three-phase collision model in , the elastic compression follows the plastic compression separately and is equal to the elastic restitution. Since the momentum values of elastic compression and elastic restitution were known due to the mechanical principles of a complete impact (Breitlauch Citation2020) and by using the 2 D vehicle substitute models and the three-phase collision model, the plastic compression phase was calculated.
Figure 1. Impact division into plastic compression, elastic compression and elastic restitution.
The core of the developed method is the time-discrete iterative approach during the deformation of impacting vehicles, whereby plastic deformation is converted into collision energy. The computation starts when voxels of impacting, moving vehicles or objects begin to overlap each other. Each time slice then consists of the following summarized steps:
Deformation computation: identify overlapping and deformed voxels
Force vector calculation: calculate resulting force vector based on the deformed voxels
Kinetic calculation: calculate the resulting accelerations of the vehicles
Kinematic calculation: calculate the velocity and position of the impacting objects
Check abort criteria: check, if the time-discrete computation shall continue and restart with (1), or either move to (6)
Plastic compression finished, continue with elastic assumptions explained below
The following paragraphs describe the steps above in further detail, while illustrates the deformation (step 1), the force vector calculation (step 2), and the kinetic calculation (step 3) for a simple two-dimensional object.
Figure 2. Example for the time step of the time-discrete approach to compute resulting collision force
and acceleration
for the deformable, moving object A and the fixed, not deformable object B (no EES model needed).
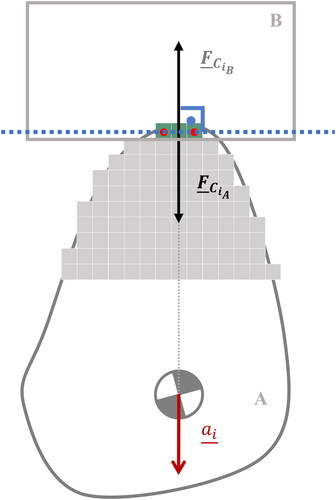
Initially, overlapping voxels of the current time slice are identified for deformable objects (step 1). The 2 D vehicle substitute models are used to compute the necessary impact energy
to deform these voxels
:
(1)
(1)
(2)
(2)
Based on the work-energy-theorem (Morgan Citation1963) and the distance covered () the impact energy is converted into the magnitude of the impact force
(EquationEq. (2)
(2)
(2) ). To define the complete impact force vector, its direction, and its initial point need to be known (step 2). Therefore, the direction is estimated normal to the plane between the deformed voxels with the highest EES value. The initial point is estimated as the center of energy (
) of all deformed voxels, which is the weighted average position (
) of all deformed voxels of a time slice according to the energy represented by their EES value; see EquationEq. (3)
(3)
(3) :
(3)
(3)
With the known vector of the impact force the translational and rotational acceleration
) of each vehicle center of gravity are calculated (step 3). For that, the tire friction forces (
) and the moment of inertia against yaw (
) are considered in well-known mechanical principles (Newton Citation1729):
(4)
(4)
(5)
(5)
These accelerations are then used to calculate the velocity, the position, and the angle of the impacting vehicles at the end of the time slice (step 4). If the changed vehicle positions and angles result in new overlapping voxels, they may be processed during the next time slice of steps (1) to (4).
The end of the plastic compression (step 6) is reached if one of the following abort criteria (step 5) applies:
both vehicles would predictably separate each other at the end of the following time slice,
at least one vehicle does not expect to overlap with its opponent in the following time slices, or
the aggregated plastic collision momentum of the past time slices reaches a threshold, which is calculated based on the impact velocities and mechanical principles of a complete impact (Breitlauch Citation2020).
To complete the impact in terms of energy, the subsequent elastic compression and elastic restitution after the plastic compression need to be calculated (6). Based on the known collision momentum for each collision phase, an assumed time span of five milliseconds for each phase and the impulse-momentum laws (Goldsmith Citation1960), a collision force for each elastic collision phase is calculated. After applying these forces according to the shown approach, both impacting vehicles or objects separate each other, wherefor the collision computation is finished.
Within our approach, we assumed
tire forces to be static, as well as
less stiff voxels being deformed earlier when impacting stiffer opponent-voxels (Lin et al. Citation1975).
The developed time-discrete approach was successfully adapted for vehicle-to-object collisions and collisions involving two vehicles. In accordance with Taylor & Francis policy and my ethical obligation as a researcher, I am reporting that the Fraunhofer-Gesellschaft has applied for a patent for the developed method (Breitlauch and Erbsmehl Citation2020).
impactEES
To implement and test the novel method, the standalone C++ tool called impactEES was developed. By using the graphical user interface, various collision situations can be created and computed. The output of impactEES includes the resulting deformation area, EES, and delta-v and the following time-dependent data for each vehicle: translational and angular accelerations, translational and angular velocities, and the position of the center of gravity in addition to the heading of the vehicle.
Different input parameters are needed, to compute a collision successfully:
coefficient of restitution
definition of the participants (vehicles and objects: length, width, height, position of the center of gravity; vehicles only: used 2D vehicle substitute model (vehicle type), wheelbase, track gauge, overhang before front axle, a so-called reference grid to scale the used 2D vehicle substitute model to the vehicle)
definition of the collision situation (position and heading of vehicles, trajectories, velocities)
To enable the automated processing of a list of collision situations (stack-processing) a specific JSON-file-structure was developed. This file structure holds all necessary input parameters for a complete collision situation. Via a windows command prompt, this allows impactEES to automatically simulate a collision based on one single JSON file. Therefore, even parallel computing is made possible by using external tools of parallelization, e.g., R/R Studio, Python or MATLAB. These tools can invoke several instances of impactEES on multiple processor cores via the developed command prompt interface, each instance simulating its own collision situation in parallel.
Since JSON files can easily be read and written, a conversion from different data sources to the impactEES-JSON format can easily be established and allows the usage of almost every vehicle crash database and pre-crash simulation software. This includes real-world crashes e.g., from the German In-Depth Accident Study (GIDAS (Otte et al. Citation2003)) Pre-Crash-Matrix (PCM (Schubert et al. Citation2013)) which can be simulated for instance in CarMaker and subsequently simulated in impactEES. This also includes accident scenario data e.g., from the TASC database (Urban et al. Citation2020) which uses a suitable JSON file structure and can therefore be simulated without any further adaptions.
Verification against crash tests
To verify the results of impactEES, the following crash tests were available and therefore used as a reference:
| • | Four compatibility crash tests from the Technical Center of “Allgemeiner–Deutscher–Automobil-Club” (ADAC): In the first crash test an Audi Q7, model year 2006, was crashed in the 40% offset configuration with a Fiat 500, model year 2007. Both vehicles had a collision speed of 56 km/h. | ||||
In addition, the ADAC supported this work with three more frontal vehicle-to-vehicle crash (v2v) tests with 40% overlap at 56 km/h [compact 2012 – mini-compact 1996; compact 2015 – super-compact 2007; compact 2012 – super-compact 2007]. | |||||
| • | 10 crash tests from the Euro NCAP: Five side oblique pole (PO) and five frontal full width (FW) crash tests from Euro NCAP were used also [2018: SUV; 2019: two sedans, compact, station wagon; 2020: compact] (Euro NCAP 2019, 2019, 2021). | ||||
The measured crash test data was compared with the maximum deformation depth, the acceleration pulses, EES, and delta-v computed by impactEES. Due to the analysis at vehicle level and some missing crash test data for EES calculation (Breitlauch et al. Citation2022), 14 measured EES datasets and 18 measured deformation, acceleration, and delta-v datasets were compared to the simulated results. To assess the error of impactEES, the mean percentage error (MPE) and the mean absolute percentage error (MAPE) in addition to their standard deviation were computed.
Results
By using the developed 2 D vehicle substitute models a time discrete approach to transform deformation into collision energy and subsequently into force and acceleration was developed. The novel method was implemented in the standalone program called impactEES. It allows for the simulation of collisions while computing various results like EES, delta-v, and time-discrete acceleration. Furthermore, a JSON-based input interface was developed to ensure automated, stacked computations of various vehicle collisions, which allows parallel computation also.
To investigate the first objective, the time needed to simulate the prementioned crash tests with impactEES on a usual laptop (Intel® Core™ i7-8850H CPU, 16GB RAM, Windows 10) was documented. Thereby, one single simulation run and a stack-processed simulation of 14 crash tests were analyzed. The single simulation run of the prementioned collision between Audi Q7 and Fiat 500 impactEES needed 6.5 seconds. In comparison, the simulation of all 14 crash tests using stack-processing needed 55 seconds leading to about 4 seconds per simulation. Therefore, the standard computation time of impactEES is assumed to be within this time range, using one single processor core only. In general, it was found that the computation time of vehicle-to-vehicle collisions take place at the upper end of this time range, while vehicle-to-object collisions take place at the lower end.
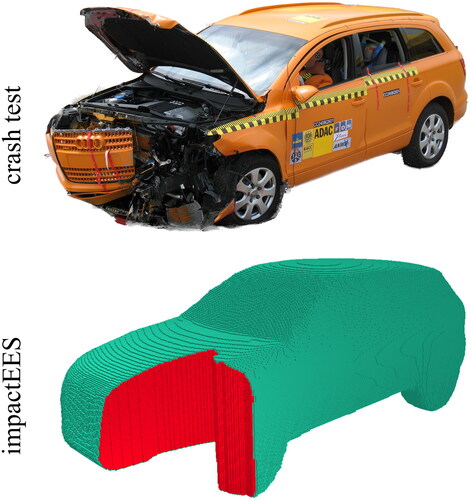
The second objective was to develop a method to predict the deformation for vehicle collisions. For that, the exemplary 40%-overlap crash test between an Audi Q7 and a Fiat 500 was simulated, and the predicted deformations were visually compared with the documented ones. The location and area of the deformations are visually comparable for both vehicles (see the Audi Q7 in and the Fiat 500 in in the Supplementary material). In addition, the MPE of the maximum deformation depth for all 18 crashed vehicles was computed (see Chapter A2, Supplementary material). The
is −9.6% for FW, 107.6% for PO, and 14.6% for v2v crash tests. It was found, that impactEES can estimate
for FW and v2v with acceptable accuracy, while PO crash tests cause high deviations.
Figure 3. Comparison between predicted (below) and documented deformations (above) of the Audi Q7, projected from the 2 D substitute model to a 3 D EES model.
Another objective was to develop a method, which can estimate 2 D time-discrete acceleration pulses of the impacting vehicles. Therefore, the simulated and measured longitudinal acceleration pulse of a FW crash test from Euro NCAP are compared in by way of example. The acceleration pulses for all given crash tests can be seen in Chapter A3 (Supplementary material). In addition, a table comparing maximum acceleration values and average differences
(identical to the difference of the average accelerations) are prepared in the Supplementary material also. It should be noted that the last two data points of the simulated pulse are mainly based on assumptions about the elastic compression and elastic restitution. After completing these two impact phases the collision computation is finished and the acceleration returns to zero, which is why the length of the compression phase of the acceleration pulses is comparable for 9 out of 18 crashed vehicles. The
was computed with −7.2% for FW, −47.7% for PO, and −37.1% for v2v crash tests. The
is −1.0 m/s2 for FW, 24.8 m/s2 for PO, and 10.0 m/s2 for v2v crash tests. This leads to the following findings:
Figure 4. Comparison of the acceleration pulse between the estimation of impactEES (green) and the measured crash test data (black).
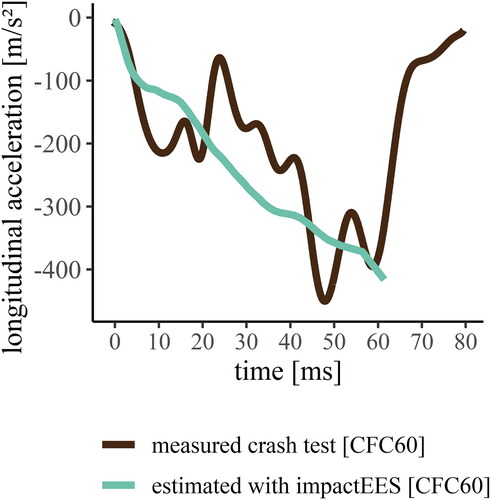
The simulated acceleration pulses for FW are close to the measured ones.
PO crash tests cause high deviations.
The simulated
for v2v crash tests is on average 37% lower than the measured one, while the differences between the average accelerations are small.
From that it was derived that the developed method in general is able to estimate acceleration pulses, while the acceleration pulses of side pole impacts and vehicle-to-vehicle collisions need to be further researched and validated in future.
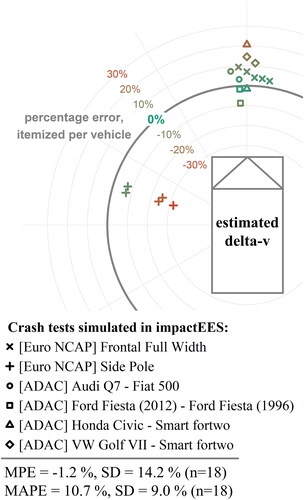
Finally, the errors of estimated EES and delta-v were investigated, based on a comparison between impactEES and 14 various crash tests. and summarize the results by presenting the percentage error of each crashed vehicle and the resulting mean percentage error (MPE), the mean absolute percentage error (MAPE), and the standard deviation (SD) for MPE and MAPE both for EES and delta-v. The color of the data points indicates the percentage error. Additionally, the angle around the vehicle represents the impacted vehicle side but is manipulated manually to ensure the visibility. For example, the already mentioned crash test between Audi Q7 and Fiat 500 is represented in by a circle. Because of the frontal crash of the two vehicles one circle per vehicle is placed in front of the sketched vehicle. While the percentage error for EES estimated with impactEES for the Audi Q7 is −5%, the percentage error for the Fiat 500 is about 10%. The greater the percentage error, the greater the distance of the data points from the grey zero line. leads to the finding, that especially EES values of vehicle-to-object collisions (represented by “+, x”) are estimated with low percentage error values. But the EES values for the crash test of Audi Q7 and Fiat 500 (“o”) are estimated with a percentage error of equal or less than 10% as well. For the estimated EES values no anomalies could be identified. analogously displays the estimated delta-v values for 18 different crashed vehicles. While the MAPE over all data is 10.7%, the MAPE for estimated delta-v values for frontal crash tests (“x, Δ,□,⋄, o”) is 6.0% only. Side pole crash tests (“+”) do cause percentage errors higher than 20% for 3 out of 5 crashed vehicles. This analysis leads to the finding, that impactEES can estimate EES as well as delta-v with MAPE’s equal or less than 6.0%, except for side pole crash tests.
Figure 5. Percentage error for EES values estimated with impactEES.
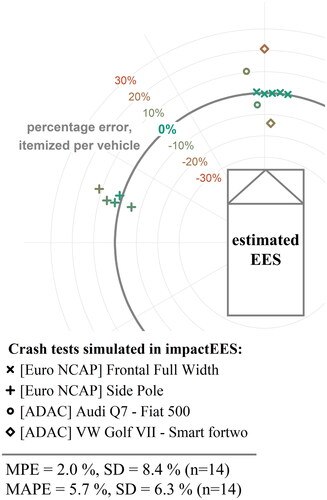
Figure 6. Percentage error for delta-v values estimated with impactEES.
Discussion
A program named impactEES was developed to simulate various vehicle-to-object and vehicle-to-vehicle collisions, which computes relevant collision severity parameters and allows a parallel processing. While impactEES can estimate valid deformations, average acceleration values, EES values and delta-v values for various collisions (except pole crash tests), the maximum of acceleration pulses, however, is only accurate for frontal full width collisions up to now. Therefore, side pole and vehicle-to-vehicle acceleration pulses will have to be addressed in future research.
Comparison to literature
The novel vehicle collision simulation program impactEES is faster than comparable finite element (FE) simulations and can provide further and more reliable results than existing and fast-computing momentum-based or stiffness-based collision simulation methods. Because of solving a huge network of differential equations FE simulations still need a lot of computation time, up to a day. In contrast, impactEES has no connections between the voxels and is based on simple calculations, which is why it needs only seconds. This is simultaneously the reason why the developed method provides less accurate results than FE simulations. Since momentum-based collision simulation methods are using a simplified physical approach of an impact in infinitely short time, they are not able to estimate deformations or EES values. Additionally, according to Kuzel et al. (Citation2006) the often user-specified stiffness coefficients of stiffness-based collision simulation methods affect the predicted peak acceleration, maximum deformation and post-impact travel. Niehoff and Gabler (Citation2006) also pointed out the strong influence of stiffness coefficients for different vehicle types, while evaluating WinSMASH’s error for delta-v for frontal collisions with 23% on average. Watson et al. (Citation2022) evaluated WinSMASH’s delta-v values of a rear impact dataset from the CISS database with percentage errors often much higher than 20%. In contrast, impactEES uses 2 D vehicle substitute models, which are based on reliable real-world crash data and crash tests and lead to lower percentage errors.
The verification of the developed method is based on 14 crash tests, which do hardly represent all various crash configurations found in real-world crash data. While this data was used to verify the potential of the method, future validation work needs to address a representative data set like described from Östling et al. (Citation2019) or Leledakis et al. (Citation2021). So far, the possibility to simulate various crash configurations is only methodically given by using the EES models provided for this purpose. These models represent different directions of forces as well as different vehicle structures clustered by generalized vehicle types. More precise distinctions are not possible at this time but may be addressed in the future.
Limitations
Further limitations of impactEES need to be regarded and discussed:
No contact friction or snagging: The current development state of impactEES does not cover the contact friction or snagging between two impacting objects or vehicles. Therefore, especially oblique walls and sliding collisions can lead to incorrect, too conservative simulation results for acceleration, velocity, and movement and thus also for deformations. According to Hamernik et al. (Citation2005) contact friction can significantly affect the output for example in offset broadside-type collision simulations, which is why it is often considered by present collision simulation methods (DSD Dr. Steffan Datentechnik; York et al. Citation1999; Hamernik et al. Citation2005).
Simplified implementation of induced deformation: Induced deformations are characterized by being located outside the area of direct contact of a collision object. One example is the deformed vehicle side after a side pole crash test. While the pole only impacts a small part of the passenger compartment, the entire area of the passenger compartment is part of induced deformations. Since the developed method is based on the deformation of the impacting vehicles, the implementation of induced deformations affects the simulation results. Up to now, its simplified description in impactEES can cause unreliable simulation results for small impacting objects. For example, this behavior can be seen at the PO crash tests in , in Chapter A2 in Figure A22 (Supplementary material), and in Chapter A3 (Supplementary material): Here the pole intrudes too far into the vehicle, causing smaller but deeper deformations, too conservative acceleration (thus also delta-v), and incorrect movement. However, there are currently no publications in the literature on induced deformations in collision simulation methods.
2D calculation method: Up to now, impactEES computes collisions in 2D only, considering the static tire contact forces. Due to the missing potential energy of vehicles, this may cause too high acceleration pulses. However, the currently existing methods are often simulating vehicle collisions in 3D (e.g., (York et al. 1999; DSD Dr. Steffan Datentechnik; Fittanto et al. Citation2002)).
Limited validation for deformation and acceleration: Due to the lack of measurement data the current validation study is limited to a comparison of examples and estimated deformation measurements for deformations of vehicle-to-vehicle crash tests. Note, that these estimations can be affected by bumpers, bonnets, and other remaining sheet metal parts. Also, missing methods to compare 18 simulated acceleration pulses with the measured ones leads to the comparison of simple parameters. Future validation studies need to include more datasets, especially with deformation measurements. Additionally, methods to compare a big dataset of acceleration pulses are needed. For example, a method called CORA (CORrelation and Analysis) provides an approach to evaluate time-history signals. Therefore, it will be investigated further for future studies.
Usage limited to the current EES models: The developed method uses existing EES models, which are based on real-world crashes. Due to varying frequencies of real-world crash scenarios the size of the data set for each EES model, stratified by PDOF, is also varying (see Breitlauch et al. (Citation2022), Table 1). This may affect the result quality of crashes at vehicle sides with less data (e.g., side, rear) compared to crashes at vehicle sides with more data (e.g., front). Therefore, the future development of the method should be supplemented with an increased amount of data used for the creation of the EES models.
Conclusion
With this article and impactEES, an approach to close the gap between the existing methods to simulate vehicle collisions is shown. A novel method is presented which can compute sound results in a short time frame, except for side pole crashes. The use of IRFs can complement the mitigation of EES and delta-v with the mitigated risk of injury. In addition to the developed input interfaces, this ensures a high usability of the method. The possibility to process a stack of collision situations with the option of parallel processing enables the simulation of large datasets. This can be used for the benefit assessment of active safety systems and the virtual assessment of vehicles during their development process.
Supplemental Material
Download Zip (5.5 MB)Data availability statement
The data that support the findings of this study are available from the corresponding author, P. Breitlauch, upon reasonable request.
Additional information
Funding
References
- Alvarez S, Page Y, Sander U, Fahrenkrog F, Helmer T, Jung O, et al. 2017. Prospective Effectiveness Assessment of ADAS and Active Safety Systems via Virtual Simulation: A Review of the Current Practices. In: National Highway Traffic Safety Administration NHTSA, editor. The 25th International Technical Conference on the Enhanced Safety of Vehicles (ESV); 05–08. Juni; Detroit, Michigan USA.
- Breitlauch P. 2020. Eine neuartige Stoßberechnungsmethode für Pkw-Kollisionen basierend auf Energy Equivalent Speed (EES)-Modellen [Master Thesis]. Graz, Österreich: TU Graz, Institut für Fahrzeugsicherheit.
- Breitlauch P., Erbsmehl CT. 2021a. Entwicklung eines hochauflösenden, dreidimensionalen Energy Equivalent Speed (EES)-Modells für Pkw: Teil 2 - Plattform zur EES-Berechnung. Verkehrsunfall und Fahrzeugtechnik VKU (0724-2050). 10:S. 340–347.
- Breitlauch P., Erbsmehl CT. 2021b. Entwicklung eines hochauflösenden, dreidimensionalen Energy Equivalent Speed (EES)-Modells für Pkw: Teil 1 - Modellentwicklung. Verkehrsunfall und Fahrzeugtechnik VKU (0724-2050). 9:S. 288–303.
- Breitlauch P., Erbsmehl CT. 2021c. Entwicklung eines hochauflösenden, dreidimensionalen Energy Equivalent Speed (EES)-Modells für Pkw: Teil 3 - Eine neuartige Stoßberechnungsmethode. Verkehrsunfall und Fahrzeugtechnik VKU (0724-2050). 11:S. 378–386.
- Breitlauch P, Junge M, Erbsmehl CT, Sandner V, van Ratingen M. 2022. Converting Post-Crash Deformation into Energy Equivalent Speed (EES) – Towards an Objective Measure of Crash Severity [under review]. Proceedings of the Institution of Mechanical Engineers, Part D: Journal of Automobile Engineering.
- Breitlauch P., Erbsmehl CT. METHOD FOR MODELLING A COLLISION OF TWO VEHICLES: patent application; 01.12.2020.
- Campbell KL. 1972. Energy as a Basis for Accident Severity – A Preliminary Study [Dissertation]. Madison: University of Wisconsin.
- Erbsmehl CT. 2013. A Method to Estimate Deformation Energy Levels of Battery and Fuel Cell Systems Depending on Their Location by Using Real Accident Data (GIDAS). In: 23rd Enhanced Safety of Vehicles Conference (ESV), Seoul, Korea; 27–30 May.
- Erbsmehl CT. 2014. Ein neues dreidimensionales Energy Equivalent Speed (EES)-Modell für Fahrzeuge basierend auf Unfalldaten [Dissertation]. Dresden (Germany)
- Fittanto DA, Ruhl RA, Southcombe EJ, Burg H, Burg J, SAE International. 2002. Overview of CARAT-4, a Multi-body Simulation and Collision Modeling Program. In SAE 2002 Automotive Dynamics & Stability Conference and Exhibition; 07. Mai. SAE International. doi: 10.4271/2002-01-1566. 10.4271/2002-01-1566
- Goldsmith W. 1960. Impact – The Theory and Physical Behaviour of Colliding Solids. London: Edward Arnold Ltd. Unabridged Dover Publications reprint 2001.
- Hamernik JD, Schuler DM, Rudack BC, Wittekind DE, Tholl BP. 2005. Investigating the Sensitivity of Vehicle Response to Inter-Vehicle Friction Values for Broadside Collisions Utilizing HVE (EDSMAC4 Algorithm)
- Kuzel M, Werner S, Richards D. 2006. The Effect of Stiffness Coefficients on Output Variables in EDSMAC4 Simulations.
- Leledakis A, Lindman M, Östh J, Wågström L, Davidsson J, Jakobsson L. 2021. A Method for Predicting Crash Configurations using Counterfactual Simulations and Real-World Data. Accid Anal Prev. 150:105932. 10.1016/j.aap.2020.105932
- Lin K-H, Kamal MM, Justusson JW, Society of Automotive Engineers 1975. Effect of Vehicle Mix on Two-Car Head-On Impact. In Automotive Engineering Congress and Exposition; February 24–28; Detroit, Michigan, Warrendale.
- Miltner E, Salwender H-J. 1995. Influencing Factors on the Injury Severity of Restrained Front Seat Occupants in Car-To-Car Head-On Collisions. Accid Anal Prev. 27(2):143–150. 10.1016/0001-4575(94)00039-o
- Morgan J. 1963. Introduction to university physics. Boston: Allyn & Bacon.
- Newton I. 1729. Mathematical Principles of Natural Philosophy: Übersetzt ins Englische von Andrew Motte. London: Benjamin Motte.
- Niehoff P, Gabler HC. 2006. The Accuracy of Winsmash Delta-V Estimates: The Influence of Vehicle Type, Stiffness, and Impact Mode. Annu Proc Assoc Adv Automot Med. 50:73–89.
- Östling M, Jeppsson H, Lubbe N. 2019. Predicting Crash Configurations in Passenger Car to Passenger Car Crashes to Guide the Development of Future Passenger Car Safety. p. 11–13.
- Otte D, Krettek C, Brunner H, Zwipp H. 2003. Scientific Approach and Methodology of a New In-depth Investigation Study in Germany so called GIDAS.
- Schubert A, Erbsmehl C, Hannawald L. 2013. Standardized pre-crash-scenarios in digital format on the basis of the VUFO simulation. In: Bundesanstalt für Straßenwesen, editor. 5th International conference on ESAR; 7th–8th September 2012; Hannover (Germany). Fachverlag NW in the Carl Schuenemann Verlag GmbH.
- Urban M, Erbsmehl C, Mallada JL, Puente Guillen P, Tanigushi S. 2020. A Methodology for Building Simulation Files from Police Recorded Accident Data (for ADAS Assessment). FISITA 2020 Web Congress
- Watson R, Cormier J, Bonugli E, Greenston M. 2022. Comparison of Rear Impact Crash Reconstructions to Event Data Recorders in the Crash Investigation Sampling System Database. Automotive Technical Papers. SAE International. 10.4271/2022-01-5069
- York AR, Day TD, SAE International. 1999. The DyMesh Method for Three-Dimensional Multi-Vehicle Collision Simulation. International Congress and Exposition; 1–4. März; Detroit, Michigan USA.