
Abstract
Objective
The purpose of this study was to provide a whole-body biofidelity assessment of the Hybrid III (HIII) and THOR 50th percentile male anthropomorphic test devices (ATDs) during frontal sled tests, incorporating data from kinematics, chest deflection, and test buck reaction load cells. Additionally, the accuracy of the injury risk prediction capabilities for each ATD was evaluated against injuries observed in matched postmortem human surrogate (PMHS) tests.
Methods
Sled tests, designed to simulate a United States New Car Assessment Program (US-NCAP) frontal test, were conducted using the HIII, THOR, and 8 approximately 50th percentile male PMHS under 3 restraint conditions. The test buck was instrumented with load cells on the steering column, knee bolster supports, and foot supports. ATD and PMHS reaction force–time histories were quantitatively compared using the ISO/TS-18571 objective rating metric. Previously published biofidelity analyses of kinematic and chest deflection data from the same tests were combined with the reaction force analyses to perform an overall assessment of the comparative biofidelity of each ATD. Injury risk predictions from existing HIII and proposed THOR injury risk curves for the US-NCAP were compared to observed injuries.
Results
For the reaction forces, the HIII and THOR had similar levels of biofidelity on average, except for 2 locations. The HIII produced more biofidelic knee bolster support forces, and the THOR lap belt forces were more biofidelic. The comparative biofidelity of the ATDs also varied by body region. The THOR head response was more biofidelic, whereas the HIII thorax and lower extremity responses had higher biofidelity. When all body regions were pooled, the HIII was more biofidelic, but differences between ATDs were generally small. Both ATDs were able to predict the observed injuries, except for the HIII chest, HIII neck, and THOR neck, all of which underpredicted PMHS injury outcomes.
Conclusions
This study revealed that biofidelity assessed through response time histories and accuracy of injury risk predictions do not always align. Specifically, the HIII had marginally better time history biofidelity, whereas the THOR had better injury prediction. However, not all THOR responses could be fully assessed, so more work is needed to assess the THOR in complex loading environments.
Introduction
The Test device for Human Occupant Restraint (THOR) 50th percentile male anthropomorphic test device (ATD) was developed to be the successor of the Hybrid III (HIII) frontal ATD and is slowly being integrated into consumer driven safety ratings. In 2015, NHTSA announced plans to incorporate the THOR into the United States New Car Assessment Program (US-NCAP) procedures for the frontal test as well as a future frontal oblique test (US Department of Transportation Citation2015). The European NCAP (Euro NCAP) began using the THOR in their mobile progressive deformable barrier frontal impact tests in 2020 (Been and Ellway Citation2018). Since its inception as the Trauma Assessment Device 50th percentile male (TAD-50), the THOR has undergone several iterations and improvements, including the THOR-alpha, THOR-FT, THOR-NT, THOR-NT with modkit (THOR-k), THORAX demonstrator, and THOR-Metric (THOR-M), the most recent version. A considerable amount of research has been conducted to guide the development of the THOR and its associated injury risk curves and injury assessment reference values. However, fewer studies have been conducted on the current THOR version.
Only 2 studies have evaluated the biofideltiy of the current THOR compared to the HIII under whole-body frontal impact conditions. Parent et al. (2017) conducted a broad analysis of THOR, HIII, and postmortem human surrogate (PMHS) data, including individual component tests and whole-body sled tests, to determine whether the HIII or THOR was more biofidelic. Though component tests were analyzed for every body region, 3 of the 4 whole-body sled test conditions included in the study prohibited lower extremity movement, limiting the analysis to upper body responses. Furthermore, the accuracies of the HIII and THOR injury risk predictions were not evaluated, so it is unclear how differences in biofidelity could translate to differences in injury risk prediction accuracy. Albert et al. (Citation2018a, Citation2018b, Citation2018c) conducted a series of matched sled tests on the HIII, THOR, and PMHS, using more realistic boundary conditions for the lower extremity. The resulting kinematics, chest deflections, and neck kinetics were published, as were injury risk analyses of the thorax and neck. However, a new set of injury risk curves for the THOR was developed by NHTSA and released in 2020 (Craig et al. Citation2020), so an updated and expanded analysis of the THOR’s injury risk performance is necessary for this data set.
Internal ATD instrumentation is typically used as the basis of injury risk metrics, but the external responses of ATDs—that is, how they interact with the vehicle environment—are also important considerations for biofideltiy analyses. Recently, evaluations of the THOR and THOR-AV in rear-facing high-speed frontal crash tests have assessed the biofidelity of the ATDs’ interactions with the seat back and headrest by instrumenting these locations with load cells (Hagedorn et al. Citation2022; Wang Citation2022). Similar analyses in forward-facing frontal tests are necessary to understand how the THOR, particularly the lower extremities, interacts with the forward vehicle components.
The purpose of this study was to provide a whole-body biofidelity assessment of the HIII and THOR 50th percentile male ATDs during frontal sled tests, incorporating data from test buck reaction load cells to provide a novel assessment of external biofidelity. Additionally, the accuracy of the injury risk prediction capabilities for each ATD were evaluated against injuries observed in matched PMHS tests to generate a more holistic analysis that considered both time history responses and injury prediction.
Methods
Sled tests designed to replicate the US-NCAP frontal test for the 2012 Toyota Camry were conducted using the HIII, THOR-M (henceforth, THOR), and 8 approximately 50th percentile male PMHS (Table A1, see online supplement) under 3 restraint conditions: knee bolster (KB), knee bolster and steering wheel airbag (KB/SWAB), and knee bolster airbag and steering wheel airbag (KBAB/SWAB). The test buck was designed to match the interior of a 2013 Toyota Camry, and the acceleration pulse was the same as the 2012 Camry NCAP test (). Vehicle parts were used for the seat, 3-point seat belt system with pretensioner and load limiter, steering column, steering hub, steering wheel, and SWAB (when deployed). Rigid polyurethane foams were used to simulate the KB and KBAB (Albert et al. Citation2016). Each ATD underwent 2 tests per restraint condition, and 3 PMHS tests were conducted for each restraint condition except for the KB condition, which only had 2 PMHS tests. The positions of the ATDs and PMHS were matched as closely as possible, given design/anthropometry differences, by measuring initial joint angles and offsets between the occupants and test buck structures (Table A3, see online supplement). The detailed methodology for the tests has been previously published along with the kinematic data, neck kinetics, and chest deflections (Albert et al. Citation2018a, Citation2018b, Citation2018c).
Figure 1. The sled test setup with reaction load cells for the KB condition with the HIII (top) and KBAB condition with the THOR (bottom).
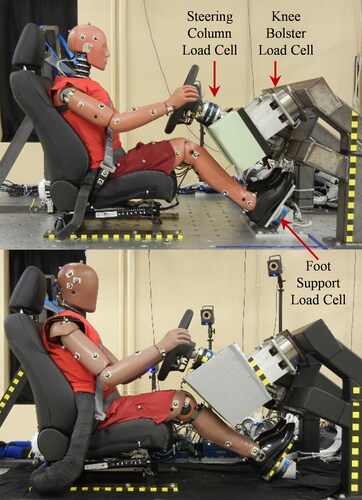
Table 1. Summary of average reaction force ISO results.
The test buck was instrumented with multi-axis reaction load cells (Table A2, see online supplement) at the steering column, left and right knee bolster supports, and left and right foot supports (). Additionally, the outboard lap and upper shoulder belts were instrumented with belt load cells. Test buck load cell data were filtered according to SAE J211 using channel frequency class 60, and belt load cells were filtered using channel frequency class 180 (SAE Citation2014). After filtering, the buck load cells underwent inertial compensation. Among the reaction loads, only the normal forces were nontrivial and were included in this analysis. These forces were oriented primarily in the fore–aft (x) direction with a smaller vertical (z) component. Polarities were adjusted so that compression was positive for the reaction loads and tension was positive for the belt loads. During posttest analysis of high-speed video, it was observed that the occupants’ upper extremities contacted the KB/KBAB foam and/or KB support structure for most tests. This resulted in local maxima in the KB reaction forces, which were not related to lower extremity loading (). Prior to further analysis, the KB reaction force–time histories were truncated at the local minimum immediately preceding the upper extremity interaction. For all affected tests, this occurred after the peak force caused by lower extremity interaction.
Figure 2. Steering column (top), right knee bolster (middle), and right foot support (bottom) forces for the KB condition. The knee bolster forces (middle) were truncated at the local minimum immediately preceding any upper extremity interaction.
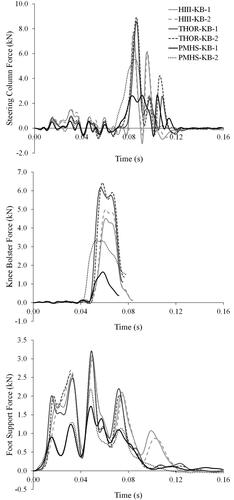
Table 2. Summary of average ISO results by location and internal/external.
Test buck and belt forces were qualitatively and quantitatively compared between surrogates. Force–time histories were qualitatively assessed within each condition to determine which ATD responded more similarly to the PMHS. Additionally, the objective rating metric described in ISO/TS-18571 (henceforth ISO) was used to quantitatively compare each ATD response to the matched PMHS response (International Organization for Standardization [ISO] Citation2014). ISO scores range from 0 (no similarity) to 1 (perfect similarity). The scores are further divided into qualitative categories of excellent (x > 0.94), good (0.8 < x < 0.94), fair (0.58 < x < 0.8), and poor (x < 0.58). The detailed methodology of this procedure has been previously described (Albert et al. Citation2018c). Briefly, characteristic averages of each force–time history were calculated for each surrogate within each condition. The characteristic averages were truncated to an interval of interest, eliminating trivial data at the beginning and end of the test. Then the ISO metric was used to generate similarity scores between the HIII and PMHS as well as the THOR and PMHS.
Previously published ISO scores from this test series comparing the ATD and PMHS kinematics and chest deflections were leveraged to perform a full-body biofidelity analysis. Internal signals included head, chest, and pelvis linear accelerations in the x- and z-directions; head, chest, and pelvis angular velocities about the y-direction; and chest deflections at the upper sternum, upper left anterior chest, upper right anterior chest, lower left anterior chest, and lower right anterior chest. External signals included the aforementioned normal reaction forces, lap and shoulder belt forces, head and knee excursions in the x- and z-directions, and shoulder and hip excursions in the x-direction. Averages were calculated to evaluate the comparative biofidelity of the HIII and THOR with respect to condition, signal type, body region, and internal vs. external signals.
To further evaluate the biofidelity of the ATDs, injury risk predictions were calculated for each ATD and compared to the observed PMHS injuries. For the HIII, the current US-NCAP injury risk equations were used in addition to the brain injury criteria (BrIC) and tibia index (TI; Table B1, see online supplement; Mertz Citation1993; Takhounts et al. Citation2013). THOR injury risk probabilities were calculated using the most recent equations proposed by NHTSA for the future US-NCAP at the time of writing (Table B2, see online supplement; Craig et al. Citation2020). For the HIII chest, THOR neck, and THOR chest, the injury risk curves accounted for occupant age. Therefore, these risk probabilities were calculated using the average PMHS age for each condition in addition to the age recommended for the NCAP calculation: 35 and 40 years for the HIII and THOR, respectively. PMHS injuries were evaluated via a full posttest dissection. Injuries were then coded using the 2008 version of the Abbreviated Injury Scale (AIS) because that was the most recent version at the time of dissection. The percentage of injuries observed in each condition was compared to the probabilities predicted by the ATDs to evaluate accuracy.
Results
The HIII and THOR had similar levels of biofidelity for the reaction forces on average, but their responses differed for the KB reaction forces and lap belt forces (; ). Both ATDs exhibited greater column forces compared to the PMHS for the KB condition, which involved a head strike for all surrogates (; Figure C1, see online supplement). At the KB support, the THOR forces were greater than the HIII and PMHS, which resulted in lower ISO scores compared to the HIII (Figure C2, see online supplement). The PMHS had lower foot support forces compared to the ATDs (Figure C3, see online supplement), which had similar forces and ISO scores. Shoulder belt forces were similar for all surrogates because they were largely dictated by the belt system characteristics and load limiter, given that all surrogates had similar anthropometry (Figure C4, see online supplement). However, the HIII had higher lap belt forces compared to the THOR and PMHS, resulting in lower ISO scores.
The pooled ISO analysis indicated that the HIII and THOR comparative biofidelity varied by body region (; Table C3, see online supplement). The THOR exhibited a more biofidelic head response, whereas the HIII had better scores for the thorax and lower extremities. For the pelvis, ISO scores were similar between the 2 ATDs. When the signals were divided into internal and external, the ATDs had similar internal biofidelity, but the HIII had higher external biofidelity (Table C2, see online supplement). This led to the HIII having a better overall ISO score when all responses were averaged.
Both ATDs were able to predict the observed injuries, except for the HIII chest and THOR neck injury risk curves, which both underpredicted PMHS injury outcomes. The injury risk probabilities from HIC were less than 0.3 for both ATDs, and no head injuries were observed (Table B3, see online supplement). Using BrIC to predict brain injury, one HIII KB test resulted in AIS3+ and AIS4+ injury risk probabilities greater than 0.5, but the remaining tests were lower than 0.25 for both ATDs (Table B4, see online supplement). However, the presence of brain injuries could not be assessed using PMHS. AIS2 neck injuries were observed in 5 of the 8 PMHS tests, but no AIS3 neck injuries were observed. Both ATDs accurately predicted the lack of AIS3+ neck injuries (Tables B5 and B6, see online supplement), but the THOR underpredicted the rate of AIS2 neck injuries. Conversely for the thorax, the THOR accurately predicted the rate of AIS3+ skeletal injuries, whereas the HIII vastly underpredicted the PMHS injury rate (Table B7, see online supplement). For the acetabula, femurs, and tibias, no AIS2 injuries were observed and the ATDs predicted low injury probabilities (Tables B8–B12, see online supplement). There was no injury risk equation for the TI, but the upper and lower TI for the HIII were below the lower performance limit of 1.3 that Euro NCAP imposes during their frontal sled tests (Table B10).
Discussion
The ISO analysis results indicated that the HIII time history responses were more biofidelic than those of the THOR when all data were pooled/averaged. This result was driven by the HIII’s higher external ISO scores, which in turn were the result of more biofidelic lower extremity excursions and KB reaction forces. The HIII and THOR had similar internal ISO scores. These results differ from those reported by Parent et al. (2017), who observed that the THOR had better internal and external biofidelity compared to the HIII. Discrepancies between these studies can be a result of a multitude of factors. The Parent et al. study had a larger sample size and a wide variety of test conditions ranging from component tests to whole-body sled tests. Limiting the Parent et al. study to only the whole-body tests in order to make a more direct comparison resulted in the HIII having better external biofidelity than the THOR but worse internal biofidelity. Results could also be highly dependent upon the signals included. For example, the higher external ISO scores for the HIII in the current study were driven by the lower extremity responses and the chest deflections, whereas the Parent et al. whole-body sled test analyses did not contain any lower extremity data. It should be noted that most of the score differences between the HIII and THOR were small, and it is unclear what magnitude of difference would correlate to meaningful differences in biofidelity and injury risk prediction.
The comparative biofidelity of the HIII and THOR clearly varied by body region within the current study. For the head, the THOR had more biofidelic responses, on average, compared to the HIII. In terms of injury risk, both ATDs predicted low probabilities of AIS3+ injuries via HIC15 and BrIC, except for 1 HIII KB test. This aligned with the lack of head injuries resulting from the PMHS tests, although in this study, only skull fractures were considered because brain injury could not be evaluated using PMHS. The probabilities of AIS3+ and AIS4+ brain injuries could not be calculated using the proposed NCAP BrIC equation for 4 out of 6 tests for each ATD (8 out of 12 total). For these SWAB tests, the BrIC value was less than 0.523, which resulted in a negative number being raised to a fractional power of 1.8. Because the value of 0.523 was derived from the y-intercept of a trend line relating BrIC value and the cumulative strain damage measure (Takhounts et al. Citation2013), it was assumed that a BrIC value less than 0.523 implies an injury risk probability of 0.
Five out of 8 PMHS tests resulted in at least 1 AIS2 neck injury. These injuries were typically disc separations or anterior endplate fractures. No AIS3 neck injuries were observed. Both ATDs accurately predicted the lack of AIS3+ injuries. Yet, the THOR underpredicted the rate of AIS2+ injuries for both a 40-year-old occupant and an age-matched occupant. The HIII does not have a proposed AIS2+ risk curve for use with Nij from frontal US-NCAP tests, so the initial analysis could not discern whether HIII was able to accurately predict the AIS2+ neck injury risk. However, Albert et al. (Citation2018b) calculated the probability of AIS2+ neck injury for these HIII tests using a risk curve developed by Eppinger et al. (Citation1999). The Eppinger risk curve was developed using a version of Nij that had a different set of critical values compared to the current US-NCAP calculation. Using this risk curve, Albert et al. (Citation2018b) found that the HIII also underpredicted the rate of AIS2+ injury. Therefore, both ATDs were unable to accurately predict the rate of AIS2+ neck injuries.
According to the ISO scores, the HIII exhibited a more biofidelic thoracic response than the THOR. The difference in ISO scores for chest deflection between the HIII (0.598) and THOR (0.529) contributed to this result. It should be noted that the chest deflections used in the ISO analysis were generated using chest bands, as opposed to internal instrumentation, to make direct comparisons between surrogates with incongruous instrumentation. Therefore, these deflections were external to the ATD jackets, meaning compression of the jackets were included in the chest deflection results. Jacket compression is not included in the calculation of chest deflection from the internal HIII and THOR instrumentation. Therefore, it is also is not a factor in current injury risk calculations based on the internal instrumentation. It is unclear how the jackets contributed to the deflections measured by the chest bands and the resulting ISO scores, especially because the designs of the HIII and THOR jackets are substantially different. It is possible that jacket deflections contributed to the HIII’s higher ISO scores and, therefore, better thoracic biofidelity without translating to improved injury risk prediction capabilities. It has been demonstrated with PMHS that injury risk criteria based on multipoint thoracic deflection are more accurate than those based on sternum deflection alone (Kuppa and Eppinger Citation1998). In fact, the current study found that the HIII’s sternum injury risk curve vastly underpredicted the risk of AIS3+ chest injuries compared to the PMHS injury results. Conversely, the THOR’s multipoint criterion was able to accurately predict the PMHS injury occurrence. One possible reason for this discrepancy in injury risk accuracy compared to thoracic response biofidelity was previously discussed by Albert et al. (Citation2018a). The HIII injury risk curve was developed using a very conservative definition of AIS3 rib fracture injuries, based on an older version of AIS and the observation that the number (severity) of rib fractures is underdiagnosed in real-world data, leading to lower AIS scores in the real-world data compared to functionally equivalent PMHS laboratory tests (Laituri et al. Citation2005). Essentially, the risk curve was developed requiring a much higher number of rib fractures in PMHS tests in order to code them as AIS3+. Therefore, Albert et al. (Citation2018a) recoded the PMHS injuries to account for this. However, they observed that the HIII still underpredicted the rate of AIS3+ injuries. Therefore, the definition of AIS3 rib fracture used to generate the risk curve could not alone explain the HIII’s inaccurate injury predictions. Other factors such as single vs. multipoint deflection and response biofidelity may also contribute.
As noted above, the HIII showed better lower extremity biofidelity than the THOR. This was the result of HIII knee bolster forces and knee excursions being more similar to the PMHS responses. Reasons for the HIII’s better performance are difficult to identify due to the complexity of the loading environment. The THOR has a longer and more compliant femur than the HIII (Rupp et al. Citation2003; Mueller et al. Citation2011). To account for anthropometry differences, the knees of both ATDs were positioned the same distance away from the KB/KBAB foams. Nevertheless, other differences in initial position may have contributed to the results. The THOR and HIII also have different pelvis and abdomen designs, which would influence lap belt interaction and lower extremity responses. In fact, the THOR lap belt forces matched the PMHS response more closely. It is impossible to ascertain how each of these factors contributed to the lower extremity responses as a whole, but the results underline the necessity of evaluating lower extremity responses in realistic vehicle environments.
Some limitations of this study are as follows. This study was conducted using a specific vehicle’s geometry, NCAP crash pulse, and restraint conditions, so the results may not be representative of other conditions. Vehicles are specifically designed to prevent injuries to 50th percentile males under frontal NCAP conditions. Consequently, only a narrow range of injuries, mostly to the neck and chest, were observed during these tests. The lack of injuries to other body regions limited the analysis of injury prediction accuracy. Performing tests under a range of conditions that can produce both injury and non-injury cases for several body regions would provide a better basis for such an analysis. The injury risk analysis was also limited by PMHS sample size; larger samples would provide a better estimate of the true injury rate. Furthermore, the biofidelity analysis was constrained to responses that could be measured across all surrogates. Given that PMHS instrumentation techniques are limited and HIII has less instrumentation than the THOR, many of the THOR’s measurable responses could not be assessed for biofidelity.
The relationship between time history response biofidelity and accurate injury risk prediction is not always clear, especially when measurable responses are not directly linked to injury criteria. This study sought to integrate internal and external time history analysis with injury prediction analyses to better evaluate the overall biofidelity of the HIII and THOR. Though the HIII had marginally better time history biofidelity, the THOR had an advantage in regard to accurate injury prediction. For each body region, each ATD had particular strengths and weaknesses. The THOR has another advantage over the HIII in terms of breadth and quantity of instrumentation, many of which were not evaluated in this study and are not yet linked to injury criteria. More PMHS data are needed to evaluate all of the THOR’s responses and injury prediction accuracy during complex loading environments.
Supplemental Material
Download Zip (10 MB)Acknowledgments
This research would not be possible without the generous contribution of the anatomical donors and their families.
Additional information
Funding
References
- Albert DL, Beeman SM, Kemper AR. 2018a. Assessment of thoracic response and injury risk using the Hybrid III, THOR-M, and post-mortem human surrogates under various restraint conditions in full-scale frontal sled tests. Stapp Car Crash J. 62:1–65.
- Albert DL, Beeman SM, Kemper AR. 2018b. Evaluation of Hybrid III and THOR-M neck kinetics and injury risk under various restraint conditions during full-scale frontal sled tests. Traffic Inj Prev. 19(sup2):S40–S47. 10.1080/15389588.2018.1524141
- Albert DL, Beeman SM, Kemper AR. 2018c. Occupant kinematics of the Hybrid III, THOR-M, and postmortem human surrogates under various restraint conditions in full-scale frontal sled tests. Traffic Inj Prev. 19(sup1):S50–S58. 10.1080/15389588.2017.1405390
- Albert DL, Beeman SM, McNally C, Kemper AR. 2016. Evaluation of rigid polyurethane foam as a surrogate material for knee bolsters and knee bolster airbags in full scale frontal sled tests. Short Communications from AAAM's 60th Annual Scientific Conference. Traffic Inj Prev. 17(sup1):205–208.
- Been B, Ellway J. 2018. THOR specification and certification. Version 1.0; Document Number: TB 026. European New Car Assessment Programme. https://cdn.euroncap.com/media/41774/tb-026-thor-specification-and-certification-v10.201811091328013342.pdf
- Craig M, Parent D, Lee E, Rudd R, Takhounts E, Hasija V. 2020. Injury criteria for the THOR 50th male ATD. Washington (DC): National Highway Traffic Safety Administration, US Department of Transportation.
- Eppinger R, Sun E, Bandak F, Haffner M, Khaewpong N, Maltese M, Kuppa S, Nguyen T, Takhounts E, Tannous R, et al. 1999. Development of improved injury criteria for the assessment of advanced automotive restraint systems–II. Washington (DC): National Highway Traffic Safety Administration; p. 1–70.
- US Department of Transportation. 2015. Part V. National Highway Traffic Safety Administration Consumer Information: New Car Assessment Program. Fed Regist. 80:78522–S78591.
- Hagedorn A, Stammen J, Ramachandra R, Rhule H, Thomas C, Suntay B, Kang Y-S, Kwon HJ, Moorhouse K, Bolte JH, IV, et al. 2022. Biofidelity evaluation of THOR-50M in rear-facing seating configurations using an updated biofidelity ranking system. SAE Int J Trans Safety. 10(2):291–375. 10.4271/09-10-02-0013
- ISO. 2014. Road vehicles – objective rating metric for non-ambiguous signals. ISO/TS 18571.
- Kuppa SM, Eppinger RH. 1998. Development of an improved thoracic injury criterion. SAE Technical Paper 0148-7191.
- Laituri TR, Prasad P, Sullivan K, Frankstein M, Thomas RS. 2005. Derivation and evaluation of a provisional, age-dependent, AIS3+ thoracic risk curve for belted adults in frontal impacts. SAE Technical Paper 0148-7191.
- Mertz HJ. 1993. Anthropomorphic test devices. In: Nahum AM, Melvin JW, editors. Accidental injury: biomechanics and prevention. New York (NY): Springer-Verlag. p. 66–84.
- Mueller BC, Sherwood CP, Arbelaez RA, Zuby DS, Nolan JM. 2011. Comparison of Hybrid III and THOR dummies in paired small overlap tests. Stapp Car Crash J. 55:379–409. 10.4271/2011-22-0014
- Parent D, Craig M, Moorhouse K. 2017. Biofidelity evaluation of the THOR and Hybrid III 50th percentile male frontal impact anthropomorphic test devices. Stapp Car Crash J. 61:227–276. 10.4271/2017-22-0009
- Rupp J, Reed M, Madura N, Schneider L. 2003. Comparison of knee/femur force-deflection response of the THOR, Hybrid III and human cadaver to dynamic frontal impact knee loading. Paper presented at: Proceedings: International Technical Conference on the Enhanced Safety of Vehicles, Nagoya, Japan.
- SAE. 2014. Instrumentation for impact test – part 1 – Electronic Instrumentation. J211/1_201403.
- Takhounts EG, Craig MJ, Moorhouse K, McFadden J, Hasija V. 2013. Development of brain injury criteria (BrIC). Stapp Car Crash J. 57:243–266. 10.4271/2013-22-0010
- Wang ZJ. 2022. Biomechanical responses of the THOR-AV ATD in rear facing test conditions. SAE Technical Paper 0148-7191.