Abstract
Objective
Belt-positioning booster seats (BPB) and pre-pretensioner (PPT) belts may be effective in preventing injuries from submarining and head excursion in reclined children. It is unknown if injuries at the neck and spine could still occur. This study’s goal is to characterize neck and spine responses in reclined children with and without the BPB and the PPT.
Methods
Eleven frontal impact sled tests were performed (56 kph) with the Large Omnidirectional Child (LODC) dummy on a production vehicle seat. A 3-point simulated seat-integrated-belt was used with a load-limiter (∼4.5 kN). Testing was conducted with and without the BPB with the seatback at ∼25°, ∼45° and repeated once. One test was conducted at ∼60° with the BPB. 100 mm of belt-slack was removed to simulate PPT in two 45° BPB tests and the BPB 60° test. The LODC peak thoracic spine accelerations and angular rotations, and peak neck and lumbar force/moment loads were compared between conditions.
Results
Neck shear forces were the highest in the 60° BPB & PPT (−1.9 kN) and 45° noBPB (−1.3 kN) than all other BPB conditions (−0.5 to −0.8 kN). The highest peak neck moments were found in the 45° noBPB (−40.5 N-m), and in the 60° BPB & PPT (−34.2 N-m) conditions compared to all others (−20.8 to −27.9 N-m.). The 60° BPB and PPT condition demonstrated thoracic forward rotation similar to the 25° noBPB condition (25° noBPB −24.8 to −35.0 deg, 60° BPB&PPT −27.5 to −43.2 deg.). Thoracic spine peak resultant accelerations (T1, T6, T12) were higher in the 25° and 45° noBPB conditions (53 g to 71 g) and in the 60° BPB & PPT (T6: 61.8 g) compared to all other BPB conditions (48.4 g to 53.1 g). The lumbar peak shear forces and moments were the highest in the 45° noBPB (4.9 kN, −296 N-m) and the 60° BPB & PPT condition (1.7 kN, −146 N-m).
Conclusion
These findings show similarities in neck, spine, and lumbar responses between the 60° reclined condition with BPB and PPT and the 25° and 45° conditions without the same countermeasures. This study highlights the need for future restraint developments to protect moderate and severe reclined BPB-seated child occupants.
Introduction
Adults riding in autonomous vehicles (AV) were found to prefer sitting in reclined positions (Jorlöv et al. Citation2017). Reclined occupants pose a challenge on current vehicle restraint systems (Forman et al. Citation2019). One field study of current production type vehicle seats indicated reclined adult occupants are associated with greater risk of MAIS 2+ and MAIS 3+ injuries compared to properly positioned belted adult occupants (McMurry et al. Citation2018). McMurry and colleagues’ review stated that injured reclined adult occupants sustained cervical spine fractures, thoracoabominal, lumbar spine, other spine and extremity injuries (Rehm and Goldman Citation2001; Dissanaike et al. Citation2008, via McMurry et al. Citation2018; Thorbole Citation2015).
Injury patterns of children in reclined seats are not well known yet. In pediatric crash injury studies, it was found children secured in nominal vehicle seating positions are getting spinal injuries (Cirak et al. Citation2004; Bilston and Brown Citation2007; Zonfrillo et al. Citation2014). One field study of child (8- to 16-year-old) spinal injuries reported cervical injuries were the most common, but most were minor, and there were very few thoracic spine injuries (Bilston and Brown Citation2007). That same study reported the lumbar spine was the second most injured region but resulted in the most serious injuries. Another study of spinal injuries to children found that cervical and lumbar spine were the most injured regions for children 6- to 14-years-old in all types of accidents where motor vehicle crashes (MVC) accounted for nearly 30% of the cases studied (Cirak et al. Citation2004).
It is unknown how/if these above-described pediatric injury patterns will change in reclined configurations. Other studies have indicated adult and child injury patterns in crashes are different and may require different injury measures (Bilston et al. Citation2011; Rao et al. Citation2014; Zonfrillo et al. Citation2014). It has been reported both non-booster and booster seated children do not sit in optimal positions within the seatbelt during long car rides (Jakobsson et al. Citation2017). In future AVs, it is plausible that children may sit reclined as they see adults being able to do so. Therefore, research that understands how to keep occupants of all ages safe in new AV seating configurations is needed.
Belt positioning booster seats (BPB) route a vehicle seatbelt over the child’s strong bones which prevents the child occupant from submarining and the lap belt from entering the abdominal cavity during a MVC. BPBs also place the shoulder belt on the child’s shoulder away from their neck (Jakobsson et al. Citation2005). Seat lap belt webbing routing, narrow BPB, and a shoulder belt near horizontal are all recommendations for good small occupant restraint (Griffiths et al. Citation2009). Submarining can be reduced with seatbelts that place more downward pressure on the pelvis or thighs providing forward motion restraint, and a more vertical lap belt angle across the thighs, along with a vehicle seat antisubmarine pan. (Griffiths et al. Citation2009).
Previous studies demonstrated that a BPB alone or with pre-pretensioning (PPT) was beneficial in preventing submarining for reclined children (Bohman et al. Citation2022; Graci et al. Citation2022a). One modeling study with a 6-year-old PIPER model found that the belt geometry and belt pretensioner were effective for reducing submarining injuries and head excursion of reclined child occupants (Bohman et al. Citation2022). In the Bohman et al. (Citation2022) study the D-ring placement was modeled in different longitudinal, lateral, or vertical positions to compare different belt geometries. Results found lower and rearward D-ring placements did not lead to submarining compared to other belt configurations.
In the Graci and colleagues’ study (Citation2022a), results focused on measurements that would identify submarining in the LODC in moderate seatback recline angles. In the same study only the lumbar spine axial forces were considered. No other spine forces, or spine moments nor neck forces and moments were examined. In the same study no severe reclined conditions were reported. Lumbar axial forces were found to increase with increasing seatback recline angles for booster seated children (Graci et al. Citation2022a). However, it is not clear how the thoracic spine, the neck and the lumbar shear forces differed in both moderate and severe reclined seatback angles from the nominal seatback angle. This study expands the findings from Graci et al. (Citation2022a) study by adding a severely reclined condition, and assessing neck and spine responses of the LODC under all conditions.
Increased lumbar compression forces, as in Graci et al. (Citation2022a), were also found in modeling studies of adult sized reclined occupants (Rawska et al. Citation2019; Grébonval et al. Citation2021). Results from those studies also found lumbar forces were reduced when the occupant submarined. Graci et al. (Citation2022a) also found that without the BPB in the moderate reclined seatback angle the lumbar forces decreased when submarining occurred. Reclined occupants who do not submarine may be susceptible to lumbar injuries due to a combination of flexion moment and compression forces (Östling et al. Citation2021). These findings from the lumbar spine forces in reclined BPB child occupants indicate the importance of characterizing the spine responses for reclined children, although submarining can be prevented by the BPB, spine injuries may still occur.
Most current reclined adult occupant studies have focused on abdominal or lumbar injuries due to submarining (Uriot et al. Citation2015; Rawska et al. Citation2019; Richardson et al. Citation2020). Richardson et al. (Citation2020) found during reclined adult PMHS sled testing where submarining was prevented, pelvis, sacrum and lumbar injuries were present. One conclusion of that study also noted the motivation for lumbar spine and pelvis injury metrics.
Currently, the primary method of determining the child occupant safety in the United States is the Federal Motor Vehicle Safety Standard (FMVSS) No. 213 which is a performance standard for child restraints. The standard mainly addresses head and chest injury by head acceleration and chest acceleration, and head and knee excursions. The neck, chest deflection, thoracic spine, and lumbar spine are not considered in any regulatory standard for child ATDs.
While the above-mentioned previous studies and the regulatory standards are good measures, there may be additional factors which need attention to protect reclined children in future seating configurations. Other factors such as neck loads, thoracic spine accelerations, and lumbar loads need to be taken into consideration for overall injury reduction. This study’s goal is to examine how neck and spine responses are affected by seatback recline angles from nominal to severe, booster seat use, and pre-pretensioner belt by using the Large Omnidirectional Child (LODC) ATD in frontal crash simulations.
Methods
Testing was conducted with the LODC (Stammen et al. Citation2016; Seacrist et al. Citation2019) seated with three seatback angle positions: nominal (∼25 deg.), moderate recline (∼45 deg.) and severe recline (∼60 deg.). The LODC was used in this study as it has an adjustable and flexible spine that make it suitable for studies examining reclined postures (Prasaad Citation2019; Suntay et al. Citation2021; Graci et al. Citation2022a).
Testing was conducted with and without a no-back BPB and a pre-pretensioned (PPT) 3-point simulated integrated belt system. An integrated belt geometry was used as it was found that the shoulder belt-torso contact is advantageous in reclined occupants (Forman et al. Citation2019; Bohman et al. Citation2022) and the absence of the shoulder belt-torso contact in reclined passengers could lead to catastrophic injuries (Dissanaike et al. Citation2008). The PPT was only used for the reclined BPB conditions. The belt system was mechanically load limited to 4.5 kN (Somasundaram et al. Citation2022). Two tests were conducted of each configuration except the severe recline (). The target delta-v of 56 km/h was near the average delta-V of 51 kph found in a field study exploring spinal injuries of occupants under 18-years-old (Zonfrillo et al. Citation2014), and the NHTSA NCAP and FMVSS 208 vehicle frontal testing programs. The target pulse peak acceleration, 24.5 G, was below the upper acceleration boundary of the United States Federal Motor Vehicle Safety Standard (FMVSS) 213 pulse corridor (NHTSA Citation2014) ().
Table 1. LODC frontal test matrix, recline angle, BPB, belt tension, and number of tests conducted.
The LODC was secured on a BPB placed on a production right front vehicle seat, 2007–2012 Toyota Yaris, and on the vehicle seat only with the lap and shoulder belt. The BPB manufacturer instructions were followed. The vehicle seats were sourced used from salvage yards. and were inspected for any damage before testing (Graci et al. Citation2022a).
The B-pillar and D-ring assembly were adjustable in 3 dimensions and positioned closely to simulate a seat integrated belt system (Somasundaram et al. Citation2022). The lap and shoulder belt webbing were initially tensioned between 9 and 18 N (NHTSA Citation2014). When the belt was pre-pretensioned, 100 mm of belt webbing was pulled in after the initial tension was set (Pipkorn and Wass Citation2017). In our study, we tightened the belt before sled onset to simulate a pre-pretension, although there were no mechanical or pyrotechnic pretensioner mechanisms used. Seven panel belt webbing (NHTSA Citation2014) was used together with the Toyota Yaris latch plate and buckle. The buckle and lower lap anchor were secured in the stock locations as the Toyota Yaris (Graci et al. Citation2022a). Vehicle seats, belt webbing, and BPBs were replaced for each test.
The LODC was instrumented with head 3-dimensional linear accelerometers and angular rate sensors, six-axis upper neck load cell, thoracic spine 3-dimensional linear accelerometers and angular rate sensors at T1, T6 and T12, and a six-axis lumbar load cell. Seat belt load cells were secured on the lap and shoulder belt. Resultant accelerations and angular displacements in the sagittal plane were extracted and their time series were examined.
The following outcome measures were compared between conditions: peak head resultant acceleration and peak angular displacement (sagittal plane), upper neck peak axial and shear forces and peak forward moment, lumbar peak shear force (lumbar axial forces were reported in Graci et al. Citation2022a, Citation2022b) and peak forward moment, T1, T6, T12 peak resultant accelerations and peak angular displacements and trends (sagittal plane). Thoracic angular rotations were relative to the vehicle seat to determine the ATD motion globally on the sled across the different seating configurations. SAE J211 (2014) standards were followed for data collection and processing. The peaks were defined as the minimum or maximum values within the time series region of interest, defined as the region between acceleration onset and the rebound time (approximately 125 ms window). High speed digital video cameras placed onboard and offboard captured the tests.
Results
The mean time-history curve was determined for each condition from the two tests performed, except for the 60° BPB PPT condition, which only had one test performed. The peak (i.e. maximum or minimum) was extracted from the mean curve during the region of interest. Some result comparisons to IARV (Mertz et al. Citation2003) or performance values (NHTSA Citation2014) are presented for reference only and have not been validated for the LODC to date.
Head
Peak head acceleration was highest for the 45° noBPB condition (79.5 g) compared to all other conditions. Among all the BPB conditions, peak head acceleration for the 45° BPB PPT (70.0 g) was the highest and the 25° BPB (50.6 g) was the lowest. Peak head acceleration was overall similar between all reclined conditions with the BPB (range: 67–70 g) (). None of the tests exceeded the recommended maximum IARV, 190 G (Mertz et al. Citation2003) for resultant head accelerations.
The peak head angular displacements were larger with the BPB than the noBPB conditions. The largest displacement was observed for the 45° BPB (−128.5 deg.) and the smallest for the 45° noBPB (−86.7 deg.). All the reclined BPB conditions demonstrated similar magnitudes, between −123.0 degrees and −128.5 degrees. The 25° BPB condition had the lowest angular displacement among all the BPB conditions (−118.6 deg.) ( and ).
Figure 1. Time series of head rotational displacements of all conditions. Positive values represent rearward rotation while negative values represent forward rotation.
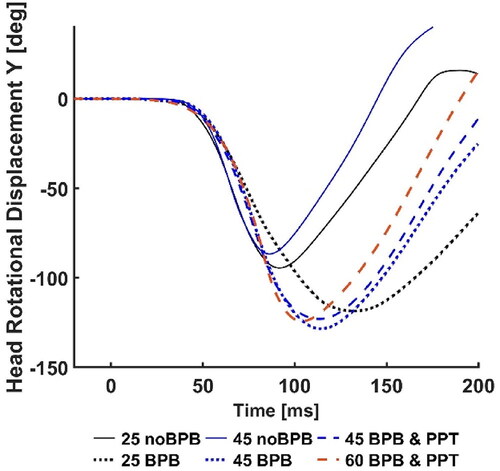
Figure 2. Mean and SD of Head Y angular rotation and displacement. Error bars represent standard deviations. Negative values represent forward rotation.
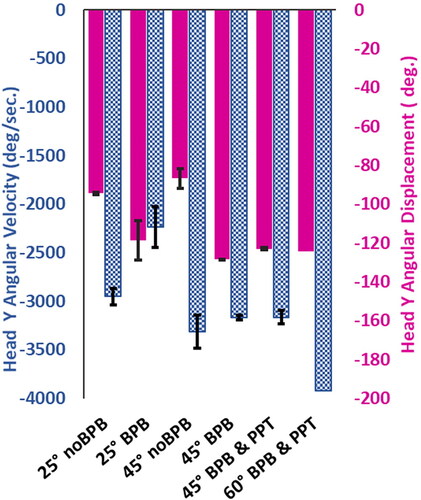
Head peak angular velocities increased with increasing seatback angles and were higher for all the noBPB compared to all the BPB conditions, including the nominal conditions. The largest peak rotational velocity was during the 60° BPB PPT (−3921 deg/sec). The 25° BPB condition had the lowest rotational velocity (−2235 deg/sec). With noBPB, the moderate recline condition had the highest rotational velocity (−3313 deg/sec) ().
Upper neck
The neck axial forces were the highest in the 25° noBPB and 45° noBPB conditions (3.4 kN and 4.3 kN). The lowest axial force was found in the 25° BPB condition (1.9 kN). The highest axial force among the BPB conditions was observed during the 45° tests with and without the PPT (2.9 kN). Among the reclined conditions with the BPB, the neck axial force was lower for the 60° BPB PPT than both 45° BPB (). Only the 25° BPB condition was below the neck tension IARV, 2.3 kN (Mertz et al. Citation2003).
Figure 3. Mean and SD peak upper neck shear and tension forces. Error bars represent standard deviations and dashed bars represent IARVs (Mertz et al. Citation2003).
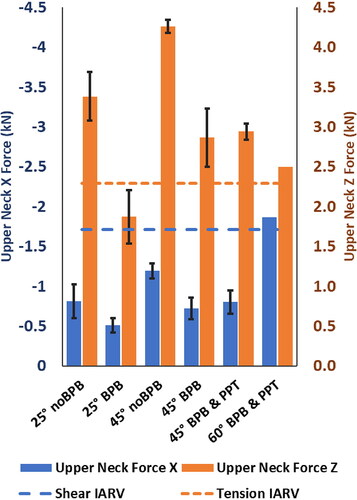
In the noBPB condition, the 45° test had the highest neck shear force (−1.2 kN) followed by the 25° noBPB (−0.8 kN). Among the BPB conditions the neck shear force was the highest in the 60° BPB PPT (−1.9 kN) and lowest in the 25° BPB (−0.5 kN). The neck shear force was similar between the 45° BPB and 45° BPB PPT (−0.7 kN and −0.8 kN). The shear forces increased with the increase of the recline angle for both BPB and noBPB conditions (). Only the 60° BPB condition was above the neck shear IARV, 1.7 kN (Mertz et al. Citation2003).
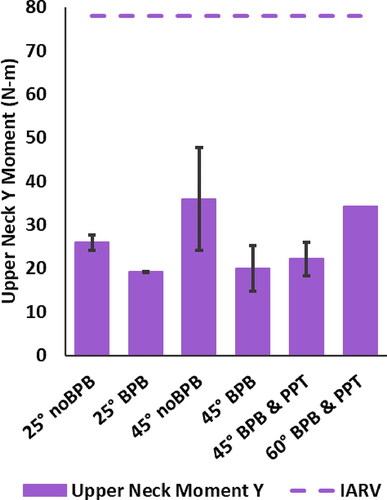
The 45° noBPB condition demonstrated the highest sagittal plane moment compared to all conditions, 35.9 Nm. Similarly, the 60° BPB PPT showed the highest sagittal plane moments, 34.2 Nm among the BPB conditions. For both BPB and noBPB conditions the moments increased as the seatback angle increased. In the 45° with BPB conditions, there was a slight increase in the upper neck moment with the addition of the PPT (45° BPB, 20.0 Nm vs. 45° BPB PPT, 22.2 Nm). All neck moments were below the 78 Nm IARV for flexion (Mertz et al. Citation2003) ().
Figure 4. Mean and SD peak upper neck moments. Error bars represent standard deviations. Forward flexion is represented as positive and dashed bars represent IARVs (Mertz et al. Citation2003).
Thoracic spine
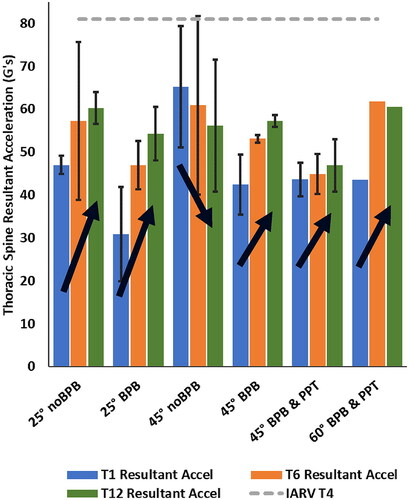
The thoracic spine peak accelerations were generally higher at T1, T6, and T12 for the noBPB conditions compared to the BPB conditions. For T1 the highest acceleration was measured in the 45° noBPB (65.2 g), and the lowest in the 25° BPB (30.9 g). Among the condition with the BPB, the highest T6 and T12 peak accelerations were observed in the 60° BPB PPT (61.8 g and 60.6 g). Typically, in the BPB conditions, the thoracic peak accelerations increased with the seatback angle increase. The peak acceleration increased from T1 to T12 for all tests except the 45° noBPB where the accelerations decreased from T1 to T12 (). None of the spine acceleration positions exceeded the recommended IARV, 81 g, for the T4 thoracic spine acceleration as a reference point (Mertz et al. Citation2003).
Figure 5. Mean and SD peak thoracic spine resultant accelerations. Error bars represent standard deviations and dashed bars represent IARV for T4 (Mertz et al. Citation2003).
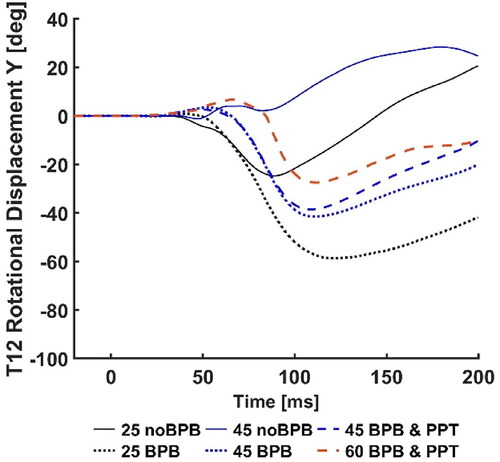
The thoracic spine peak angular displacement occurred during forward rotation (flexion) of the trunk, except for T12 in the 45 noBPB condition. The reported values are absolute and relative to the vehicle seat to determine the ATD motion globally on the sled. The highest peak values for T1, T6 and T12 occurred during the 25° BPB tests, and the lowest in the 45° noBPB. Both the noBPB and BPB conditions, demonstrated less flexion as the seatback angles increased. The 45° noBPB T12 angular displacement trended toward rearward rotation (extension) at approximately 50 ms, while T1 and T6 remained stable between 0- and 12-degrees forward rotation and going rearward at approximately 100 ms. During the 60° BPB PPT condition, T6 and T12 showed slight rearward rotation (2- and 6-degrees, respectively) but continued forward at approximately 75 ms. The T6 and T12 angular displacement for 60° BPB PPT had similar trends as the 45° noBPB for approximately the first 75 ms. After that time, the T6 and T12 rotations for the 60° BPB PPT begin to trend forward while the 45° noBPB trends rearward through the tests ().
Figure 6. Mean and SD peak thoracic spine sagittal angular displacements. Error bars represent standard deviations. Negative values represent forward rotation.
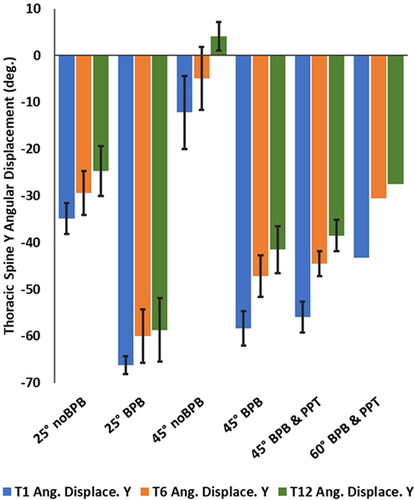
Figure 7. Time series of T1 rotational displacements of all conditions. Positive values represent rearward rotation while negative values represent forward rotation.
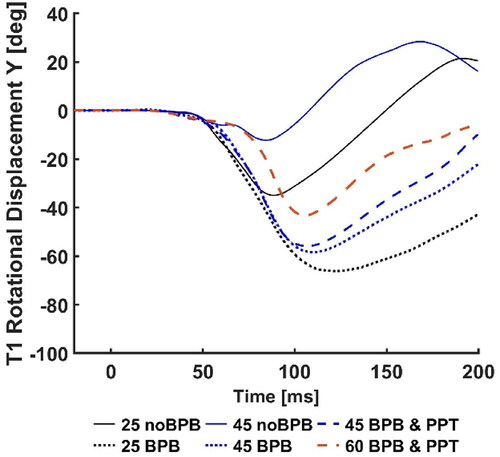
Figure 8. Time series of T6 rotational displacements of all conditions. Positive values represent rearward rotation while negative values represent forward rotation.
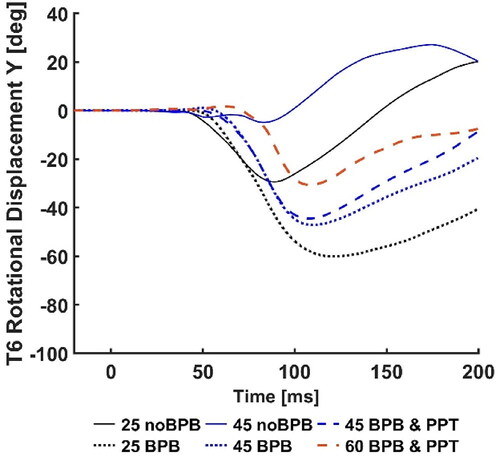
Figure 9. Time series of T12 rotational displacements of all conditions. Positive values represent rearward rotation while negative values represent forward rotation.
Lumbar spine
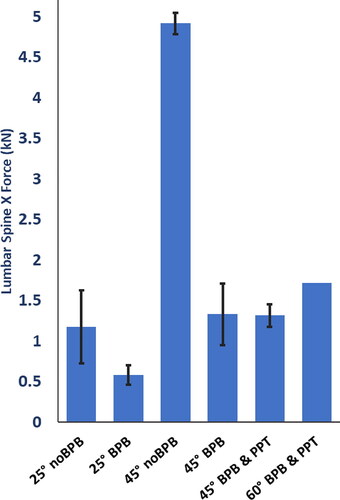
For the 45° noBPB condition, the highest shear force (4.9 kN) was observed, while the lowest shear force (0.6 kN) was observed for the 25° BPB condition. The 60° BPB PPT test demonstrated the highest shear force (1.7 kN) for the BPB conditions (). Lumbar spine axial force results are presented in Graci et al. (Citation2022a, Citation2022b).
Figure 10. Mean and SD peak lumbar spine shear forces. Error bars represent standard deviations.
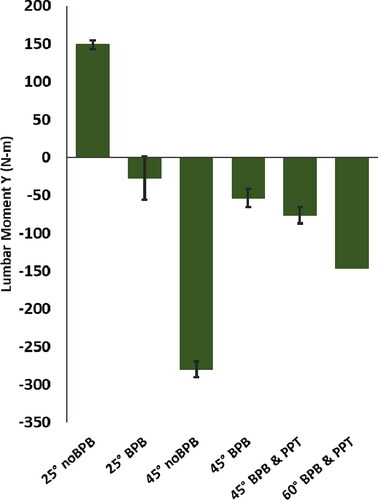
The peak sagittal moments demonstrated more extension with increasing seatback angles for both BPB and noBPB conditions. The highest moments for all conditions were observed for the 45° noBPB (−280 N-m). For the BPB conditions, the moments increased with a higher seatback angle starting from −27 N-m during the 25° BPB tests up to −146 N-m for the 60° BPB PPT. The 25° noBPB test recorded the only flexion moment peak magnitude (148 N-m) ().
Figure 11. Mean and SD peak lumbar sagittal moments. Error bars represent standard deviations. Forward flexion is represented as positive.
Lap and shoulder belt
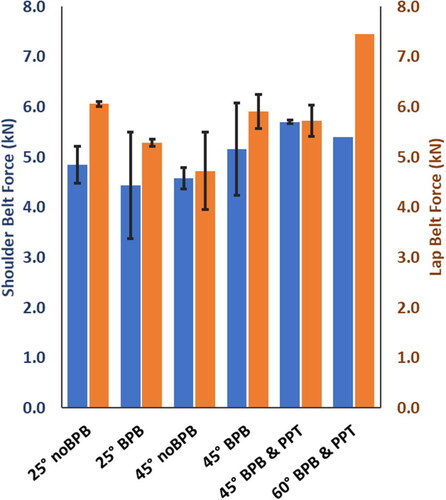
Lap belt forces were highest during the 60° BPB PPT (7.5 kN) compared to all tests; the 25° noBPB had the highest lap belt forces for the noBPB tests (6.1 kN). The lowest lap belt force was observed during the 45° noBPB (4.7 kN). Shoulder belt forces were load limited to approximately 4.5 kN and during the tests, peaks ranged from 4.4 kN (25° BPB) to 5.7 kN (45° BPB PPT) ().
Discussion
This study characterizes spine responses in reclined seated children by testing the LODC ATD in reclined versus nominal seatback configurations with and without a BPB and PPT belt. Overall, the LODC demonstrated the most favorable neck and spine responses in the baseline nominal seatback using the BPB. We considered favorable the LODC responses in recline seatback configurations if near or below IARVs and other performance standards, or the baseline nominal BPB condition.
In our study peak head resultant accelerations did not demonstrate any likely injury values for any recline angle regardless of BPB or PPT belt use. The resultant accelerations were below the 10-year-old head IARV (Mertz et al. Citation2003) (). The head data does not appear to show injury potential in the reclined mode while other metrics appear to demonstrate larger variances when the ATD is reclined and while secured with the BPB. Peak head angular forward velocities increased with the increase in recline seatback angle and particularly without the BPB. Currently there are no established critical values for the 10 YO child for brain injury, but the adult brain injury critical value for peak head angular forward velocity is 3,234 deg/s for BRiC calculations. Head angular velocity and in our testing the LODC exceeded this value in the severe reclined condition, and in the moderate reclined condition without the BPB. However, caution must be exercised in relating this value to injury as we tested a child ATD.
Our previous study indicated that while the BPB prevented the LODC from submarining as seatback angles increased (Graci et al. Citation2022a). Compressive loads acting at the lumbar spine also increased with the increased reclined seatback angles with the BPB present (Graci et al. Citation2022a). In this study our findings indicate that even with the presence of the BPB, there is an increased loading acting at the spinal cord in severe reclined configurations. Increased neck shear forces, neck moments, T6 and T12 accelerations, lumbar shear forces and moments were found with the severe reclined seatback angles with the BPB conditions, which correspond to the conditions when the LODC ATD did not submarine (Graci et al. Citation2022a). Furthermore, in this study the highest neck tension forces, neck moments, T1 and T6 accelerations, lumbar shear forces, and lumbar moments were found in the moderate reclined configuration without the BPB (when the LODC submarined), while the lumbar axial forces were low (Graci et al. Citation2022a). Accordingly, low lumbar forces were associated with small thoracic spine rotations in the 45 noBPB condition. The small thoracic spine rotations for the reclined ATD may be an indicator of the LODC sliding forward and under the lap belt rather than flexing over or into the belt. This is in line with the fact that the T1, T6, and T12 angular displacements were highest in the 25° with BPB condition, where submarining was not previously found (Graci et al. Citation2022a).
In our study the LODC demonstrated increased neck forces and moments as the seatback angle increased similarly to the Bohman et al. (Citation2022) study performed with the 6-year-old PIPER model. The forces at the neck show how the presence of the BPB in reclined configurations does not mitigate neck axial and shear forces. With the presence of the BPB neck shear forces were the highest in the 60 BPB & PPT condition, and neck tension forces were the highest in the 45 BPB and 45 BPB &PPT conditions (). There was little variation between in the 45 BPB and 45 BPB & PPT conditions for the neck forces and moments while Bohman et al. (Citation2022) found slight neck tension reductions in the moderate reclined PIPER model with an active pretensioner belt. The discrepancy between our study on Bohman’s may be due to the differences between pretensioner and PPT: the pretensioner trigger during the impact and higher forces, while the PPT is triggered before the impact and with forces lower than 200 N.
Increased resultant thoracic accelerations and lumbar axial compression for the reclined LODC may be related to increased accelerations aligning with the LODC spine (ATD Z component) during the crash pulse. Richardson et al. (Citation2020) reported that the combined lumbar spine compression and flexion resulted in lumbar fractures of reclined adult PMHS. They reported that the injury cause may be related to combined loading during the reclined positions due to the initial pelvis rearward pitch and the larger and later thoracolumbar flexion. Tushak et al. (Citation2022) study of adult isolated lumbar spine specimens during combined loading reported that frequently the failure force occurred before the peak forces previously reported for adult specimens. Our findings, together with previous literature, suggest that thoracic flexion and pelvis rotation time history trends may be important to monitor.
Both modeling and physical test studies have demonstrated increased lumbar forces and moments for reclined adult occupants (Rawska et al. Citation2019; Grébonval et al. Citation2021; Östling et al. Citation2021). When the occupant is restrained with the 3-point belt and a BPB, the lap belt is routed over the thighs and/or lower pelvis. The lap belt routing influences the ATD response into the seat, and as the seatback is reclined the lumbar spine aligns more with the longitudinal crash pulse (Rawska et al. Citation2019), which was represented in the above results. The LODC and BPB move forward and down into the vehicle seat during the sled acceleration. Subjective inspection of the production vehicle seats post-test found the seat structure deformed more as the seatback angle was increased, also implying the seat may be a contributor to higher lumbar compression forces.
Rawska et al. (Citation2019) study of F05th%, M50th% and M95% computational models report that as occupants’ size was reduced and seatback angles increased, lumbar axial loads and bending moments increased absent any submarining. There was no submarining of the LODC ATD when the BPB was used in this current study. This current study demonstrated the increased lumbar axial force and lumbar moment from a 25° nominal seatback without the BPB up to the 60° severe seatback angles with the LODC secured in a BPB. Increases of lumbar compression forces imply potential for compression fractures. Increasing lumbar moments may indicate a possibility of flexion-distraction injuries. Currently there are no performance standards for the LODC. The increasing trends at the lumbar must be considered for future possible reclined AV seating and child restraints.
This study has some limitations; only one BPB seat, vehicle seat, belt system, and crash pulse were evaluated. The vehicle seat was older and no longer used in current vehicles. Although different CRS and vehicle seat geometry may lead to different results, the differences between seatback angle conditions within the same seats model should still be valid. Two tests were conducted for five of the conditions and only one for the severe recline condition, more iterations may better solidify our findings. Although there were these limitations, the results of this study aligned well with the current reclined occupant research.
In conclusion, while the BPB prevented the LODC from submarining during the moderate and severe recline condition there were increased cervical and lumbar spine forces and moments, which may indicate a small occupant may need additional or different countermeasures in reclined seats. Our study found an increase of forces, moments, acceleration, and rotational displacements to the LODC spine as seatbacks were changed from the nominal position to a severe recline while the BPB was in use. Previous research has suggested that reclined seating was preferred for autonomous vehicle occupants (Jorlöv et al. Citation2017). However, in order to make reclined child occupants a safe reality, future countermeasures may have to include different belt systems, other advanced restraints, or, if current restraints are used, seatback recline positions will need to be restricted while vehicles are in motion. The results of our study indicate there may be a threshold for spine injury potential between a moderate recline and severe recline conditions with the combined moments and forces occurring on the spine.
Acknowledgements
The authors would like to acknowledge the Center for Child Injury Prevention Studies at The Children’s Hospital of Philadelphia (CHOP) and The Ohio State University (OSU) for sponsoring this study and its Industry Advisory Board (IAB) for their support, valuable input, and advice. The views presented are those of the authors and not necessarily the views of MCW, CHOP, OSU, or the IAB members.
Additional information
Funding
References
- Bilston LE, Brown J. 2007. Pediatric spinal injury type and severity are age and mechanism dependent. Spine. 32(21):2339–2347.
- Bilston LE, Clarke EC, Brown J. 2011. Spinal injury in car crashes: Crash factors and the effects of occupant age. Inj Prev. 17(4):228–232. doi:10.1136/ip.2010.028324
- Bohman K, El-Mobader S, Jakobsson L. 2022. Effects of restraint parameters using PIPER 6y in reclined seating during frontal impact. Traffic Inj Prev. 23(sup1):S123–S129. doi:10.1080/15389588.2022.2125304
- Cirak B, Ziegfeld S, Knight VM, Chang D, Avellino AM, Paidas CN. 2004. Spinal injuries in children. J Pediatr Surg. 39(4):607–612. doi:10.1016/j.jpedsurg.2003.12.011
- Dissanaike S, Kaufman R, Mack CD, Mock C, Bulger E. 2008. The effect of reclined seats on mortality in motor vehicle collisions. J Trauma Acute Care Surg. 64(3):614–619. doi:10.1097/TA.0b013e318164d071
- Forman J, Lin H, Gepner B, Wu T, Panzer M. 2019. Occupant safety in automated vehicles: effect of seatback recline on occupant restraint. IJAE. 10(2):139–143. doi:10.20485/jsaeijae.10.2_139
- Graci V, Hauschild H, Maheshwari J, Humm J. 2022a. The effect of the moderately reclined seatback angle on the Large-Omnidirectional-Child Anthropomorphic Test Device with and without a belt-positioning booster in frontal crashes. Traffic Inj Prev. 23(sup1):S117–S122. doi:10.1080/15389588.2022.2097668
- Graci V, Hauschild H, Maheshwari J, Humm J. 2022b. The effect of a severe reclined seatback on the kinematics of the booster seated Large-Omnidirectional-Child Anthropomorphic Test Device. Proceedings from International Research Council on Biomechanics of Injury, Porto, Portugal. September 2022. IRC-22-74.
- Grébonval C, Trosseille X, Petit P, Wang X, Beillas P. 2021. Effects of seat pan and pelvis angles on the occupant response in a reclined position during a frontal crash. PLoS One. 16(9):e0257292. doi:10.1371/journal.pone.0257292
- Griffiths M, Brown J, Kelly P. 2009. Safer child restraints for children 6 to 10 years. Proceedings of the 21st International Conference on the Enhanced Safety of Vehicles. p. 1–8.
- Jakobsson L, Bohman K, Stockman I, Svensson M, Wimmerstedt M, Arbogast K. 2017. Rear seat safety for children aged 4–12: identifying the real-world needs towards development of countermeasures. Proceedings of 25th International ESV Conference, June. p. 17.
- Jakobsson L, Isaksson-Hellman I, Lundell B. 2005. Safety for the growing child: Experiences from Swedish accident data. Proceedings of 19th International Technical Conference on the Enhanced Safety of Vehicles. Washington, DC: National Highway Traffic Safety Administration, June.
- Jorlöv S, Bohman K, Larsson A. 2017. Seating positions and activities in highly automated cars–a qualitative study of future automated driving scenarios. International Research Conference on the Biomechanics of Impact, IRCOBI, September. p. 13–22.
- McMurry TL, Poplin GS, Shaw G, Panzer MB. 2018. Crash safety concerns for out-of-position occupant postures: a look toward safety in highly automated vehicles. Traffic Inj Prev. 19(6):582–587. doi:10.1080/15389588.2018.1458306
- Mertz HJ, Irwin AL, Prasad P. 2003. Biomechanical and scaling bases for frontal and side impact injury assessment reference values (No. 2003-22-0009). SAE Technical Paper.
- NHTSA. 2014. Laboratory test procedure for federal motor vehicle safety standards 213 child restraint systems.
- Östling M, Lundgren C, Lubbe N, Huf A, Wernicke P, Pipkorn B. 2021. The influence of a seat track load limiter on lumbar spine compression forces in relaxed, reclined, and upright seating positions: a sled test study using THOR-50M. International Research Conference on the Biomechanics of Impact. IRC-21-46.
- Pipkorn B, Wass J. 2017. Pre-crash triggered pretensioning of the seat belt for improved safety. ESV.
- Prasaad A. 2019. ATD seating in highly recline seats. SAE Government Industry Meeting.
- Rao RD, Berry CA, Yoganandan N, Agarwal A. 2014. Occupant and crash characteristics in thoracic and lumbar spine injuries resulting from motor vehicle collisions. Spine J. 14(10):2355–2365. doi:10.1016/j.spinee.2014.01.038
- Rawska K, Gepner B, Kulkarni S, Chastain K, Zhu J, Richardson R, Perez-Rapela D, Forman J, Kerrigan JR. 2019. Submarining sensitivity across varied anthropometry in an autonomous driving system environment. Traffic Inj Prev. 20(sup2):S123–S127. doi:10.1080/15389588.2019.1655734
- Rehm CG, Goldman RK. 2001. Seat belt and car seat in a reclined position: A dangerous combination. J Trauma Acute Care Surg. 51(6):1189–1191.
- Richardson R, Donlon J-P, Jayathirtha M, Forman JL, Shaw G, Gepner B, Kerrigan JR, Östling M, Mroz K, Pipkorn B. 2020. Kinematic and injury response of reclined PMHS in frontal impacts. Stapp Car Crash J. 64:83–153. doi:10.4271/2020-22-0004
- SAE International Surface Vehicle Recommended Practice. 2014. Instrumentation for impact test, SAE J211.
- Seacrist T, Maheshwari J, Graci V, Holt CM, Akkem R, Chingas G, … Palumbo AJ. 2019. Biofidelic evaluation of the large omni-directional child anthropomorphic test device in low speed loading conditions. Stapp Car Crash J. 63:213–234.
- Stammen J, Moorhouse K, Suntay B, Carlson M, Kang Y-S. 2016. The large omnidirectional child (LODC) ATD: biofidelity comparison with the hybrid III 10 year old (No. 2016-22-0017). SAE Technical Paper.
- Suntay B, Stammen JA, Carlson M, Ramachandra R. 2021. Abdominal and thoracic injury risk functions for the Large Omni-directional Child (LODC) ATD. IRCOBI Conference Proceedings, p. 2021–537, 555.
- Somasundaram K, Humm JR, Yoganandan N, Hauschild H, Driesslein K, Pintar FA. 2022. Obese occupant response in reclined and upright seated postures in frontal impacts. Stapp Car Crash J. 66:31–68.
- Thorbole CK. 2015. Dangers of seatback recline in a moving vehicle: How seatback recline increases the injury severity and shifts injury pattern. ASME International Mechanical Engineering Congress and Exposition, November. Vol. 57380. American Society of Mechanical Engineers. p. V003T03A056. doi:10.1115/IMECE2015-51809
- Tushak SK, Donlon JP, Gepner BD, Chebbi A, Pipkorn B, Hallman JJ, … Kerrigan JR. 2022. Failure tolerance of the human lumbar spine in dynamic combined compression and flexion loading. J Biomech. 135:111051.
- Uriot J, Potier P, Baudrit P, Trosseille X, Richard O, Douard R. 2015. Comparison of HII, HIII and THOR dummy responses with respect to PMHS sled tests. Proceedings of the International Research Conference on the Biomechanics of Impact, IRCOBI, Lyon, France, 9th September–11th September. IRC-15-55.
- Zonfrillo MR, Locey CM, Scarfone SR, Arbogast KB. 2014. Motor vehicle crash–related injury causation scenarios for spinal injuries in restrained children and adolescents. Traffic Inj Prev. 15(sup1):S49–S55. doi:10.1080/15389588.2014.934959
Appendix
Figure A1. Mean sled acceleration pulse with FMVSS 213 upper and lower corridors.
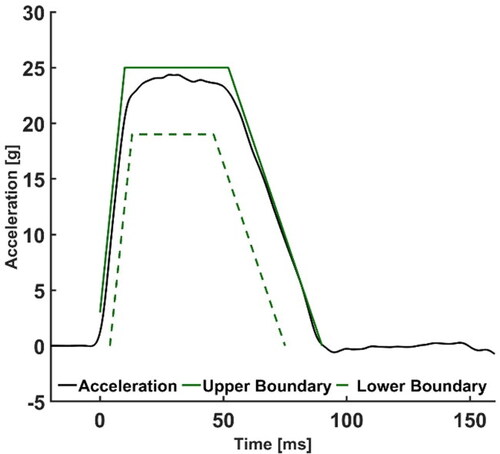
Figure A2. Mean and SD peak head resultant acceleration. Error bars represent standard deviations.
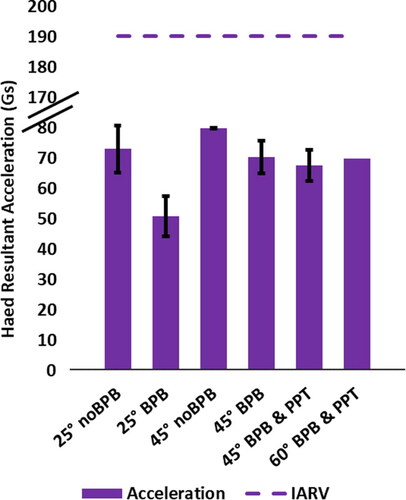
Figure A3. Mean and AD peak shoulder and lap belt forces. Error bars represent standard deviations.