
Abstract
Objective
Taxis have become an integrated component of Qatar’s urban transportation network due to their convenience, comfort, and flexibility. Qatar has seen an uptick in the demand for professional taxi drivers. Most Qatari taxi drivers come from developing countries with poor awareness of road safety; therefore, they regularly engage in aberrant driving behavior, leading to traffic violations and crashes. For taxi rides to be safer, it is essential to determine the association between driving aberration and road traffic crashes (RTCs), with an emphasis on the underlying factors that trigger these behaviors.
Methods
To this end, we collected the data from taxi drivers relying on standard questionnaires, namely the Driving Anger Scale (DAS) and the Driver Behavior Questionnaire (DBQ), together with the real crash data of the same taxi drivers obtained from the police department. We relied on factor analysis to identify the main factors of these tools and then structural equation modeling to predict their causal relationship with RTCs.
Results
The results indicated that the component of DAS, namely “illegal driving”, triggered all dimensions of aberrant driving behaviors, whereas hostile gestures had a positive correlation with lapses. In addition, the factor “error” was identified as a significant direct predictor, while the factor “illegal driving” was identified as a significant indirect predictor for RTCs. Regarding demographic characteristics, professional driving experience was found to be negatively associated with RTCs.
Conclusion
Driving aberration mediated the impact of driving anger on RTCs. The findings from this study could help road safety practitioners and researchers better understand these relations. In addition, these results could also be very helpful for driving instructors to train taxi drivers in a way to cope with provoking situations.
Introduction
Taxis have become a vital and effective means of transportation by providing more convenient, flexible, comfortable, and origin-to-destination services (Wu et al. Citation2016). With the taxi industry’s global expansion and its increasing profitability, severe safety issues concerning taxi trips have developed (Meng et al. Citation2017). Albeit, advancements in taxi services have significantly improved the efficiency and comfort level of trips, the number of road traffic crashes (RTCs), fatalities, and violations associated with taxi drivers continue to perplex transport managers or planners around the world (Meng et al. Citation2017). According to Shi et al. (Citation2014), taxi drivers are involved in a higher number of traffic violations in Beijing, resulting in higher RTCs compared to private drivers. The authors further reported that one-fifth of the taxi drivers in Beijing are involved in at least one RTC every year, which accounts for a significant proportion of the overall RTCs. Similarly, data from several other cultural backgrounds, such Singapore (Lim and Chia Citation2015) shows that taxi drivers, in comparison to other drivers, possess higher risks of becoming involved in severe RTCs with a substantial number of RTCs.
Taxi drivers have a higher rate of RTCs because, in addition to the challenges of daily driving tasks, they also have to deal with hard working conditions and work-related stress (Tseng Citation2013). More specifically, the following could be the reasons that make their work environment challenging, thus distinguishing taxi drivers from other ordinary drivers and increasing the risk of their involvement in unsafe driving behavior: a) interacting with passengers and passengers’ desires to complete their trips quickly; b) the income of a taxi driver rises as the taxi completes more trips and travels for a longer distance in a given period (Ok et al. Citation2021); c) finally, driving for a longer period could also increase fatigue among them. Therefore, taxi drivers are more likely to experience road rage, which can have a negative impact on their behavior behind the wheel. Therefore, it is important to examine the level of aggression and anger and their impacts on road safety among taxi drivers with multicultural driving backgrounds.
Most of the earlier traffic safety studies have focused mainly on general drivers and not professional drivers such as taxi drivers. Taxi drivers are more likely prone to driving anger due to the stressful nature of their work and yet there is limited knowledge on them. The relationship between driving anger and aberrant driving behavior among taxi drivers is therefore not clear.
Study objectives and research questions
This study investigates the relationships between driver anger, aberrant driving behavior and RTCs, considering the multicultural taxi driver population in the state of Qatar. This study will address the following research questions:
What are the factor structures of DAS and DBQ among taxi drivers?
How does anger influence the behavior of taxi drivers behind the wheel?
Do the various dimensions of aberrant driving behaviors and socio-demographic characteristics of taxi drivers contribute to RTCs?
What dimensions of driving anger could indirectly lead to RTCs among taxi drivers?
The article is organized as follows: an introduction, a literature review, a section on methodology, the results, a discussion of the findings, and a conclusion.
Literature review
This section is divided into four sub-sections: literature review on driving anger, aberrant driving behavior, and the association between driving anger and aberrant driving behavior; and research gaps and contribution of the work.
Driving anger
Statistics on RTCs show that human factors play a significant role in approximately 90% of all RTCs (Evans Citation2004). Human factors and driver psychology are linked to a variety of aspects, including driving safety, personality characteristics, and attitudes (Yasak and Esiyok Citation2009). Driving anger as a personality trait is one of the most significant concerns that has been thoroughly studied. Anger is a psychological condition characterized by irritability, wrath, or rage (Zhang et al. Citation2019). “Driving anger” is an emotional concept referring to anger-related thoughts and feelings that arise during driving (Nesbit and Conger Citation2011). Driver anger, accompanied by emotions and thoughts, is probably to divert the drivers’ concentrations away from processing the information needed to perform the main driving tasks (Precht et al. Citation2017). According to Mesken et al. (Citation2007), anger while driving is among the most common feelings being encountered on the road. Driving anger was found to have a positive association with driving distraction Dahlen et al. (Citation2005). To assess driving anger, different tools have been used in the past (Sullman et al. Citation2007). Among them, the shorter version of the Driving Anger Scale (DAS), comprising 14 different anger-provoking scenarios, has been frequently used in the literature (Deffenbacher et al. Citation1994).
Aberrant driving behavior
Aberrant driving behavior appears to be a more direct and stronger indicator of crash risk than driving anger (Zhang et al. Citation2019). Human factors such as errors, distraction, impairment and fatigue have been found to be the main causes behind most RTCs, whereas aggressive driving behaviors could also raise the risk of involvement in a crash by 11.1-fold (Dingus et al. Citation2016), which can be described as aberrant driving behaviors (Zhang et al. Citation2015). The DBQ has been a reliable and valid assessment tool for examining drivers’ self-reported aberrant behaviors in road safety research (Reason et al. Citation1990). Based on the theoretical taxonomy, the items of the DBQ instrument are classified into two main categories: errors and violations (Reason et al. Citation1990). Errors and violations are two different types of behavior because they result from different psychological phenomena. The failure of scheduled activities to accomplish desired outcomes is defined as "error", whereas violations are "planned deviations from those processes deemed essential to assure the safety and reliability of a potentially dangerous system" (Bener et al. Citation2008). Slips and lapses, as a third DBQ component, were introduced by Reason et al. (Citation1990), which includes questions on failure in memory and attention. Lawton et al. (Citation1997) expanded the violation dimension by adding more elements and splitting it into two different scales based on the reasons for violating the laws. Based on their classification, aggressive violations include aggressive behavioral aspects such as honking, swearing at other drivers, tailgating, and showing hostile gestures, whereas ordinary violations are intentional deviations from the practices of safe driving and breaching highway codes but are not aggressive in nature.
The role of driving anger in aberrant and unsafe driving behavior
Driving anger and aberrant driving behaviors have been found to be strongly linked (Zhang and Chan Citation2016). Over the last two decades, driving anger has been frequently employed to study driving behavior among psychological constructs (Deffenbacher et al. Citation2016). Anger has been shown to interfere with human cognitive functions such as judgment (Evans Citation2008) and attention allocation (Schimmack and Derryberry Citation2005), leading to exaggerated optimism and reduced risk assessment in angry people. Therefore, enraged drivers are more inclined to commit traffic violations such as tailgating and speeding (Dahlen et al. Citation2005; Stephens and Groeger Citation2009). Research on British drivers revealed that highly enraged drivers engaged in more risky and aggressive behaviors on roadways (Lajunen and Parker Citation2001). In addition, several studies reported a positive association between driving error and driving anger (Stephens and Groeger Citation2009). However, the association between anger and the aberration link is more complicated than a straightforward positive relationship (Zhang et al. Citation2015). According to Nesbit et al. (Citation2007), driving anger is a heterogeneous construct. Hence, this study focuses on the investigation of the relationships between driving anger and its aberration on a subscale level.
Research gap and contribution
As mentioned in the literature above, most traffic safety studies have focused solely on self-reported crash data, which may be susceptible to underreporting bias. Drivers may report fewer crashes than they really were engaged in due to memory lapses, fear of getting penalized, and social desirability bias. Traffic safety may be better understood with the use of real-world crash data. Therefore, it is essential to investigate the relationships between the subjective assessments of human factors and real-world crash data. Thus, our study fills that gap in the literature by investigating the relationship between self-reported DAS, DBQ, and actual crash data among professional taxi drivers in Qatar. Qatar creates a special context for our study due to its heterogeneous population and the fact that its taxi drivers come mainly from developing countries with low traffic safety cultures. Taxi drivers, being the most regular drivers on urban roads, are an appropriate sample for this study since they are often exposed to situations that may provoke anger within themselves.
Methods
This section discusses the questionnaire development, data collection, and data analysis methodologies employed in this research study.
Structure of the questionnaire
The data in this study were collected using a questionnaire survey approach. The questionnaire was divided into three sections: a) questions regarding the demographic characteristics; b) the standard DAS questionnaire to measure driving anger; and c) the standard DBQ questionnaire to measure aberrant driving behavior.
Demographic variables
The first portion of the questionnaire contained questions about the respondents’ demographic characteristics, such as age, marital status, gender, educational level, nationality and professional driving experience.
Driver anger scale (DAS)
The short version of the DAS developed by Deffenbacher et al. (Citation1994) is among the most extensively adopted questionnaires to measure driving anger. This tool includes 14 scenarios of different driving situations that could provoke anger. Respondents were asked to rank their degree of anger in each scenario on a five-point Likert scale (1 = not at all, 2 = a little, 3 = some, 4 = much, and 5 = very much).
Driver behavior questionnaire (DBQ)
The 27-item DBQ (Lawton et al. Citation1997) was used in the third section to collect data for measuring aberrant driving behavior. The items of the DBQ are used to measure the aberrant behavior of drivers on the road. On a six-point Likert scale, respondents rated how often each of the 27 aberrations occurred during the previous 12 months (1 = never, 2 = hardly ever, 3 = occasionally, 4 = quite often, 5 = frequently, and 6 = nearly all the time).
Data collection measures
The data were collected from taxi drivers of the Karwa driving school, which is the sole public transportation operator in Qatar that offers a wide range of services (such as public bus and taxi services). With the cooperation and coordination of the administrative staff of the Karwa driving school, 361 professional taxi drivers who were willing to participate in the survey were selected at random. The researchers divided the selected respondents into 10 to 15 person groups. They were briefed to respond to questions anonymously and return the questionnaire at the end of the session. Taxi drivers in Qatar are primarily from South Asian and African countries. Based on the recommendation of the Karwa driving school staff, the English version of the questionnaire was translated into three languages: Arabic, Hindi, and Sinhala. The Institutional Review Board of Qatar University granted ethical approval for this questionnaire. Before responding to the questionnaire, all respondents were asked to sign a written informed consent form.
The recorded actual crash data for each participant over the previous four years (2018–2021) was provided by the Mowasalat Karwa Driving School in collaboration.
Statistical analysis
For analysis, such as descriptive statistics and exploratory factor analysis, the Statistical Package for the Social Sciences (SPSS 27.0) was employed. Exploratory factor analysis (EFA) was conducted to analyze the factor structure of the DBQ and DAS among professional taxi drivers from various cultural backgrounds in the state of Qatar, utilizing principal component analysis (PCA) with the varimax rotation approach. The Kaiser criterion of eigenvalues > 1.0 and Cattell Scree plot were used to compute the number of construct. The scree plot is a graphical representation of eigenvalues (Cattell Citation1966). They typically rank eigenvalues in descending order from highest to lowest. The clear break “elbow” indicates the number of components the analysis should yield. Using the limitation criteria suggested by Tabachnick and Fidell Citation(2007), items with factor loadings of at least 0.45 are appropriate indicators of the underlying construct.
Cronbach’s alpha (CA) and composite reliability (CR) were used to assess construct internal consistency. The value of CA represents the intercorrelations between variables, which is also sensitive to the number of items in each factor (Ringle et al. Citation2015). To obtain satisfactory internal reliability, CA and CR values should be greater than 0.60 for exploratory research (Hair et al. Citation2011). To assess the construct validity, discriminant and convergent analyses were used. Convergent validity indicates the extent to which different measurements of a variable that theoretically should be related are in fact related (Gefen et al. Citation2000). Discriminant validity refers to the degree to which two constructs are different from each other (Taherdoost Citation2016). For convergent validity, the average variance extracted (AVE) statistic is usually used. The value of AVE should be greater than 0.50 to satisfy this validity (Hair et al. Citation2011). On the other hand, for discriminant validity, the Fornell and Larcker criterion is usually used, which specifies that the square root of AVE for the construct must be higher than its correlation with other constructs in the study.
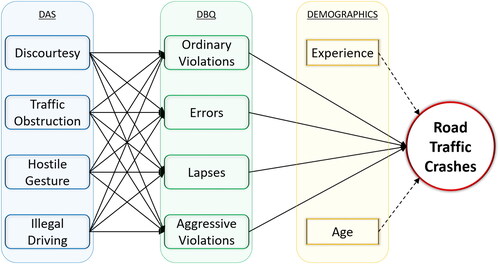
As mentioned above the main aim of the study was to investigate the causal relationships between driving anger, driving behavior, and RTCs experienced during the last four years. A structural equation model (SEM) was employed to identify these causal relationships. The SEMs are theory-oriented causal networks used to analyze complex models with a high number of predictors and responses, as well as complicated causal relationships (Grace et al. Citation2010). shows the SEM developed in this study. In this regard, the components of driving anger served as exogenous variables in the model, while the number of RTCs experienced during the last four years served as the main endogenous variable. In addition, constructs of aberrant driving behavior were loaded into the model to play as mediating variables between driving anger and RTCs. To this end, our model is capable of testing the direct relationships between driving anger and aberrant driving behavior, as well as between aberrant driving behavior and RTCs. Moreover, the model offers indirect relationships between driving anger factors and RTCs through mediation of aberrant driving behavior. Finally, the effect of demographic variables such as age and professional driving experience on crashes is controlled by including direct causal links (Zhang et al. Citation2019). For SEM, SMART-PLS software with the PLS algorithm approach (version 3.3) was utilized. Smart PLS offers the capability to incorporate several multivariate approaches into a unified model, such as measurement theory, factor analysis, path analysis, internal consistency, validation, along with simultaneous equations. A bootstrapping technique was used in the model to investigate the direct and indirect relationships. PLS-SEM is variance-based and can accommodate the non-normally distributed data because it does not assume normality of the data (Fauzi Citation2022).
Figure 1. SEM Model with direct and indirect causal relationships.
Results
The results are presented in four different sections. The results are presented in four different sections. The descriptive results of the sample and crash data are presented in Section 1. The factor structures of the DAS and DBQ are presented in the second section, followed by the results of the reliability and validity analyses and the results of the structural equation modeling (SEM).
Descriptive analysis
A total of 361 male taxi drivers responded to the questionnaires, out of which 17 respondents were removed because their data were incomplete. Thus, a final sample of 344 respondents was considered for analyses. The age of the respondents ranged from 24 to 66 years (Mean: 37.6; SD: 6.4), with over 65% of the respondents being under the age of 40 years as shown in Table 1A in Appendix A). Regarding ethnicity, African taxi drivers accounted for approximately 69%, while Asian drivers accounted for up to 31%. Regarding the educational level of the respondents, only 22% possessed bachelor’s or higher degrees, while 78% had educational levels equivalent to a high school diploma or below. Most of the respondents were married (with children 68.0%; without children 7.9%), and 24.1% were single. Regarding professional driving experience, the mean was 9.1 years (SD: 5.4). The Professional driving experience is counted after completing driving training, passing the road signal, driving tests, and driving for work purposes.
Table 1. CA, CR, AVE and Fornell-Larcker criterion for DAS factor.
The mean of the road crash data over four years was 8.5, with a standard deviation of 5.5 and a variance of 31.1. The skewness of the four-year crash data is 1, as shown in Table 1A in Appendix A, indicating that the data is moderately skewed.
Driving anger scale
Factor structure
Cattell’s Scree test revealed a clear break between the fourth and other points, indicating a four-factor solution, as shown in Table 2A in Appendix A. This was further supported by the eigenvalue criteria (Kaiser criterion of eigenvalues > 1.0). The resulting four-factor solution explained 69.4% of the common variances. The first factor (i.e., Discourtesy), labeled “DC” in Table 2A (see Table 2A in Appendix A), loaded four items ranging from 0.82 to 0.86 with an eigenvalue of 4.2 (variance 29.7%). With another four items loaded between 0.76 and 0.85, the second factor (i.e., Traffic Obstruction, labeled “TO”) explained 16.1% of the variance with an eigenvalue equal to 2.3. The third factor (i.e., Hostile Gesture, labeled “HG”) loaded three items ranging from 0.85 to 0.88 with an eigenvalue of 1.9 (variance = 13.7%). Finally, the fourth factor (i.e., Illegal Driving, labeled “ID”) has four items, which have a loading ranging from 0.69 to 0.77 (eigenvalue = 1.4; variance = 9.9%).
Table 2. Cronbach’s alpha, CR, AVE and Fornell-Larcker criterion for the DBQ factor.
Reliability and validity
The Cronbach’s alpha results confirmed that the first three factors (i.e., DC, TO and HG) obtained excellent internal consistency, with values of 0.86, 0.85, and 0.85, respectively (see ). The fourth factor (i.e., ID) had a satisfactory CA value of 0.61. The results also showed that the CR value for all four factors was higher than 0.60. It can also be read from that the convergent validity for each of the four constructs is higher than 0.50, and in regard to the discriminant validity, the square roots of AVEs are higher than the intercorrelation.
Aberrant driving behavior
Factor structure
For DBQ, Cattell’s Scree Test revealed a clear break between the fourth and other points, indicating a four-factor solution, as shown in Table 3A in Appendix A. The four-factor structure of DBQ was also supported by the eigenvalue criteria (the Kaiser criterion of eigenvalues > 1.0). The resulting four-factor solution explained 83.9% of the common variances. The first factor (i.e., ordinary violation) labeled as “OV” in Table 3A (see Table 3A in Appendix A) loaded ten items ranging from 0.82 to 0.91 with an eigenvalue of 10.3 (variance 38.1%). With another eight items loaded between 0.81 and 0.92, the second factor (i.e., Error, labeled as “E) explained 22.4% of the variance with an eigenvalue equal to 6.0. The third factor (i.e., Lapses, labeled “L”) loaded six items ranging from 0.86 to 0.93 with an eigenvalue of 4.2 (variance = 15.4%). Finally, the fourth factor (i.e., Aggressive Violation, labeled as “AV”) has three items, which have a loading ranging from 0.89 to 0.92 (eigenvalue = 2.2; variance = 8.0%).
Table 3. Path analysis.
Reliability and validity
The Cronbach’s alpha results confirmed that all four factors (i.e., OV, E, L and AV) obtained excellent internal consistency, with values of 0.98, 0.97, 0.97 and 0.93, respectively (see ). The results also showed that the CR value for all four factors was higher than the threshold value of 0.60. It can also be read from that the convergent validity for each of the four constructs is higher than 0.50, and in regard to the discriminant validity, the square roots of AVEs are higher than the intercorrelation coefficients.
Structural equation modeling
shows the results of the SEM estimations for the significant relations only in three sections split by dotted lines. The result of a direct relationship between the various aspects of driving anger and aberrant behavior is presented in the first section of . Interestingly, the DAS factor "Illegal Driving" showed a significant positive relationship with all factors of the DBQ. This factor’s estimated coefficients for "Ordinary Violations" are (β = 0.21, p < .01), "Errors" are (β = 0.23, p < .01), "Lapses" are (β = 0.13, p = .04), and "Aggressive Violation" are (β = 0.20, p <.01). This means that observing the illegal driving of other drivers on the road (e.g., someone running a red light or weaving in and out of traffic) triggered the taxi drivers to drive aberrantly. The component of driving anger "hostile gesture" was also significant for the factor "Lapses" of the DBQ with positive estimated values (β = 0.11, p = .04), meaning that the higher the drivers’ aggression level, the greater the chances of a driver’s involvement in lapses.
The second section of shows the results of a direct relationship between the number of RTCs experienced over the last four years and aberrant behavior factor, age, and professional driving experience. The error significantly predicted the number of RTCs, with an estimated coefficient of (β = 0.11, p = .04). This finding suggests that taxi drivers who perform driving duties with a higher number of errors are more likely to be involved in RTCs. In terms of demographic variables, the results showed that professional driving experience has a significant relationship with RTCs with a negative estimated coefficient (β = −0.21, p = <.001), which means that more experienced drivers are involved in fewer RTCs. Additionally, the results showed that there was a significant association between age and the number of RTCs, with a positive estimated coefficient (β = 0.13, p = .03).
The final section of illustrates the indirect relationship between DAS components and RTCs, with the DBQ variables serving as mediators. The results revealed a significant relationship between the DAS factor "Illegal driving" and RTCs with a positive estimated coefficient (β = 0.05, p = .01), indicating that the illegal driving of other drivers is more likely to provoke taxi drivers’ anger on the road and lead to RTCs. Pearson’s correlation was employed to investigate if there was any direct association between driving anger and RTCs. The findings revealed no statistically significant relationship between anger and RTCs.
Discussion
The primary objective of the study was to investigate the relationship between DAS and RTCs with DBQ serving as a mediating tool. Furthermore, this study also investigated the factor structure of self-reported DAS and DBQ using a taxi driver sample from Qatar. In this respect, the first research question was “What are the factor structures of DAS and DBQ among taxi drivers?”. We found four factor structures for the short version of the DAS, in contrast to three factor structures (Zhang et al. Citation2015) and one factor structure (Deffenbacher et al. Citation1994). The difference between the factor structure of the shorter version of the DAS in this study and that of the aforementioned studies could be because professional drivers do not necessarily replicate nonprofessional drivers in regard to driving anger (Feng et al. Citation2016). The validation of the four-factor structure adds credence to the concept of driving anger as a heterogeneous construct (Nesbit et al. Citation2007). The four-factor structure (Ordinary Violations, Errors, Lapses, and Aggressive Violations) found for DBQ adopted in this study is aligned with the four-factor structure reported by Bener et al. (Citation2008). Two items of factor lapses (drive on the improper driving lane while approaching a junction and read traffic lights wrongly when tuning left or right at an intersection) were loaded in the ordinary violation factor column. These items may be interpreted as traffic violations and could probably be because taxi drivers have demanding schedules, time constraints, and other distractions, so they might be involved in such aberrant behavior intentionally (Davey et al. Citation2007). The DBQ's four-factor structure supported the universal nature of its factor structure.
The second research question was “How does anger influence the behavior of taxi drivers behind the wheel?”. Regarding the anger–aberration association, the findings supported the broadly acknowledged positive anger-aberration relationships (Zhang and Chan Citation2016; Zhang et al. Citation2019). The results also showed illegal driving of other drivers highly encourages taxi drivers to behave aberrantly. Moreover, the results also revealed that anger provoked by hostile gestures from other road users contributed to failures in memory and attention. However, other dimensions including discourtesy and traffic obstruction of driving anger did not predict any aspect or pattern of aberrant driving behavior. This could be explained by the fact that taxi drivers might have been used to unpleasant road situations due to constantly interacting with other road users (Miyamoto et al. Citation2008). The results are also in line with the literature showing that the strength of the relationship between anger and aberration on the road varied based on the type of driving anger (Zhang et al. Citation2015; Zhang et al. Citation2019).
To the best of our knowledge, previous studies (Davey et al. Citation2007; Zhang et al. Citation2019) have used self-reported crash data in traffic safety research. However, self-reports of crashes are biased by deliberate or inadvertent misrepresentation (Elander et al. Citation1993). The source of bias can be either a failure to remember incidents or drivers’ different conceptions of reportable accidents (Lajunen and Özkan Citation2011). Therefore, we used real-world (recorded) crash data to better comprehend the factors that contribute to drivers’ involvement in RTCS. In light of this, the third research question was “Do the various dimensions of aberrant driving behaviors and sociodemographic characteristics of taxi drivers contribute to RTCs?” Regarding this direct relationship between driving aberration and RTCs, the SEM findings revealed that error predicted RTCs experienced by taxi drivers over the past four years. Our study result is in line with the result reported by de Winter and Dodou (Citation2010), who also found error to be a crash predictor. Our study’s findings are also in line with statistics for German drivers, which reported that driving error was responsible for 66% of all RTCs in 2015 (Statistisches Bundesamt 2016 cited in Brandenburg et al. Citation2017). Taxi drivers drive for a living, so they spend more time behind the wheel on the road. While investigating the safety culture of taxi drivers, Geshlagi et al. (Citation2019) discovered that drivers who drive throughout the day are more likely to make driving errors. Making more driving errors raises the likelihood of a crash, so this could probably be the reason for their involvement in RTCs. The results also showed that professional driving experience had a negative correlation with RTCs, which is in line with the findings of a previous study (Zhang et al. Citation2019). This indicates that more experienced drivers were involved in fewer accidents during the past four years. However, we found a positive relationship between age and RTCs. This could be because older taxi drivers, are more likely to have chronic illness and financial stress with added responsibilities thus may make frequent driving errors, resulting in their involvement in RTCs. Traffic violations were not found to be significant crash predictors. This could be due to the hefty traffic fines in Qatar, such as 6,000 QAR for running a red light, which may discourage professional taxi drivers from intentionally committing violations to avoid high traffic fines that could negatively affect their earnings. This finding is also supported by a previous study showing that professional drivers reported lower traffic violation rate between 2017-2018, i.e., 81% did not commit a traffic violation while 13% had one traffic violations a year (Timmermans et al. Citation2019).
Furthermore, the fourth research question was “What dimensions of driving anger could indirectly lead to RTCs?”. Regarding the indirect relationship between anger and crashes, we found that "Illegal Driving", the component of DAS, positively correlated with the number of RTCs experienced. This implies that not all aspects of driving anger led to crashes. The result also explains that anger–crash relationships previously established using an overall driving anger scale as a single factor (Dahlen et al. Citation2005) have obscured the real subscale impacts. The taxi drivers probably could get angry due to time pressure resulting from their tight schedules and the profit-driven nature of their profession (Li et al. Citation2021). The poor geometric design of infrastructure, such as the unavailability of taxi lanes, narrow roadways, insufficient parking space, and ineffective traffic management, resulting in traffic congestion and delays, also trigger anger among taxi drivers behind the wheel (Mehri et al. Citation2019). Illegal driving, which includes actions that reflect an intentional deviation from traffic regulations, is actually a violation. When taxi drivers observe violations on the road, they could commit the same violation. A strong relationship between conformity (inclination to alter behavior to correspond to those of others) and aberrant driving behavior explains this fact (Nordfjærn and Şimşekoğlu Citation2014). In addition, no significant direct relationship between driving anger and RTCs was found. This is consistent with previous research reported by Dahlen et al. (Citation2005) and Zhang et al. (Citation2019). This might be explained by the accident prediction theory proposed by Elander et al. (Citation1993), which suggests that driving anger is a distal component that can lead to proximal components such as aberrant driving behaviors. Furthermore, driving anger is an emotional concept that interferes with human cognitive abilities (Schimmack and Derryberry Citation2005; Evans Citation2008) and has a direct impact on driving behavior (Zhang et al. Citation2015).
Among other demographic variables, level of education, and marital status have no significant impact on crashes. Another demographic variable, nationality, also has no significant impact on RTCs. This could be because all Qatari taxi drivers are from developing countries, where a culture of traffic safety seems to be nearly non-existent (Khanal and Sarkar Citation2014).
This study has some limitations. The main limitation is that it is dependent on the taxi driver self-reported data for driving anger and aberrant driving behaviors. Hence, it might be prone to social desirability bias.This study only considers taxi drivers, so its findings cannot be generalized to all professional drivers. Furthermore, since the questionnaire was translated from English into three other languages, there may be some misconceptions. However, to minimize such misconceptions, the questionnaire was translated by experts.
Conclusion
This study explored a four-factor structure for the short version of the DAS and the DBQ among professional taxi drivers in a diverse traffic culture environment. . The PLS-SEM technique was used to investigate the influence of driving anger on RTCs, using BDQ as a mediator. In the model, the DAS and DBQ constructs served as exogenous and mediating variables respectively. Instead of the self-reported number of RTCs, the endogenous variables of the model was the actual number of RTCs recorded by the police during the past four years of employment of the taxi drivers.The taxi driver demographics were included in the model as control variables. The results showed that aberrant driving behaviors mediated the effect of driving anger on the number of RTCs. Furthermore, the degree and direction of the correlation in the mediated model were dependent on the specific dimension of aberrant driving behaviors and driving anger.
Based on our results, effective strategies for anger management could be developed for taxi drivers to improve driving behavior on the roads of the state of Qatar. A face-to-face anger management counseling session should be arranged for taxi drivers in their companies or driving schools. Future studies can test the effectiveness of available anger management tools to mitigate driving anger or come up with new strategies that addresses anger specifically while driving. The positive association between age and RTCs could also be investigated in future studies for professional taxi drivers in Qatar to determine the reason for the increase in crash rates with age.
Supplemental Material
Download Zip (20.3 KB)Acknowledgment
This study was made possible by the internal grant award [QUCG-CENG21/22-2] from Qatar University. The statements made herein are solely the responsibility of the authors. Open Access funding provided by the Qatar National Library. In addition, the authors would like to thank Mr. Robert Makondo, director of Karwa Driving School of Mowasalat, and his team for supporting the data collection.
Disclosure statement
No potential conflict of interest was reported by the authors.
Additional information
Funding
References
- Bener A, Ozkan T, Lajunen T. 2008. The driver behaviour questionnaire in Arab Gulf countries: Qatar and United Arab Emirates. Accid Anal Prev. 40(4):1411–1417. doi:10.1016/j.aap.2008.03.003
- Brandenburg S, Oehl M, Seigies K. 2017. German taxi drivers’ experiences and expressions of driving anger: are the driving anger scale and the driving anger expression inventory valid measures? Traffic Inj Prev. 18(8):807–812. doi:10.1080/15389588.2017.1316493
- Cattell RB. 1966. The scree test for the number of factors. Multivariate Behav Res. 1(2):245–276. doi:10.1207/s15327906mbr0102_10
- Dahlen ER, Martin RC, Ragan K, Kuhlman MM. 2005. Driving anger, sensation seeking, impulsiveness, and boredom proneness in the prediction of unsafe driving. Accid Anal Prev. 37(2):341–348. doi:10.1016/j.aap.2004.10.006
- Davey J, Wishart D, Freeman J, Watson B. 2007. An application of the driver behaviour questionnaire in an Australian organisational fleet setting. Transport Res Part F: Traffic Psychol Behav. 10(1):11–21. doi:10.1016/j.trf.2006.03.001
- de Winter JC, Dodou D. 2010. The driver behaviour questionnaire as a predictor of accidents: a meta-analysis. J Safety Res. 41(6):463–470. doi:10.1016/j.jsr.2010.10.007
- Deffenbacher JL, Oetting ER, Lynch RS. 1994. Development of a driving anger scale. Psychol Rep. 74(1):83–91. doi:10.2466/pr0.1994.74.1.83
- Deffenbacher JL, Stephens AN, Sullman MJ. 2016. Driving anger as a psychological construct: twenty years of research using the Driving Anger Scale. Transport Res Part F: Traffic Psychol Behav. 42:236–247. doi:10.1016/j.trf.2015.10.021
- Dingus TA, Guo F, Lee S, Antin JF, Perez M, Buchanan-King M, Hankey J. 2016. Driver crash risk factors and prevalence evaluation using naturalistic driving data. Proc Natl Acad Sci U S A. 113(10):2636–2641. doi:10.1073/pnas.1513271113
- Elander J, West R, French D. 1993. Behavioral correlates of individual differences in road-traffic crash risk: an examination method and findings. Psychol Bull. 113(2):279–294. doi:10.1037/0033-2909.113.2.279
- Evans JS. 2008. Dual-processing accounts of reasoning, judgment, and social cognition. Annu Rev Psychol. 59:255–278. doi:10.1146/annurev.psych.59.103006.093629
- Evans L. 2004. Traffic safety. Bloomfield Hills, MI: Science Serving Society. p. 179.
- Fauzi MA. 2022. Partial Least Square Structural Equation Modelling (PLS-SEM) in knowledge management studies: knowledge sharing in virtual communities. Knowledge Manage E-Learning. 14(1):103–124.
- Feng Z, Lei Y, Liu H, Kumfer WJ, Zhang W, Wang K, Lu S. 2016. Driving anger in China: a case study on professional drivers. Transport Res Part F: Traffic Psychol Behav. 42:255–266. doi:10.1016/j.trf.2016.09.023
- Gefen D, Straub D, Boudreau MC. 2000. Structural equation modeling and regression: guidelines for research practice. CAIS. 4(1):7. doi:10.17705/1CAIS.00407
- Geshlagi RA, Moshfeghi P, Alizadeh SS, Damanab PS, Tehrani MM. 2019. Studying the driving safety culture in taxi drivers in Tabriz City, Iran. Int J Occup Hygiene. 11(3):212–219.
- Grace JB, Anderson TM, Olff H, Scheiner SM. 2010. On the specification of structural equation models for ecological systems. Ecol Monogr. 80(1):67–87. doi:10.1890/09-0464.1
- Hair JF, Ringle CM, Sarstedt M. 2011. PLS-SEM: indeed a silver bullet. J Market Theory and Practice. 19(2):139–152. doi:10.2753/MTP1069-6679190202
- Khanal M, Sarkar P. 2014. Road safety in developing countries. J Civil Environ Eng. s2(2). doi:10.4172/2165-784X.S2-001
- Lajunen T, Parker D. 2001. Are aggressive people aggressive drivers? A study of the relationship between self-reported general aggressiveness, driver anger and aggressive driving. Accid Anal Prev. 33(2):243–255. doi:10.1016/s0001-4575(00)00039-7
- Lajunen T, Özkan T. 2011. Self-report instruments and methods. In Handbook of traffic psychology. United States: Academic Press. p. 43–59.
- Li Z, Man SS, Chan AHS, Wang R. 2021. Driving anger scale validation: relationship of driving anger with the aberrant driving behaviour of truck drivers. Transport Res Part F: Traffic Psychol Behav. 81:364–372. doi:10.1016/j.trf.2021.06.018
- Lawton R, Parker D, Manstead AS, Stradling SG. 1997. The role of affect in predicting social behaviors: the case of road traffic violations. J Appl Social Pyschol. 27(14):1258–1276. doi:10.1111/j.1559-1816.1997.tb01805.x
- Lim SM, Chia SE. 2015. The prevalence of fatigue and associated health and safety risk factors among taxi drivers in Singapore. Singapore Med J. 56(2):92–97. doi:10.11622/smedj.2014169
- Mehri M, Khazaee-Pool M, Arghami S. 2019. Phenomenology of being a safe taxi driver. BMC Public Health. 19(1):1753. doi:10.1186/s12889-019-8106-1
- Meng F, Xu P, Wong SC, Huang H, Li YC. 2017. Occupant-level injury severity analyses for taxis in Hong Kong: a Bayesian space-time logistic model. Accid Anal Prev. 108:297–307. doi:10.1016/j.aap.2017.08.010
- Mesken J, Hagenzieker MP, Rothengatter T, De Waard D. 2007. Frequency, determinants, and consequences of different drivers’ emotions: an on-the-road study using self-reports, (observed) behaviour, and physiology. Transport Res Part F: Traffic Psychol Behav. 10(6):458–475. doi:10.1016/j.trf.2007.05.001
- Miyamoto M, Konno S, Gembun Y, Liu X, Minami K, Ito H. 2008. Epidemiological study of low back pain and occupational risk factors among taxi drivers. Ind Health. 46(2):112–117. doi:10.2486/indhealth.46.112
- Nesbit SM, Conger JC. 2011. Evaluation of cognitive responses to anger-provoking driving situations using the articulated thoughts during simulated situations procedure. Transport Res Part F: Traffic Psychol Behav. 14(1):54–65. doi:10.1016/j.trf.2010.09.006
- Nesbit SM, Conger JC, Conger AJ. 2007. A quantitative review of the relationship between anger and aggressive driving. Aggr Violent Behav. 12(2):156–176. doi:10.1016/j.avb.2006.09.003
- Nordfjærn T, Şimşekoğlu Ö. 2014. Empathy, conformity, and cultural factors related to aberrant driving behaviour in a sample of Urban Turkish drivers. Saf Sci. 68:55–64. doi:10.1016/j.ssci.2014.02.020
- Ok J, Kim H, Kang K. 2021. Comparison of physical, occupational, and sociocognitive characteristics of corporate and private taxi drivers in Korea. Healthcare (Basel). 9(2):224. doi:10.3390/healthcare9020224
- Precht L, Keinath A, Krems JF. 2017. Effects of driving anger on driver behavior–Results from naturalistic driving data. Transport Res Part F: Traffic Psychol Behav. 45:75–92. doi:10.1016/j.trf.2016.10.019
- Reason J, Manstead A, Stradling S, Baxter J, Campbell K. 1990. Errors and violations on the roads: a real distinction? Ergonomics. 33(10-11):1315–1332. doi:10.1080/00140139008925335
- Ringle C, Da Silva D, Bido D. 2015. Structural equation modeling with the SmartPLS. Brazilian J Marketing. 13(2). doi:10.5585/remark.v13i2.2717
- Schimmack U, Derryberry D. 2005. Attentional interference effects of emotional pictures: threat, negativity, or arousal? Emotion. 5(1):55–66. doi:10.1037/1528-3542.5.1.55
- Shi J, Tao L, Li X, Xiao Y, Atchley P. 2014. A survey of taxi drivers’ aberrant driving behavior in Beijing. J Transport Safety & Security. 6(1):34–43. doi:10.1080/19439962.2013.799624
- Stephens AN, Groeger JA. 2009. Situational specificity of trait influences on drivers’ evaluations and driving behaviour. Transport Res Part F: Traffic Psychol Behav. 12(1):29–39. doi:10.1016/j.trf.2008.06.005
- Sullman MJ, Gras ME, Cunill M, Planes M, Font-Mayolas S. 2007. Driving anger in Spain. Personality and Indiv Differ. 42(4):701–713. doi:10.1016/j.paid.2006.08.014
- Tabachnick BG, Fidell LS. 2007. Using multivariate statistics. 5th ed. New York. NY: Allyn and Bacon.
- Taherdoost H. 2016. Validity and reliability of the research instrument; how to test the validation of a questionnaire/survey in a research. Available at SSRN: https://ssrn.com/abstract=3205040 or doi:10.2139/ssrn.3205040
- Timmermans C, Alhajyaseen W, Reinolsmann N, Nakamura H, Suzuki K. 2019. Traffic safety culture of professional drivers in the State of Qatar. IATSS Res. 43(4):286–296. doi:10.1016/j.iatssr.2019.03.004
- Tseng CM. 2013. Operating styles, working time and daily driving distance in relation to a taxi driver’s speeding offenses in Taiwan. Accid Anal Prev. 52:1–8. doi:10.1016/j.aap.2012.11.020
- Wu J, Yan X, Radwan E. 2016. Discrepancy analysis of driving performance of taxi drivers and non-professional drivers for red-light running violation and crash avoidance at intersections. Accid Anal Prev. 91:1–9. doi:10.1016/j.aap.2016.02.028
- Yasak Y, Esiyok B. 2009. Anger amongst Turkish drivers: driving Anger Scale and its adapted, long and short version. Saf Sci. 47(1):138–144. doi:10.1016/j.ssci.2008.02.003
- Zhang T, Chan AH. 2016. The association between driving anger and driving outcomes: a meta-analysis of evidence from the past twenty years. Accid Anal Prev. 90:50–62. doi:10.1016/j.aap.2016.02.009
- Zhang T, Chan AH, Zhang W. 2015. Dimensions of driving anger and their relationships with aberrant driving. Accid Anal Prev. 81:124–133. doi:10.1016/j.aap.2015.05.005
- Zhang T, Chan AHS, Xue H, Zhang X, Tao D. 2019. Driving anger, aberrant driving behaviors, and road crash risk: testing of a mediated model. IJERPH. 16(3):297. doi:10.3390/ijerph16030297
