
 ?Mathematical formulae have been encoded as MathML and are displayed in this HTML version using MathJax in order to improve their display. Uncheck the box to turn MathJax off. This feature requires Javascript. Click on a formula to zoom.
Abstract
Objective
To perform a spatial analysis of Road Traffic Crashes (RTCs) and assess road safety issues from the perspective of road users.
Problem statement
Although many initiatives have been taken to reduce the occurrence and severity of RTCs, they continue to persist. Existing research often investigates the spatial occurrence of RTCs or the perception of road safety issues from the road user. In doing this, only a limited number of factors that contribute to RTCs can be revealed, whereas in most RTC occurrences a multitude of factors plays a role. A more integrated approach combining both knowledge areas can contribute to improving road safety.
Methods
RTCs that occurred from 2018 to 2020 in Rotterdam, in the Netherlands, were spatially analyzed. This was performed using Network Kernel Density Estimation (NKDE) analysis. Two zones within the study area were selected to understand road users’ perceptions of road safety through a survey. Furthermore, opinions toward possible recommendations for improving road safety were also collected through key informant interviews.
Results
NKDE resulted in a hot-spot map of the road segments in the study area that showed the frequency of RTCs using different colors. The road segments were classified based on the number of RTCs from 2018 to 2020, ranging from zero to 17.9 RTCs per kilometer. This led to the selection of a hot and cold spot zone for further analysis. The road user perception survey resulted in the discovery of qualitative responses that can be used to improve road safety in future and the possible recommendations would be well received by them. The key-informant interviews acted as a backup to the opinions given by the road users and provided insights on what is being done in the study area to improve road safety.
Conclusion
The synthesis of findings unveiled why road users perceive some areas as dangerous and which road policies need to be revised to improve road safety in Rotterdam.
Introduction
A road traffic crash implies a situation in which there is a collision that involves one or more vehicles on the road and causes damage or injury to either a person, an animal, or a property (Law and Martin Citation2009). RTCs can be differentiated in their degree of severity—fatal, major, minor, and minimal injuries (Mao et al. Citation1997). According to WHO (Citation2021), RTCs cause ∼1.3 million deaths and 50 million injuries making it a leading cause of death of children and young people worldwide. As a result, governments are determined to make road safety strategies to reduce the number of casualties (Jadaan et al. Citation2018).
According to Cabrera-Arnau et al. (Citation2020), the ratio of the world population to the number of fatalities has stabilized in recent years. The data on deaths from the past decade indicate that in 2010, there were 1.28 million road deaths, and at the end of 2020, the number had dropped only to 1.20 million. This shows that the Sustainable Development Goal (SDG) target 3.6 to halve deaths due to RTCs by 2020 was not met. The goal to reduce road deaths and injuries by half was set again for 2021–2030 by the UN General Assembly in 2020 (WHO Citation2021).
In the Netherlands, there were slightly more than 100,000 road crashes in 2020 (CBS Citation2021). Out of 100,000 road crashes, 19,700 (around 19.7% of total RTCs) resulted in serious injuries. This exceeded the national target set for 2020, which was 10,600 (around 10% of total RTCs) (Aarts et al. Citation2021). There were 610 deaths in 2020, not much different from the last decade’s average numbers (CBS Citation2021). As a result, the national target of 500 deaths in 2020 was not achieved (SWOV Citation2021a). The numbers for injuries and deaths were lower than in previous years but not the lowest value, which meant that despite the lockdown caused by COVID-19, there was not much effect on the crash fatalities trend (SWOV Citation2021b).
From 2022 to 2021, deaths due to RTCs in the Netherlands (slightly above 30 deaths per million inhabitants) fell below the EU average (45 deaths per million inhabitants) (Carson et al. Citation2022). However, according to the same report, the actual percentage of reduction in deaths in the past decade (slightly more than 10% in the Netherlands) is far lesser than the EU average (slightly more than 30%). In the context of RTCs in the European Union countries, only Lithuania was successful in reducing the number of road deaths over the last decade (Carson et al. Citation2022). This implies that although there is a comparatively lesser number of RTCs in the Netherlands, they have not reduced much in past years.
RTCs do not follow an equal distribution along the road network as they are rare occurrences. However, they tend to be clustered at specific points, which depends on time (temporal) and place (spatial) (Wang et al. Citation2021). Identifying and estimating such clusters or hotspots is important in traffic safety initiatives (Choudhary et al. Citation2015). In this process, Geographical Information Systems (GIS) have great potential to recognize areas where hotspots occur (Bíl et al. Citation2019). GIS technology is a popular tool used by transport planners to visualize locations of collisions for analyzing hotspots (Prasannakumar et al. Citation2011). GIS has been used in road safety research for basic purposes, such as visualization and mapping of RTCs using basic geo-coding functions as well as for handling large datasets and variables using data mining and statistical approaches (Yao et al. Citation2016).
Identifying hotspots can efficiently aid in allocating the budget for traffic safety, thus, leading to a sustainable system (Sajed et al. Citation2019). Additionally, the occurrence of RTCs depends on the risk perception of individuals (Guerrero et al. Citation2020). Studies have indicated that risk perception varies on demographic variables, such as gender and maturity (Lund and Rundmo Citation2009). Human factors also contribute to the frequency and severity of RTCs (Bucsuházy et al. Citation2020). A study by Andersson (Citation2011) concludes that individuals believe risks of RTCs as exogenous or beyond their control, thus leading to under-assessment of a potentially risky situation. Therefore, it becomes essential to look at the problem from a road user perspective when aiming to reduce the occurrence and severity of RTCs.
There are a few studies that analyze road users’ perceptions in addition to spatial analysis of RTCs. For example, Xie and Yan (Citation2013), Abdulhafedh (Citation2017), and Soltani and Askari (Citation2017) have performed different methods of spatial analysis and statistics of RTCs to find spatial relations among crashes. Conversely, Hallett et al. (Citation2012) studied the prevalence of risky behavior among road users and De Blaeij and Van Vuuren (Citation2003) analyzed the risk perception of RTCs. Many studies that perform spatial analysis of RTCs do not include how the results are related to the perception of road users or what can be improved on roads to prevent crashes in the future. Consequently, unreliable results are produced, and critical spatial relationships are missed. The knowledge gap this research aimed to bridge was to contextualize the results of spatial analysis with the help of road user perception. This research aimed to perform a spatial analysis of road traffic crashes and assess road safety issues from the road users’ perspective.
Literature review
Spatial analysis of RTCs
Spatially analyzing crashes allows for identifying the patterns, which gives reasons for the formation of hotspots on interpretation (Shafabakhsh et al. Citation2017). Different research studies the spatial relations of RTCs through spatial autocorrelation with some other factor (like road parameters) or through spatial analysis of the locations of RTCs. below shows an overview of different methods used for spatial analysis of RTCs.
Table 1. Overview of different methods and description for spatial analysis of RTCs.
Risk perception analysis of RTCs
Risk perception is a subjective assessment of the probability of incidence of a specific incident and the level of concern about risk consequences among the involved people (Sjöberg et al. Citation2004). Perception means the steps involved in using the senses to recognize, observe and discriminate between different objects, relations, and actions (APA Dictionary of Psychology n.d.). The response to these stimuli enables organisms to respond in a particular manner. Therefore, it is essential to recognize how road users perceive RTCs on the roads they use daily. Many factors influence the risk perception of individuals. Human behavior is one of the factors that affect the risk perception of an individual, as it is responsible for many RTCs (Bucsuházy et al. Citation2020). Risk perception also depends on the past experiences of road users (Ram and Chand Citation2016). Another factor is the mode of transport used by a road user. According to a study by Andersson (Citation2011), car users are likely to perceive the risk of RTC to a lesser degree than users of other means of transportation. Therefore, it is essential to recognize how different road users perceive RTCs.
Risk perception toward road safety issues can be analyzed through qualitative or quantitative surveys. Qualitative research provides in-depth knowledge about human behavior, attitudes, understanding, and objectives, which helps to understand the reasons behind the collected quantitative responses. An example is a questionnaire with a four-point scale and the use of descriptive statistics to find correlated factors or a t-test for determining if past involvement in RTC affects risk perception and safe behavior (Ngueutsa and Kouabenan Citation2017). Purposive sampling and ground theory analysis are examples of methods for qualitative research (Ahmad et al. Citation2019).
Methodology
This section describes the methodology used to analyze RTCs. First, the study area was chosen and then, a spatial analysis was performed to identify patterns of RTCs. This was the secondary data used in this research. The primary data included responses collected from road users’ perception surveys. Following that, key-informant interviews were conducted to get more insight into the hotspots and cold spots of RTCs. Finally, discussions on what changes can be made in the future to provide possible recommendations for improving road safety were held with the key informants.
Study area
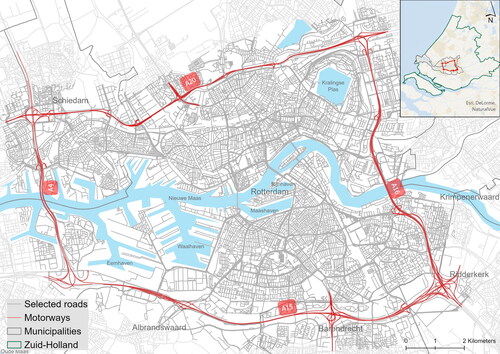
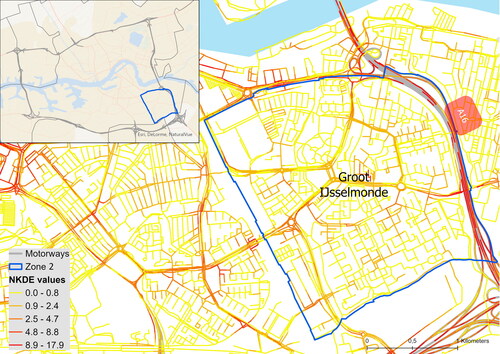
The study area is shown in . The study area covered most of the Rotterdam and Schiedam areas. It also included some road networks in Ridderkerk, Barendrecht, and Albrandswaard. The selected roads are in darker grey, and the motorways are in red. The inset map on the right shows the location of the study area concerned within the Province of Zuid-Holland.
Figure 1. The study area map.
RTC records collected by the police are included in the BRON database, a national database of RTCs (Rijkswaterstaat Citation2020). Stichting Wetenschappelijk Onderzoek Verkeersveiligheid (SWOV), or the Institute for Road Safety Research (translated to English) supplements this data with data from Landelijke Basisregistratie Ziekenhuiszorg (LBZ), or National Base Register Hospital Care (translated to English) to include information related to the severity of the crashes (Rijkswaterstaat Citation2020). The data from BRON is geographically referenced, ranging from 2003 to July 2021, by ESRI Netherlands. The data was available to freely download in either .csv or .shp or .kml format. A handbook created by Rijkswaterstaat explained the codes in the column headings of the crash data. It included X and Y coordinates of the RTC location, unique registration and identification code of the traffic incident, year of occurrence, the outcome of the crash (Property damage, injury, or death), number of parties involved, road characteristics at the crash location (either straightway, bend, or intersection), time of the day (night or day), weather condition at the time and place of the crash and the maximum road speed of that road segment.
Spatial analysis
RTCs occur in 1D space (only along road segments and at intersections) and not 2D (Okabe and Sugihara Citation2012; Abdulhafedh Citation2017). Planar Kernel Density Estimation (PKDE) considers Euclidean distances between crash locations. Consequently, it leads to unreliable results as crashes do not occur in a 2D manner. Therefore, studies have attempted to convert the 2D version of crash locations into 1D infinite space (Xie and Yan Citation2008). The 1D approach, also known as the Network KDE (NKDE) divides the road network into equal segments, termed lixels. In this approach, the terminology of “lixel” (linear pixel) is used, which represents linear units of equal and regularly placed lengths in the network (Xie and Yan Citation2008). The NKDE describes crash densities and network borders more accurately compared to PKDE (Ziakopoulos and Yannis Citation2020). Thus, NKDE analysis was used to find hotspots in the study area. Implementing this methodology improves the efficiency of calculating hotspots along with a road network. This approach is recommended if the research needs higher accuracy results in specific intersections or roadway segments. However, computation time is comparatively more extended than the 2D approach (Tang et al. Citation2013).
To perform NKDE analysis, the “Spatial Analysis on a Network” toolbox (SANET) is commonly used (Benedek et al. Citation2016). SANET uses EquationEq. (1)(1)
(1) below to compute NKDE (Okabe et al. Citation2009).
(1)
(1)
Where,
k(x) = basic kernel function for the crash locations,
y = center of the same kernel function,
x = point located on the network (crash location),
h = bandwidth in meters,
n = degree of the node in the road network which connects different links,
d = shortest distance from y to x (in m)
SANET 4.1 standalone version was used for performing NKDE analysis. The shapefile of the entire road network of the study area was used as the input layer, and point features of crash data were uploaded as the kernel points. The bandwidth selection is subjective and depends on the extent of the study area (Srikanth et al. Citation2019). When selecting band size and cell size, narrow bandwidths lead to under-smoothed NKDE maps, whereas larger bandwidths cause smoother maps (Tang et al. Citation2013; Benedek et al. Citation2016; Srikanth et al. Citation2019). The user manual for SANET recommended that small bandwidth and cell size should be chosen initially. Then, the hit-and-trial method was recommended to find a combination that appropriately represented the data (Okabe et al. Citation2006). In urban areas, a bandwidth of 50–300 m was recommended to be appropriate (Xie and Yan Citation2008; Steenberghen et al. Citation2010; Ulak et al. Citation2017). Several values were used to perform NKDE-50, 100, 150, 200, and 250 m. After observing the results obtained from different bandwidths, the crash densities were best visualized at 250 m (the KDE diagram was neither too smooth nor coarse). Thus, it was decided that 250 m was the most appropriate choice based on the spatial extent of the study area and the distribution of RTCs. Additionally, cell width needs to be specified in SANET, which is approximately one-tenth of the bandwidth (Okabe and Sugihara Citation2012; Ulak et al. Citation2017). In this analysis, 20 m was the chosen cell size. The results were stored in the form of shapefiles in a pre-selected local directory, which was then imported into ArcGIS Pro for visualization.
Perception analysis (survey)
Many hotspots of RTCs were identified from the spatial analysis. Two zones—a hot and a cold spot—were selected to ask the road users about their perception of road safety and crashes. These zones were selected to compare road users’ perceptions of zones with higher and lower occurrences of crashes.
Road users who had been living in Rotterdam for at least 3 years or more were considered in the survey. This was done to ensure that the respondents possessed tacit knowledge of the road networks. Individual road users involved in the secondary crash data which was used in spatial analysis could not be traced, since BRON does not collect personal data. Thus, the questions were asked with the assumption that if an individual has lived in Rotterdam for more than 3 years, he/she would be familiar with the location and most probably have experience with road safety in different zones.
In addition to questions regarding the hotspot and cold spot zones, questions regarding opinions toward possible recommendations for improving road safety were asked to the road users (only car drivers and cyclists). The reason for limiting the types of road users to only car drivers and cyclists was to be able to link the responses with existing and possible policies from SWOV factsheets for only those modes. The motive behind choosing to ask for certain recommendations was based on the practicality of the implementation of those measures and existing research.
The possible policy recommendations presented to car drivers were—using semi/fully automated cars, alcolock for previous drunk driving offenders, black boxes, and fatigue detection devices. For cyclists, the possible policy recommendations included—the use of reflective materials, helmets, and back-view mirrors.
A survey was developed to analyze road users’ perceptions regarding road safety issues and risks in the study area. The term “risk” in the survey referred to the prevalence of specific (dangerous) road user behavior, like drunk driving, being involved in hazardous conditions (for example, slippery roads), or speeding above the limit. The term “perception (of road users)” refers to the concern about the risk factors. Road users were asked if they felt safe using the roads in the selected zones, whether they perceived the safety was improved or worsened, and about their attitudes toward possible recommendations that could be applied in the future.
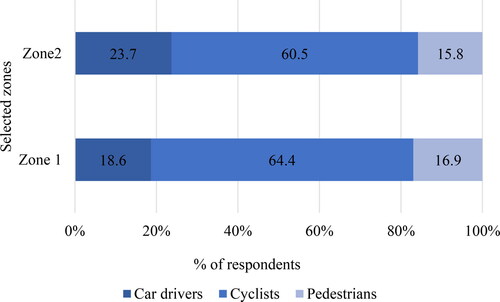
The survey was performed using an open-source online tool, Kobo Toolbox. An average of 15 min was required to complete the questionnaire. The interviewees expressed their opinions on a five-point psychometric response Likert scale. In this way, qualitative and quantitative data were collected. shows the percentage of road users who use different modes of transport that responded to all questions in the selected zones.
Figure 2. Percentages of respondents based on transport mode.
The responses were collected using purposive sampling. Purposive, or judgment sampling, is an inductive process in which the researcher obtains a representative sample by using their judgment, which will be helpful in cases where only a limited number of people can serve as a source of data to fulfill research goals (Black Citation2010). The researcher collects and analyses the data simultaneously and decides to collect or not collect more data to develop a theory (ground theory) they are trying to prove (Glaser and Strauss Citation1999). The grounded theory analysis approach is an effective way to understand the interests of a group of people (Sharifian et al. Citation2021). According to Mason (Citation2010), qualitative research should consider data saturation. This means collecting and analyzing data up to a point in which no “new” findings occur. The hypotheses in ground theory are developed by focusing on “discovery rather than verification of theory” (Javadi et al. Citation2017; Silva et al. Citation2020). After discovering a theory “grounded in the data,” similar responses are grouped into categories then relationships between different categories are established (Holmes et al. Citation2019). When no new category is discovered or no new concept is added to an already established category, saturation is created (Glaser and Strauss Citation1999; Sharifian et al. Citation2021).
Text mining is another method, similar to grounded theory, where categories and concepts are identified, and processes are explained about a certain topic (Yu et al. Citation2014). For example, Kutela et al. (Citation2021) used the approach for analysis of qualitative responses, by making text network diagrams of keywords used by a large sample of respondents. However, this approach is not used in this research because the number of responses was relatively small, and saturation was reached relatively quickly. Thus, purposive sampling was deemed to be the best method for the efficient analysis of collected responses.
The questionnaire was conducted online (8 February 2022–26 February 2022) and the researcher visited the selected zones twice to collect responses on-site. After the first visit, all the qualitative responses were noted down in an Excel sheet and responses from the second visit were later added to the same sheet. Following the criteria of grounded theory, no new information was obtained from the second visit, thus, the questionnaire was closed to the public.
Key informant interviews
In addition to the spatial analysis of RTCs and the risk perception survey, key informant interviews were carried out with three road safety professionals to get an in-depth understanding of the results of the combined analysis. A total of three online key-informant interviews were carried out with representatives from SWOV, the Urban Development Department of the Municipality of Rotterdam, and Team Alert. They are cited further in the paper using only their organization names for privacy reasons.
Results
This section includes the results of the spatial analysis that was meant to identify RTC hot and cold spots. They are followed by qualitative responses collected from the road users’ perception of the selected zones and the attitudes toward possible recommendations which were discussed with the key informants.
Network Kernel Density Estimation
The combined 3-year RTC dataset was used to perform NKDE analysis. The reason for performing NKDE for the total dataset was to find locations where RTCs have been occurring more frequently over 3 years. below shows the numbers of RTCs resulting in property damages, injury, and death in 2018, 2019, and 2020 as well as the percentages of different fatalities.
Table 2. RTC counts 2018–2020 (% between brackets).
The NKDE frequency of crashes is expressed in terms of the average count per kilometer of road length, as shown in .
Figure 3. NKDE map of RTCs from 2018 to 2020.
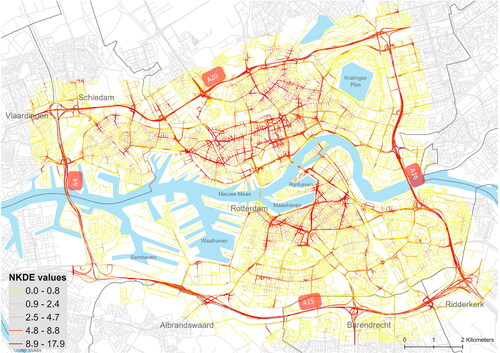
The legend contains five shades, ranging from yellow to red. Red indicates the highest number of RTCs. The maximum crash count value observed from the NKDE analysis was 8.9–17.9 per kilometer. This implies that the red-colored roads have had 8.9–17.9 RTCs from 2018 to 2020 per kilometer of a segment. The classification of the RTC count in the map was decided in such a way that it clearly expressed the differences between hot and cold spots. The motorways seemed to have more crashes per kilometer of road length (more red lines along the motorways). Some areas inside the city also have a high crash frequency.
Thus, with the help of SANET, NKDE was performed to obtain clear clusters along the road network to determine which segments had the highest frequency of crashes per kilometer in the selected 3 years. Based on the NKDE map for the combined dataset, two zones were selected for the survey on users’ perceptions of road safety. Two areas- one hotspot and one cold spot were chosen for the survey on users’ perceptions of road safety.
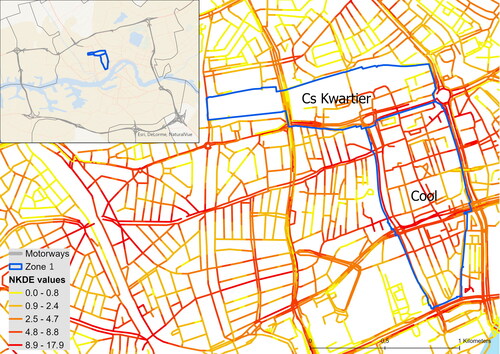
Zone 1: Many RTCs occurred in this zone throughout the 3 years, as shown in . The reason for selecting this zone was to understand how road users perceive the safety of a Central Business District area (CBD), where there are high traffic volumes and mixed traffic conditions. There are only a few road segments with a low value of RTCs over the 3 years.
Figure 4. A zoomed-in view of NKDE results in zone 1 of the study area.
Zone 2: Although the ring road has numerous intersections and is a “stadsweg,” meaning a city road, there have been few occurrences of RTCs over 3 years, as shown in . The number of RTCs is comparatively higher around the boundary for zone 2 but has remained at the lowest value in the past 3 years. Thus, using SANET, the NKDE of crashes along the road network was completed.
Figure 5. A zoomed-in view of NKDE results in zone 2 of the study area.
From the zoomed-in view of the two zones, it can be seen the number of crashes that took place in the two areas, and to determine which area is the hotspot and which area is the cold spot. However, it does not explain why the areas had higher (or lower) values of RTCs, or how the road users view the safety of the area.
The following section discusses how road users (car drivers and cyclists) perceive their safety in the selected zones. In doing so, the researchers can determine the underlying cause for the results from the NKDE.
As previously mentioned, the consulted literature either focused on spatial and/or statistical analysis of RTCs or the analysis of road users’ perception of the safety of the road. A study that involves both types of analyses will potentially provide more insights into areas that require improvement in road safety. These two results were discussed with the key informants as well. Finally, additional insights gained from key informants are discussed in the following section.
The analysis of RTCs generated two insightful results. RTCs resulting in injuries and property damages were reduced in 2020 when compared to the previous two years, but the RTCs resulting in deaths increased. The reduction in injuries and property damage due to RTCs in 2020 can also be attributed to a decline in trips due to the surge of the COVID-19 virus. According to the key informant from Rotterdam Municipality, “The number of road injuries in Rotterdam during Corona was lower than before (due to less traffic). The number of fatal accidents (deaths only) remained at the old level. Our assumptions and analyses show that during the lockdown, people were bored and that certain groups used empty roads to hold street races. Some people also drove aimlessly around the city with friends in their cars because facilities were closed in the city. This resulted in several serious fatal accidents in Rotterdam due to reckless driving, according to the police reports” (2022 May 12 personal communication).
Perception of road users in the selected zones
In Zone 1, the central part of Rotterdam, road users indicated being concerned about their safety. A small portion of cyclists were not satisfied with the markings and signage because of pedestrians using the cycle path to walk. In addition, because of the high number of intersections on the road network, cyclists found it confusing while crossing. In Zone 1, pedestrians were the road users who experienced the most significant safety improvements. However, some cyclists and car drivers expressed that safety had worsened in Zone 1.
Road users expressed their concern about road safety in Zone 1 with responses, such as “There are different modes of traffic (transport modes) at the same time, that makes me feel unsafe,” “it is a busy place with people walking everywhere,” “the trams cross the road everywhere in front of the central train station,” “due to trams, there is no oversight (referring to being able to look to the other side of the road while crossing),” “some people are rude on bikes and think they own the cycling route, this causes much chaos on the cycling road,” “you have to be careful when cycling near trams, you may fall into the tracks. It has happened to me many times,” “I cannot hear the electric scooters, and they speed all the time.” Some car drivers said they do not feel concerned because the lanes are separate, and pedestrians reported feeling safe because they use the sidewalk and do not go near traffic. They also said that “there are so many intersections, and I have to look in all directions before crossing,” “although there are traffic lights, some cyclists and scooters do not pay attention to it,” “there are no clear markings or surveillance,” “there are signs, but still there is chaos, I would like more traffic signs in the future.” The common reason mentioned by pedestrians was “there is a lot more walking space since the past few years, and traffic signs have been added in most of the places,” “there are separated paths now but a few years ago especially in front of the central station, there used to be so much crowd,” “it is much more spacious now,” “the sidewalks are larger (wider) now.”
None of the road users in Zone 2 expressed being “very concerned” about their safety. Only a small number of cyclists expressed dissatisfaction with the road markings and signage. Road users had the following opinions about zone 2: “Sometimes cars speed here, and it is dangerous for cycling,” “I know this area is safer than zone 1 because it is not so crowded,” “when there is traffic on the roads, car drivers speed and does not care for crossing cyclists and pedestrians.” Some road users said traffic lights were added a few years ago in some areas, improving safety. To summarize, there were no reported cases of worsened traffic situations in the cold spot (zone 2).
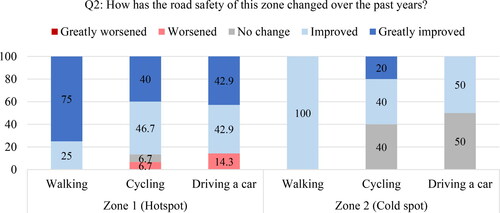
and express the variation in the observed responses to the questions asked regarding the perceived current level of safety and change in safety from 2018 to 2020. It can be seen clearly that Zone 2 (cold spot) is perceived to be safer irrespective of transport mode. Additionally, zone 2 has more positive responses for change in the level of perceived safety, which is in line with the results from spatial analysis (i.e., lesser number of crashes per kilometer length of the road).
Figure 6. Perceived level of safety in zone 1 and 2 (in %).
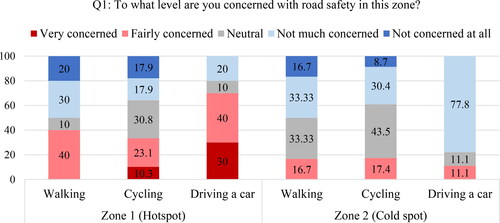
Figure 7. Perceived level of change in road safety over the past 3 years (in %).
Attitudes toward possible recommendations and key informant interviews
Car drivers were asked if they would be in favor of using semi/fully automated cars. Most of the car drivers were not in favor. Their responses were, “I do not trust the machine to make decisions for me,” “there is always something that can go wrong with a car like that; it is too much of a risk,” and “I once had an accident in a similar car because the system stopped working,” “I do not like the automatic system,” or “I would rather be in control myself.” An equal proportion of drivers responded positively and negatively to using alcolock for previous offenders, installing the black box, and fatigue detection devices. Those three recommendations were found to have more people in support compared to the demerit point system. Since these methods are not in practice, some respondents had to be made aware of how they would work. A driver responded, “A demerit or progressive penalty system is not helpful” but another road user said, “A demerit point system is good, but people may not favor it.”
There were many neutral responses in the case of cyclists because they could not precisely answer how they would perceive the recommendation if it became a policy in the future. Most cyclists did not understand the use of reflective materials in the dark because either they were using bicycle lights, or the roads were well-lit. Many cyclists replied, “Helmets are quite unnecessary in my opinion for short distance travels,” meaning they would not want to wear helmets because they are already familiar with cycling on usual roads. Others added to the same statement with replies, such as “Helmets make you think you are safe, but that is not true” and “It is just a cultural thing- helmets are unnecessary for experienced cyclists, but everyone can make their choice though- I just do not want to wear one.” In the case of using rearview mirrors on their cycles, the primary concern of most cyclists seemed to be, “I might hurt myself if I fall, so I think it is a dangerous idea.” A typical response for all three recommendations was, “I do not know if other people will like them or follow it through.” The possible recommendations for car drivers’ safety were better accepted than those for cyclists.
To summarize this section, car drivers were not in much agreement with using semi/fully automated vehicles in the future or with attending awareness classes as a form of penalty. This issue was discussed in the first key informant interview. The SWOV expert agreed, stating, “Many road users strongly dislike using speed-limiting devices and automated cars. There had been campaigns promoting ITS use in the past, and SWOV had analyzed the number of people in support but was unable to achieve the intended target” (2022 March 22 personal communication). The key informant from Rotterdam Municipality stated that there are existing awareness programs to promote ITS use. The municipality of Rotterdam also uses social media to convince road users to use the information systems and organize their journeys more smartly. They added, “We have set up much communication about our ITS systems on behalf of the municipality. These systems provide information about travel time, road works, and road safety and travel alternatives” (2022 May 12 personal communication).
The key informant from Rotterdam Municipality discussed the negative opinions of cyclists toward wearing a helmet. They say, “I do not think we have to wear bicycle helmets by law. Stimulating voluntary use for vulnerable groups, such as children and the elderly is a good idea. If we start mandating too many traffic regulations (beyond the ones we already have), I am afraid we will see the opposite effect. We already see increasing resistance to government measures among citizens. In addition, we fear that bicycle use will decrease if helmet use is made compulsory. This has also been researched. In addition, we still have a lot to improve by making bicycle paths safer and offering more education. If that does not work, we can always reconsider a possible helmet requirement by 2030” (2022 May 12 personal communication).
Discussion
According to the interviewed expert from Rotterdam Municipality, three criteria generally initiate a road safety project: (i) the presence of black (or hot) spots (where six or more RTCs resulting in injuries have occurred in three consecutive years), (ii) residents’ perception, and (iii) results obtained from risk models. The steps to develop a new road policy were discussed with the key informant from SWOV. In the past, road projects and policies were developed based solely on crash data. In recent years, SWOV has started working proactively by analyzing key performance indicators of road networks and checking guidelines (2022 March 22 personal communication with SWOV). This is similar to the plan made by WHO (Citation2021) for the decade plan 2021–2030 to perform risk-mapping in areas where the crash data is reliable and perform proactive safety assessments and road inspections per users’ needs.
It was found out the scope of this research is within the two criteria to determine which road points in Rotterdam must be improved to increase road safety, namely the presence of hot spots and residents’ perception. The key informants from SWOV, Rotterdam Municipality, and TeamAlert responded that research like this, which first performs spatial analysis and then looks at road user perception, can be an excellent method to improve road safety (2022 March 22; 2022 June 2; 2022 May 12 personal communication). Integration of road user perspective to reduce RTCs was discussed with the key informant from TeamAlert. They stated that they initially observe a societal problem, research the available data, and finally carry out campaigns involving residents (2022 June 2 personal communication). “Mostly the projects have a knowledge part, followed by some kind of games to target youths and a part where people talk with each other about existing norms” (2022 June 2 personal communication with TeamAlert).
Conclusion
This research’s main objective was to perform a spatial analysis of road traffic crashes and assess road safety issues from the perspective of road users. This study applied spatial analysis techniques, a survey, and expert interviews to understand and evaluate road users’ perceptions of RTC.
This research performed a spatial analysis of RTCs in Rotterdam municipality and the surrounding urban conurbation using data from 2018 to 2020. The numbers of RTCs resulting in property damages, injuries, or deaths in each of the years were visualized in maps. Following that, crash hotspots were determined using NKDE analysis. Two areas (a hot and cold spot of RTCs) were the focus of a survey to collect road users’ perceptions of road safety. As understood from the literature review and the limitations of existing research, only knowing dangerous locations in the road network is not enough to improve road safety. Thus, this research dived further into why some areas are perceived as dangerous regarding road safety and what could be possible recommendations for improving road safety in these areas.
When road users were asked about their perception of safety in the selected zones, it was found that they consider hot spots risky because of high traffic volumes, mixed traffic conditions, and speeding vehicles. Zone 1 was found to have performed poorly in road safety improvement for cyclists and car drivers. Warning signs could be placed in the hotspots determined in this study. Furthermore, these signs could incorporate information on the number of RTCs that occurred, to increase awareness. This way, road users remain alert to their surroundings when using those roads. The main issue with Zone 2 (cold spot) was that motor vehicles tend to speed, taking advantage of lesser traffic volume. More signage could be added to these areas to make road users aware, and traffic calming measures, such as humps could be integrated into the existing infrastructure.
Following that, road users were asked for their views on the list of possible recommendations. It was found that car drivers agreed more to a list of possible recommendations for the future than cyclists. Although research proves those measures to be beneficial, possible recommendations, such as using semi/fully automated cars or reflective tape were not well received. Facts and statistics should back up the awareness campaigns to ensure maximum impact among road users. To better understand the results of the spatial analysis and survey, they were discussed in the key-informant interviews.
Limitation
The limitations of this research are both data and method related. A data-related limitation is the under-reporting of RTCs by BRON (SWOV Citation2021b). Between 2011 and 2020, BRON’s crash records were around 16% less than that of CBS Netherlands. This was because BRON does not report crashes that involve non-motorized transport exclusively or when there is confusion about the type of crash (SWOV Citation2021b). Data relating to non-motorized transport or RTC involving a single person only can be added to the existing database using the information from vehicle insurance companies to ensure more crashes are recorded. The data from insurance companies can also give insight into elements of road infrastructures that are prone to causing crashes, for example, a narrow cycling lane. Another limitation is that the recorded crashes are put under one of the three headings- death, injury, or property damage by the police authority which registers the crash. According to the key informant from SWOV, if a road user must be admitted to a hospital for a crash injury, the hospital stores data on the types of injuries. However, according to the key informant from SWOV, the type of injury is not linked to the coordinates of the crash location (2022 March 22 personal communication). Data like that is also not easily accessible due to privacy issues. However, a more detailed classification of injury types would provide more information for analysis.
A methods-related limitation is that traffic volume was not considered in this analysis because that would lead to a temporal analysis, which was not the research objective. Additionally, the crash data does not have time stamps which would make it challenging to perform temporal analysis. Another limitation is regarding the risk perception survey, as the sample is not representative of the entire area. The road users were approached based on ground theory, assuming that no new category of answers could be expected. Thus, the sample of 64 residents of Rotterdam may not be an actual representation of the entire city.
Acknowledgments
We thank the respondents of the survey and the key informants who contributed to the findings of this research.
Data availability statement
The data used for spatial analysis is freely available to download from traffic crash data in the Esri Netherlands ArcGIS Hub https://hub.arcgis.com/datasets/esrinl-content::verkeersongevallen/about. The questionnaire in English or Dutch can be provided upon request.
Additional information
Funding
References
- Aarts L, Wijlhuizen GJ, Gebhard S, Goldenbeld C, Decae R, Bos N, Bijleveld F, Mons C, Hoekstra T. 2021. De Staat van de Verkeersveiligheid 2021; Doelstellingen voor 2020 definitief niet gehaald – hoe nu verder? SWOV. The Hague. https://swov.nl/sites/default/files/publicaties/rapport/r-2021-21.pdf.
- Abdulhafedh A. 2017. Identifying vehicular crash high risk locations along highways via spatial autocorrelation indices and kernel density estimation. World J Eng Technol. 5(2):198–215. doi:10.4236/wjet.2017.52016.
- Ahmad S, Wasim S, Irfan S, Gogoi S, Srivastava A, Farheen Z. 2019. Qualitative v/s. quantitative research–a summarized review. J Evid Based Med Healthc. 6(43):2828–2832. doi:10.18410/jebmh/2019/587.
- Anderson T. 2007. Comparison of spatial methods for measuring road accident “hotspots”: a case study of London. J Maps. 3(1):55–63. doi:10.1080/jom.2007.9710827.
- Andersson H. 2011. Perception of own death risk: an assessment of road-traffic mortality risk. Risk Anal. 31(7):1069–1082. doi:10.1111/j.1539-6924.2011.01583.x.
- Anselin L. 2016. Local spatial autocorrelation clusters.
- APA Dictionary of Psychology. n.d. Perception [accessed 2021 Dec 6]. https://dictionary.apa.org/perception.
- Benedek J, Ciobanu SM, Man TC. 2016. Hotspots and social background of urban traffic crashes: a case study in Cluj-Napoca (Romania). Accid Anal Prev. 87:117–126. http://dx.doi.org/10.1016/j.aap.2015.11.026. doi:10.1016/j.aap.2015.11.026.
- Bíl M, Andrášik R, Sedoník J. 2019. A detailed spatiotemporal analysis of traffic crash hotspots. Appl Geogr. 107(April):82–90. doi:10.1016/j.apgeog.2019.04.008.
- Black K. 2010. Business statistics for contemporary decision making. 6th ed. Houston (TX): John Wiley & Sons, Inc. https://faculty.ksu.edu.sa/sites/default/files/business-statistics-for-contemporary-decision-making-by-ken-black_0.pdf.
- De Blaeij AT, Van Vuuren DJ. 2003. Risk perception of traffic participants. Accid Anal Prev. 35(2):167–175. doi:10.1016/S0001-4575(01)00100-2.
- Bucsuházy K, Matuchová E, Zůvala R, Moravcová P, Kostíková M, Mikulec R. 2020. Human factors contributing to the road traffic accident occurrence. Transp Res Procedia. 45(2019):555–561. doi:10.1016/j.trpro.2020.03.057.
- Cabrera-Arnau C, Prieto Curiel R, Bishop SR. 2020. Uncovering the behaviour of road accidents in urban areas. R Soc Open Sci. 7(4):191739. doi:10.1098/rsos.191739.
- Carson J, Jost G, Meinero M. 2022. Ranking EU progress 16th road safety performance index report. Brussels. https://etsc.eu/wp-content/uploads/16-PIN-annual-report_FINAL_WEB_1506_2.pdf.
- CBS. 2021. 610 Traffic deaths in 2020. CBS [accessed 2022 Mar 11]. https://www.cbs.nl/en-gb/news/2021/15/610-traffic-deaths-in-2020.
- Choudhary J, Ohri A, Kumar B. 2015. Spatial and statistical analysis of road accidents hot spots using GIS Spatial and statistical analysis of road accidents hot spots using GIS. 3rd Conference of Transportation Research Group of India (3rd CTRG); Kolkata, India.
- Glaser BG, Strauss AL. 1999. The discovery of grounded theory. 1st ed. New York (NY): Routledge. https://www.taylorfrancis.com/books/9781351522168.
- Guerrero TE, de Dios Ortuzar J, Raveau S. 2020. Traffic accident risk perception among drivers: a latent variable approach. Transp Plan Technol. 43(3):313–324. doi:10.1080/03081060.2020.1735763.
- Hallett C, Lambert A, Regan MA. 2012. Text messaging amongst New Zealand drivers: prevalence and risk perception. Transp Res Part F Traffic Psychol Behav. 15(3):261–271. doi:10.1016/j.trf.2011.12.002.
- Holmes BD, Haglund K, Beyer KMM, Cassidy LD. 2019. Qualitative methods of road traffic crash research in low- and middle-income countries: a review. Int J Inj Contr Saf Promot. 26(2):194–199. doi:10.1080/17457300.2018.1535512.
- Jadaan K, Al-Braizat E, Al-Rafayah S, Gammoh H, Abukahlil Y. 2018. Traffic safety in developed and developing countries: a comparative analysis. J Traffic Logist Eng. 6:1–5. doi:10.18178/jtle.6.1.1-5.
- Javadi S-M-H, Tahmasebi S, Azari-Arghun T, Arshi M, Alipour F. 2017. The youth and experience of traffic accidents (grounded theory). Health Emerg Disast Q. 2(2):79–88. doi:10.18869/nrip.hdq.2.2.79.
- Kutela B, Langa N, Mwende S, Kidando E, Kitali AE, Bansal P. 2021. A text mining approach to elicit public perception of bike-sharing systems. Travel Behav Soc. 24:113–123. doi:10.1016/j.tbs.2021.03.002.
- Law J, Martin EA. 2009. A dictionary of law. Oxford University Press [accessed 2021 Jun 8]. http://www.oxfordreference.com/view/10.1093/acref/9780199551248.001.0001/acref-9780199551248.
- Lund IO, Rundmo T. 2009. Cross-cultural comparisons of traffic safety, risk perception, attitudes and behaviour. Saf Sci. 47(4):547–553. doi:10.1016/j.ssci.2008.07.008.
- Mao Y, Zhang J, Robbins G, Clarke K, Lam M, Pickett W. 1997. Factors affecting the severity of motor vehicle traffic crashes involving young drivers in Ontario. Inj Prev. 3(3):183–189. doi:10.1136/ip.3.3.183.
- Mason M. 2010. Sample size and saturation in PhD studies using qualitative interviews. Forum Qual Sozialforschung. 11(3):8. doi:10.17169/fqs-11.3.1428.
- Ngueutsa R, Kouabenan DR. 2017. Accident history, risk perception and traffic safe behaviour. Ergonomics. 60(9):1273–1282. doi:10.1080/00140139.2016.1259508.
- Okabe A, Okunuki K-I, Shiode S. 2006. The SANET toolbox: new methods for network spatial analysis. Trans GIS. 10(4):535–550. doi:10.1111/j.1467-9671.2006.01011.x.
- Okabe A, Satoh T, Sugihara K. 2009. A kernel density estimation method for networks, its computational method and a GIS-based tool. Int J Geogr Inf Sci. 23(1):7–32. doi:10.1080/13658810802475491.
- Okabe A, Sugihara K. 2012. Spatial analysis along networks: Statistical and computational methods. Chichester (UK): Wiley. doi:10.1002/9781119967101
- Prasannakumar V, Vijith H, Charutha R, Geetha N. 2011. Spatio-temporal clustering of road accidents: GIS based analysis and assessment. Procedia Soc Behav Sci. 21:317–325. doi:10.1016/j.sbspro.2011.07.020.
- Ram T, Chand K. 2016. Effect of drivers’ risk perception and perception of driving tasks on road safety attitude. Transp Res Part F Traffic Psychol Behav. 42:162–176. doi:10.1016/j.trf.2016.07.012.
- Rijkswaterstaat. 2020. Handleiding product Bestand geRegistreerde Ongevallen Nederland (BRON). https://www.rijkswaterstaat.nl/apps/geoservices/geodata/dmc/bron/Documentatie/Handleiding product Bestand geRegistreerde Ongevallen Nederland.pdf.
- Sajed Y, Shafabakhsh G, Bagheri M. 2019. Hotspot location identification using accident data, traffic and geometric characteristics. Eng J. 23(6):191–207. doi:10.4186/ej.2019.23.6.191.
- Shafabakhsh GA, Famili A, Bahadori MS. 2017. GIS-based spatial analysis of urban traffic accidents: case study in Mashhad, Iran. J Traffic Transp Eng. 4(3):290–299. doi:10.1016/j.jtte.2017.05.005.
- Sharifian S, RK, Mh V, Mohammadi R. 2021. A model to explain road traffic data collection and registry in Iran: a grounded theory. J Inj Violence Res. 13(2):87–98. doi:10.5249/jivr.v13i2.1406.
- Silva C, Moeckel R, Clifton K. 2020. Proof of concept for a grounded theory approach to understanding interactions occurring on bicycle facilities. Transp Res Rec. 2674(10):94–104. doi:10.1177/0361198120943588.
- Sjöberg L, Moen E, Rundmo T. 2004. Explaining risk perception. An evaluation of the psychometric paradigm in risk perception research. Trondheim. http://66.102.9.104/search?q=cache:x8G44WOi3ssJ:www.svt.ntnu.no/psy/Torbjorn.Rundmo/Psychometric_paradigm.pdf+Explaining+risk+perception.&hl=en&ct=clnk&cd=3&gl=uk.
- Soltani A, Askari S. 2017. Exploring spatial autocorrelation of traffic crashes based on severity. Injury. 48(3):637–647. doi:10.1016/j.injury.2017.01.032.
- Srikanth DL, Srikanth I, Arockiasamy DM. 2019. Identification of traffic accident hotspots using geographical information system (GIS). Int J Eng Adv Technol. 9(2):4429–4438. doi:10.35940/ijeat.B3848.129219.
- Steenberghen T, Aerts K, Thomas I. 2010. Spatial clustering of events on a network. J Transp Geogr. 18(3):411–418. doi:10.1016/j.jtrangeo.2009.08.005.
- Steenberghen T, Dufays T, Thomas I, Flahaut B. 2004. Intra-urban location and clustering of road accidents using GIS: a Belgian example. Int J Geogr Inform Sci. 18(2):169–181. doi:10.1080/13658810310001629619.
- SWOV. 2021a. Dutch road safety targets for 2020 out of reach. SWOV [accessed 2022 Jun 14]. https://swov.nl/en/nieuws/dutch-road-safety-targets-2020-out-reach.
- SWOV. 2021b. Road deaths in the Netherlands [accessed 2021 Oct 15]. https://www.swov.nl/en/facts-figures/factsheet/road-deaths-netherlands.
- Tang Y, Knodler MA, Park M. 2013. A comparative study of the application of the standard kernel density estimation and network kernel density. 16th International Conference Road Safety on Four Continents; Beijing, China. http://urn.kb.se/resolve?urn=urn:nbn:se:vti:diva-7401.
- Ulak MB, Ozguven EE, Spainhour L, Vanli OA. 2017. Spatial investigation of aging-involved crashes: a GIS-based case study in northwest Florida. J Transp Geogr. 58:71–91. doi:10.1016/j.jtrangeo.2016.11.011.
- Wang M, Yi J, Chen X, Zhang W, Qiang T. 2021. Spatial and temporal distribution analysis of traffic accidents using GIS-based data in Harbin. J Adv Transp. 2021:1–10. doi:10.1155/2021/9207500.
- WHO. 2021. Decade of action for road safety 2021–2030. Geneva. https://cdn.who.int/media/docs/default-source/documents/health-topics/road-traffic-injuries/global-plan-for-road-safety.pdf?sfvrsn=65cf34c8_33&download=true.
- Xie Z, Yan J. 2008. Kernel density estimation of traffic accidents in a network space. Comput Environ Urban Syst. 32(5):396–406. doi:10.1016/j.compenvurbsys.2008.05.001.
- Xie Z, Yan J. 2013. Detecting traffic accident clusters with network kernel density estimation and local spatial statistics: an integrated approach. J Transp Geogr. 31:64–71. doi:10.1016/j.jtrangeo.2013.05.009.
- Yao S, Loo BPY, Yang BZ. 2016. Traffic collisions in space: four decades of advancement in applied GIS. Ann GIS. 22(1):1–14. doi:10.1080/19475683.2015.1085440.
- Yu CH, Jannasch-Pennell A, DiGangi S. 2014. Compatibility between text mining and qualitative research in the perspectives of grounded theory, content analysis, and reliability. Qual Rep. 16(3):730–744. doi:10.46743/2160-3715/2011.1085.
- Ziakopoulos A, Yannis G. 2020. A review of spatial approaches in road safety. Accid Anal Prev. 135:105323. doi:10.1016/j.aap.2019.105323.