
 ?Mathematical formulae have been encoded as MathML and are displayed in this HTML version using MathJax in order to improve their display. Uncheck the box to turn MathJax off. This feature requires Javascript. Click on a formula to zoom.
ABSTRACT
This paper examines stock market integration between the five ASEAN countries and both the US and China in turn, over the period from November 2002 to August 2020. The linkages between both aggregate and financial sector stock indices (both weekly and monthly) are analyzed using fractional integration and fractional cointegration methods. Further, recursive cointegration analysis is carried out for the weekly series to study the impact of the 2007–8 global financial crisis and the 2015 China stock market crash on the pattern of stock market co-movement. The main findings are the following. All stock indices exhibit long-range dependence. There is cointegration between the five ASEAN countries and the US but almost none between the former and China, except between Indonesia and China in the case of the financial sector. The 2007–8 global financial crisis and the 2015 Chinese stock market plunge weakened the linkages between the ASEAN five and both China and the US. The implications of these results for market participants and policy makers are discussed.
1. Introduction
In the most recent decades, globalization has led to increasingly stronger linkages between stock markets and a higher degree of cross-country co-movement, with the US playing a dominant role. In the case of the Asian financial markets it is often thought that, while the US exerts its influence through funding cost, portfolio rebalancing and risk appetite channels, China affects these economies mainly through trade linkages (Arslanalp et al. Citation2016; Glick and Hutchison Citation2013; Shu et al. Citation2015). There are instead only a few studies examining financial integration between China and the other Asian economies (Fang and Bessler Citation2018; Shu et al. Citation2018, Citation2015). Examining such linkages has important policy implications. In particular, regional institutions such as the Association of Southeast Asian Nations (ASEAN) and the Asian Development Bank should monitor the degree of co-movement between the stock markets of China and of the other Asian economies in order to design macro-prudential policies aimed at safeguarding financial stability in the presence of possible shocks originating from the larger economies in the region such as China.
The present paper provides new evidence on financial linkages between China, the US and five ASEAN economies. Its contribution is threefold. First, it applies fractional integration and cointegration techniques to test for co-movement between stock markets in those countries; these are more general than the standard ones based on the classical dichotomy between stationary I(0) and non-stationary I(1) series. Second, it assesses the impact of the 2007–8 global financial crisis as well as of the 2015 Chinese stock market plunge on financial integration between the same set of countries by carrying out recursive cointegration tests. Finally, given the increasing importance of the banking sector in the Asian countries, it also focuses specifically on the financial sector indices of stock markets. These issues have also not been thoroughly investigated in earlier studies using the same approach as in the current one.
The structure of the paper is as follows. Section 2 reviews the existing literature on Asian cross-market linkages and the role of China in the region. Section 3 outlines the empirical methods used for the analysis. Section 4 describes the data and discusses the main empirical results. Section 5 presents the results from the recursive cointegration analysis. Section 6 offers some concluding remarks.
2. Literature Review
The financial integration literature has mainly focused on the US as an international player. However, given China’s growing size and increasingly important financial role, some recent studies have started analyzing its regional influence. In particular, some of them have examined the currency markets and highlighted the rising impact of the Renminbi on the Asian currencies (e.g., Caporale, Gil-Alana, and You Citation2018; Fratzscher and Mehl Citation2014; Shu Citation2010; Shu et al. Citation2015; Subramanian and Kessler Citation2012). Concerning the money market, Liu et al. (Citation2013) found that real interest parity holds for ten East Asian countries that are significantly influenced by external factors originating from China. As for the bond markets, He, Zhang, and Wang (Citation2009) reported that Hong Kong’s market is more integrated with the Chinese one during tranquil periods but more aligned with the US one in turbulent times; more recently, however, Shu et al. (Citation2018) examined bond markets in China and eleven other Asian-Pacific economies and found that China remains a negligible player in the region.
As far as stock markets are concerned, some recent contributions have investigated cross-market linkages in Asia focusing in particular on the role of China (e.g., Arslanalp et al. Citation2016; Lean and Smyth Citation2014; Shu et al. Citation2018, Citation2015; Singh and Kaur Citation2016). Fan, Lu, and Wang (Citation2009) and Srinivasan, Kalaivani, and Devakumar (Citation2013) analyzed the linkage between China and other international markets. These studies use various methods such as cointegration (i.e., Lean and Smyth Citation2014; Singh and Kaur Citation2016; Srinivasan, Kalaivani, and Devakumar Citation2013), structural vector autoregressions (SVARs) (Shu et al. Citation2018, Citation2015), Capital Asset Pricing Model (CAPM) based regression analysis (Arslanalp et al. Citation2016), and Markov-Switching Vector Error Correction Models (MS-VECM) (Fan, Lu, and Wang Citation2009). The overall conclusion is that China’s influence within and outside the Asian region has been steadily increasing in recent years but is not yet as prominent as that of the US.
Regarding the impact of the 2007–8 global financial crisis, Glick and Hutchison (Citation2013) investigated stock market linkages between China and the other Asian countries during the period June 2005-October 2012 and found stronger linkages during the crisis. Further, in August 2015 a number of Asian markets slumped following the sharp drop in the Chinese one, but stock market co-movements between China and Asia during that period have hardly been analyzed. To our knowledge, the only available evidence is due to Fang and Bessler (Citation2018) and Ahmed and Huo (Citation2018); the former estimated cointegration and linear non-Gaussian acyclic models (LiNGAM) and found that the Chinese market had a strong negative impact on the other Asian markets, and the latter employed Bayesian VAR and BEKK-GARCH specifications and found stronger volatility spillovers from China to most Asia-Pacific stock markets during the turbulent period.
None of the above studies employs fractional integration/cointegration methods, despite their ability to detect long-run linkages even in the presence of sizable short-run deviations from equilibrium (Dolatabadi, Nielsen, and Xu Citation2015). Specifically, the equilibrium error could be mean-reverting without being exactly I(0), as a fractionally integrated error term will also display mean-reverting behavior (Hosking Citation1981). To our knowledge, there are only two papers estimating a fractional integration VECM model in the present context. Specifically, Chen, Lobo, and Wong (Citation2006) test for fractional cointegration between three pairs of stock markets (i.e., India-US, India-China and China-US), finding a dominant role for the US; Yi, Heng, and Wong (Citation2009) show that the Chinese stock market has stronger ties with the Hong Kong one than with the US one. The present study is the first to employ fractional cointegration methods to examine the stock market linkages between China, five core ASEAN economies (i.e., Indonesia, Malaysia, Philippines, Singapore and Thailand), and the US.
Another noticeable gap in the literature is the lack of evidence on the impact of the 2007–8 global financial crisis and the 2015 Chinese stock market crash on financial linkages in the region (with the exception of the contributions by Glick and Hutchison (Citation2013), Fang and Bessler (Citation2018) and Ahmed and Huo (Citation2018) already mentioned). Our recursive cointegration analysis sheds light on the dynamic pattern of stock market co-movements between China and the rest of Asia and between the US and Asia during tranquil and turbulent periods.Footnote1 It also provides evidence on regional pull and global push factors as in Shu et al. (Citation2018).
Finally, only limited attention has been paid in previous studies to intraregional banking in Asia. This has been on a steady rise in the past two decades, especially after the 2007–8 global financial crisis, when a prolonged period of low global long-term interest rates, new bank regulation and efforts to repair balance sheets opened up opportunities for banks in Asia to expand their activity within the region. The recent push for regional bank integration by the ASEAN member countries is likely to lead to even greater intra-regional lending. Chinese banks have become an increasingly important provider of cross-border bank credit to borrowers within Asia. According to the BIS international banking statistics, borrowers located in China accounted for almost half of the total increase in bank lending to emerging Asia in the first quarter of 2018. As pointed out by Koch and Remolona (Citation2018), the common lender (i.e., China) channel generates more risk for emerging Asia if the shocks originate from the Asian borrowers themselves. Therefore, a careful analysis, such as the one below, of the linkages between the largely bank-dominated financial sectors of China and the other Asian markets is most needed.
3. Empirical Methodology
To understand the fractional integration and cointegration methods used below some definitions are useful. In particular, a covariance stationary process {xt, t = 0, ±1, … } is defined to be I(0) or to exhibit short memory if the infinite sum of the autocovariances is finite, i.e., assuming γu = E(xt – Ext)(xt+u-Ext)), if
In this context, yt is said to be integrated of order d or I(d) if d is the value of the differencing parameter required to make it stationary and the process can be expressed as:
where L is the lag operator and xt is I(0). Then, if d > 0, yt is said to exhibit long-range dependence, so called because of the high degree of dependence between observations far apart in time. The polynomial on the left-hand side in (2) can be expressed in terms of its Binomial expansion, such that it can be expressed as:
Thus, the higher the value of d, the higher is the level of dependence between the observations, and, if d is fractional, yt depends on all its past history.
Note that the fractional differencing parameter provides crucial information about the stochastic behavior of the series. In particular, if d = 0 the series is short memory and satisfies Equationequation (1)(1)
(1) , while d > 0 implies long-range dependence with the sum of the autocovariances being infinite; if d < 0.5, the series is second-order stationary, while d ≥ 0.5 implies no-stationarity with respect to the variance; finally, d < 1 indicates mean reversion (the lower the value of d is, the faster is the process of convergence to its original trend), while d ≥ 1 implies lack of mean reversion.
Below we estimate d using two approaches, parametric and semi-parametric respectively, both based on the Whittle function in the frequency domain. The former uses a testing procedure due to Robinson (Citation1994) that is the most efficient method in the Pitman sense against local departures from the null. Another advantage of this approach is that it has a standard null limit distribution and this asymptotic behavior holds regardless of the inclusion of deterministic terms such as intercepts or linear trends. Moreover, it is valid for any real value of d and therefore it is not necessary to differentiate the series in case of non-stationary behavior. The latter is based on a local Whittle function with frequencies degenerating to zero. This method requires stationarity and therefore the analysis will be conducted on the first-differenced series, adding 1 to the estimated value of d.
Fractional cointegration is a natural extension of the concept of fractional integration to the multivariate case. In this paper we focus on bivariate relationships; following Engle and Granger (Citation1987), two series, y1t and y2t, are said to be cointegrated if a) both of them are integrated of the same order, say d, and b) if there exists a linear combination of the two which is integrated of a smaller order, say d – b, with b < 0. Note that in the original paper by Engle and Granger (Citation1987) the two parameters d and b were allowed to be fractional, though most of the empirical applications since then have focused on the integer case, with d = b = 1; only more recent studies have also allowed for fractional values. Below we test the order of integration of the differentials between the ASEAN stock indices and those of US and China, i.e. we impose the cointegrating vector to be exactly (1, −1) since estimating the cointegrating coefficients would require the computation of finite sample critical values for the confidence bands, which would be computationally very intensive.
4. Data and Empirical Results
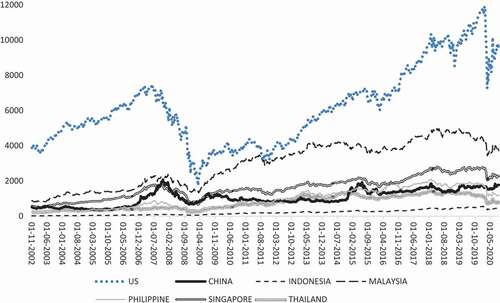
The series used for the analysis are weekly aggregate stock market indices as well as financial sector indices for China, the ASEAN five (i.e., Indonesia, Malaysia, Philippines, Singapore and Thailand) and the US from November 2002 to August 2020. The data source is Datastream. All the aggregate weekly series peak in 2007, decline sharply in 2008 and then increase steadily, though less obviously in the case of China, until mid-2014; another peak in 2015 is followed by a fall, more pronounced in the Asian countries than in the US, and then steady growth in 2016–2017 (with the exception of the Philippines); all series experienced a sharp drop in early 2020 due to the outbreak of the Covid-19 pandemic (see ). The financial sector indices (weekly) exhibit similar patterns, although the dips in 2007 and 2015 are more pronounced than for the aggregate indices (see ). The same patterns are exhibited by the monthly series. All series are logged for the empirical analysis below.
Figure 1. Weekly aggregate stock indices plots: China, ASEAN five and US.
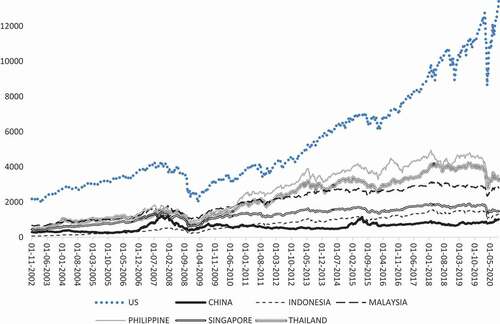
Figure 2. Weekly financial sector stock indices plots: China, ASEAN five and US.
As pretests, we carried out ADF unit root tests which suggest that all series follow an I(1) process, and also Johansen cointegration test whose results imply that there is no cointegration for any pair except the US and Indonesia in the case of the weekly aggregate series on the basis of the Maximum Eigenvalue at the 10% significance level.
4.1. Weekly Aggregate Stock Indices Evidence
Following standard parameterization for unit roots and non-stationary models (Bharghava Citation1986; Nabeya and Tanaka Citation1990; Schmidt and Phillips Citation1992; etc.), we allow for deterministic terms like an intercept and/or a time trend. We start by analyzing the weekly series and estimating the following model:
under the two cases of uncorrelated and autocorrelated errors, in the latter case using a non-parametric approach due to Bloomfield (Citation1973) that produces autocorrelations decaying at an exponential rate as in the ARMA case. We employ the Whittle estimator of d, along with the 95% confidence intervals corresponding to the non-rejection values of d using Robinson’s (Citation1994) parametric approach, for the three standard cases of no deterministic terms (α = β = 0 in (3)), an intercept (α estimated and β = 0), and an intercept and a linear time trend (i.e., α and β both unknown and estimated from the data).
Under the assumption of white noise errors there appears to be mean reversion (d < 1) in the case of the US; the unit root null hypothesis (i.e., d = 1) cannot be rejected for Indonesia, Singapore and Thailand whilst it is rejected in favor of higher orders of integration (d > 1) for all the other countries. When allowing for autocorrelation as in Bloomfield (Citation1973), evidence of I(d) behavior with d > 1 is found for China, Indonesia, the Philippines and Thailand, and evidence of I(1) behavior for Malaysia, Singapore and the US. On the whole, there is evidence of I(d) behavior with d = 1 or d > 1 in all cases, which implies that shocks have permanent effects.
Further estimates of d from the semiparametric approach for a selected group of bandwidth parameters, from 27 to 33, show that the I(1) hypothesis cannot be rejected for any of them in the case of Indonesia and Malaysia, and for some in the case of the Philippines and Thailand. These results are consistent with the parametric ones, since they also provide evidence of I(d) behavior with d = 1 or d > 1 in all cases.
Next we analyze the cointegrating relations with respect to both China and the US by considering the differentials between those two countries and the ASEAN ones. The results vis-à-vis China are reported in the first row of for each ASEAN five country. There is no evidence of mean reversion (d < 1), and thus of convergence, regardless of whether the residuals are assumed to be a white noise or an autocorrelated process, i.e. there is no evidence of convergence with respect to China.
Table 1. Estimates of d from the fractional cointegration regressions vis-à-vis China: weekly aggregate and financial sector stock indices
The first row of for each ASEAN country displays the results vis-à-vis the US. In this case, unlike the previous one, mean reversion and therefore convergence is found for all series. However, the adjustment process is slow, since the order of integration is large in all cases, ranging between 0.8 and 0.9. When allowing for autocorrelation, there is weaker evidence of convergence, and the unit root null is rejected for Malaysia but not in any other cases.
Table 2. Estimates of d from the fractional cointegration regressions vis-à-vis the US: weekly aggregate and financial sector stock indices
In brief, our analysis provides some weak evidence of convergence vis-à-vis the US, but none vis-à-vis China. This is consistent with recent studies on Asian stock markets finding that global integration between the Asian and US stock markets dominates regional integration (Kim and Lee Citation2012).
4.2. Weekly Financial Sector Indices Evidence
We use again the Whittle estimator of d for the financial sector indices for the three standard cases of no deterministic terms (α = β = 0 in (3)), an intercept (α estimated and β = 0), and an intercept and a linear time trend; the results are reported in the second row for each country in . The parameter d is estimated to be higher than 1 only in the case of Malaysia and the Philippines, whilst in all other cases the unit root null cannot be rejected except for the US, where mean reversion (d < 1) is found. When allowing for autocorrelation as in Bloomfield (Citation1973), a unit root is found in Indonesia, Thailand and the US, whilst in the other cases the order of integration is I(d, d > 1). Therefore, as in the case of the aggregate stock indices, there is evidence of shocks having permanent effects given the I(d) behavior of the series with d = 1 or d > 1 in all cases.
The estimates of d with the semiparametric approach for the same bandwidth parameters (i.e., from 27 to 33) imply that the I(1) hypothesis cannot be rejected for Indonesia; in the other cases, the estimated values of d are above 1. Thus, there is evidence of I(d) behavior with d = 1 or d > 1 in all cases, which is consistent with the parametric estimates above. In the case of China (second row of ), if no autocorrelation is allowed, there is no evidence of mean reversion (d < 1) and thus of convergence, except for some weak one in the case of Indonesia. When allowing for autocorrelation, no evidence of mean reversion is found in any single case. By contrast, the results for the US (second row of ) suggest mean reversion and thus convergence for all five ASEAN economies. The order of integration is relatively large in all cases (ranging between 0.8 and 0.9), which implies slow convergence. Under the assumption of autocorrelation, there is evidence of convergence only for the Philippines while the unit root null cannot be rejected in the case of Indonesia, Malaysia, Singapore and Thailand.
To sum up, as in the case of the aggregate stock indices, there is only weak evidence of convergence between the financial sector indices, with only one case of mean reversion vis-à-vis China (i.e., Indonesia without autocorrelated disturbances) compared to none when using the aggregate series. Further, the estimates of d for the financial sector indices vis-à-vis China (see second rows of ) are smaller than those for the aggregate indices (see first rows of ), which suggests closer integration of the financial sector. This can be explained by Chinese banks becoming an increasingly important provider of cross-border credit to the Asian economies (Koch and Remolona Citation2018).
4.3. Robustness Checks: Monthly Data
In this section we repeat the analysis using monthly data as a robustness check.Footnote2 These fractional integration and cointegration results are not presented here to save space but are available upon requests.
For the aggregate indices, the estimates based on the parametric method of Robinson (Citation1994) suggest that the unit root null hypothesis (i.e., d = 1) cannot be rejected for any of the aggregate indices but China (d = 1.19), for which it is rejected in favor of d > 1. Concerning the financial indices, the unit root null hypothesis (i.e., d = 1) again cannot be rejected in any cases except for China and Malaysia, for which it is rejected in favor of d > 1. This is true regardless of whether or not autocorrelated errors are allowed. Therefore there is evidence of I(d) behavior with d = 1 in practically all cases. The semi-parametric results for a selected group of bandwidth parameters, from 11 to 17, are consistent with the parametric ones, and provide further evidence of I(d) behavior with d = 1 in the majority of cases.
Next we test again for convergence. In the case of China, the time trend is only required vis-à-vis Indonesia with both white noise and autocorrelated errors for the financial indices. No evidence of mean reversion (d < 1) is found in any single case. As for the US results, evidence of mean reversion and hence convergence is found for Malaysia and Thailand in the case of the aggregate index but none in the case of the financial indices. However, the values of d are relatively large (i.e., 0.91 and 0.89 for Malaysia and Thailand respectively when autocorrelated errors are not allowed, and 0.95 for both countries when autocorrelation is allowed), which implies a very slow process of convergence. With autocorrelated disturbances, there is no evidence of reversion for either the aggregate or the financial indices.
On the whole, the monthly results are consistent with the weekly ones: although there are fewer instances of mean reversion, again there is stronger evidence of convergence between the ASEAN five and the US compared to China, especially for the aggregate indices. Lower frequency data such as monthly ones might not detect transient responses to innovations that may last for a short period only (Brailsford Citation1996; Palamalai, Kalaiwani, and Devakumar Citation2013). Therefore, we shall employ weekly data for the recursive cointegration analysis.
5. Recursive Cointegration Analysis
In this section we carry out recursive cointegration analysis using weekly data. In particular, we start with a sample of 114 observation, with data ending on 31/12/2004. Then, we add 20 observations (weeks) at a time recursively. display the estimates of d along with the 95% confidence bands, once more using Robinson’s (Citation1994) approach for the aggregate and financial sector indices respectively.
Figure 3. Recursive estimates of d from the fractional cointegration regressions: aggregate indices.
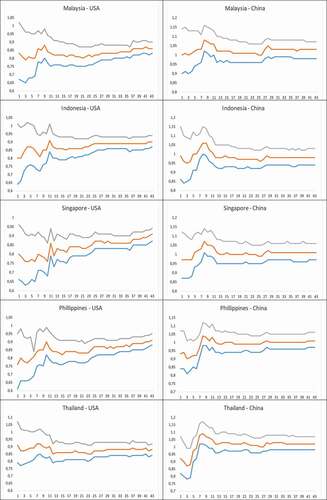
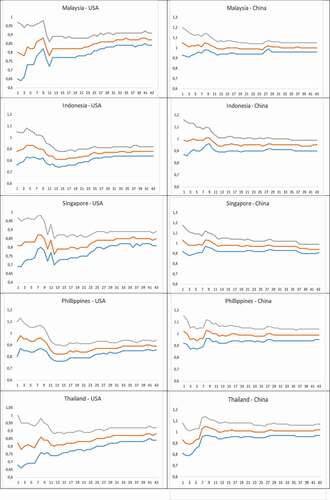
Figure 4. Recursive estimates of d from the fractional cointegration regressions: financial sector indices.
Concerning the aggregate results (see ), for the US evidence of mean reversion (d < 1) is found in all cases for Singapore and the Philippines, and for Malaysia, Indonesia and Thailand except for some initial values. However, for China, the I(1) hypothesis cannot be rejected in any single case.
More specifically, in all the aggregate cases, the estimates of d increase quickly during the period 2007–2008 and then start decreasing both vis-à-vis the US and China. This might reflect the impact of the 2007–8 global financial crisis that sent shockwaves to stock markets across the world. The rising estimates of d indicate that at that stage stock market linkages became weaker, especially between the ASEAN five and China, with d moving from below to above 1 in some cases (e.g., Singapore, Philippines and Thailand). This is in contrast to previous studies where stronger ASEAN-US (e.g., Shu et al. Citation2018) and ASEAN-China stock market linkages (e.g., Glick and Hutchison Citation2013) were found.
One possible explanation for the weaker financial linkages during this period is the overreaction hypothesis, which suggests that, after a series of bad news, investors become over-pessimistic about the future and send stock prices to unjustifiably low levels (Barberis, Shleifer, and Vishny Citation1998). In the case of the ASEAN-China linkages, different fiscal policy responses may also have contributed to the lack of co-movement during the crisis. (Bernanke Citation2009).
The financial sector indices (see ) exhibit similar patterns are found to those of the aggregate indices. Specifically, concerning convergence with respect to the US, the estimated values of d for Malaysia, Singapore and Thailand are significantly below 1, and the same is true for Indonesia and the Philippines apart from some initial values. The impact of the 2007–8 crisis seems to have been less pronounced in the financial sector since the estimate of d increases less than in the case of the aggregate indices. This reflects the fact that the transmission of the crisis to Asia took place mainly through trade as opposed to financial channels (Essers Citation2013). Regarding the ASEAN five-China linkages, the estimates of d for the financial sector indices (right panel of ) are lower than those for the aggregate indices (right panel of ) for all five countries. This can probably be attributed to the rise of regional banking in Asia and to the leading role played by Chinese banks as the dominant regional credit provider.
Further, in the second half of the sample period, in the case of China (i.e., right panels of ) the estimates of d remain stable until 2015 and then start decreasing and stabilizing for both the aggregate and financial sector indices. As previously mentioned, in 2015 there was a stock market crash in China and turbulence in several Asian markets in the region shortly after. This confirms the influence of the Chinese stock market on others in the region (Fang and Bessler Citation2018; Shu et al. Citation2015). However, the rising estimates of d during the Chinese stock market crisis period suggesting weaker linkages between financial sectors. Such weaker linkages might be attributed to the overreaction effect mentioned above and also to the fact that the main cause of the stock market crash in China was the sharp increase in the number of ordinary Chinese people investing in it. At the height of the crisis in July 2015, more than 50% of all companies listed on the Shanghai and Shenzhen stock exchanges stopped trading (Salidjanova Citation2015). Caporale, Gil-Alana, and Orlando (Citation2016) found a similar rising pattern of the estimates of d during the volatile crisis period in their study of European and US stock market integration.
Finally, the estimates of d in the case of the ASEAN five-US linkages have been consistently rising after the 2007–8 crisis (albeit gradually) until the end of the sample period (left panels of ). A similar trend is not present in the case of the ASEAN five-China linkages (i.e., right panel of ). This indicates co-movement between the stock markets of the ASEAN five and the US has been declining over time (see also Glick and Hutchison Citation2013; Wu, Meng, and Xu Citation2015). As for the impact of the Covid-19 pandemic (see ), the values of d between the ASEAN five and the US have continued to rise in the case of Singapore, Philippines and Indonesia, whilst in the case of Malaysia and Thailand they have fluctuated more despite the overall increasing trend. In contrast, vis-à-vis China, d has hardly changed in all five cases during the period corresponding to the Covid-19 pandemic. Similar patterns are observed for the financial sector over the same period (), although the changes in d between the ASEAN five and the US are less pronounced.
6. Conclusions
This paper examines stock market integration between the ASEAN five and the US and China, respectively, over the period from November 2002 to August 2020 using fractional integration and fractional cointegration methods; further, recursive cointegration analysis is carried out to study the impact of the 2007–8 global financial crisis and the 2015 China stock market crash. Our results can be summarized as follows.
First, the fractional integration tests suggest the presence of long-memory properties in all stock indices. Second, the cointegrating regression results provide evidence that there is closer integration between the ASEAN five and China in the bank-dominated financial sectors than in the case of the aggregate stock markets. Third, the recursive cointegration analysis shows a significant impact of the 2007–8 global financial crisis and the 2015 Chinese stock market plunge on the ASEAN five-US and ASEAN five- China stock market integration. Fourth, the 2015 China stock market turbulence had a much less significant impact on the Asian economies and did not affect much the financial linkages between the ASEAN five and the US. Finally, the recursive analysis indicates that stock market linkages have become weaker over time (including the period of the Covid-19 pandemic).
Our findings have several implications. First, they suggest that there is an opportunity for Chinese/Asian investors to diversify their portfolio by investing in the Asian/Chinese stock markets. Second, since Asian stock markets appear to be more integrated with the US than with China, more regional agreements in addition to the recent regional initiatives (e.g., the Chiang Mai Initiative in 2000, the Asian Bond Market Initiative (ABMI) in 2003, the new ABMI roadmap in 2008, the Chiang Mai Initiative Multilateralization in 2012) are desirable to promote further financial cooperation in the region. Third, building a greater financial resource pool (drawing on Asia’s rich foreign exchange reserve for instance) and strengthening the surveillance system would be desirable to deal with future financial crises (Asian Development Bank Citation2012). Finally, the rising of China as a regional economic power has played an important role in linking stock markets across the region (Glick and Hutchison Citation2013).
Future research could extend the analysis by using a multivariate framework as in the FCVAR approach of Johansen and Nielsen Citation2010, Johansen and Nielsen Citation2012) and also testing for breaks given their importance in a fractional integration context (Granger and Hyung Citation2004; Mikosch and Starica Citation2004).
Additional information
Funding
Notes
1. To our knowledge the only other study using recursive cointegration for China is due to Yang (Citation2003), who examined segmentation within China’s six stock markets (i.e., Shanghai A-share, Shanghai B-share, Shenzheng A-share, Shenzheng B-share, Hong Kong H-share, red chip stock) and did not find long-run linkages between them.
2. As argued by Raj and Dhal (Citation2008), although daily data capture the speedy transmission of information, since both short- and long-run dynamic linkages matter for market integration (Voronkova (Citation2004), Hassan and Naka (Citation1996)), less frequent (e.g., weekly as in the present study) stock returns are useful to avoid the problem of non-synchronous trading in some thinly traded stock markets (Cha and Oh Citation2000).
References
- Ahmed, A. D., and R. Huo. 2018. Impacts of China’s crash on Asia-Pacific financial integration: Volatility interdependence, information transmission and market co-movement. Economic Modelling In press. doi:https://doi.org/10.1016/j.econmod.2018.09.029.
- Arslanalp, S., W. Liao, S. Piao, and D. Seneviratne, 2016, China’s growing influence on Asian financial markets, IMF Working Papers No. 16/173, International Monetary Fund, Washington, DC.
- Asian Development Bank. 2012. The implications of a global financial crisis for Asia and the ADB: Lessons from evaluation, evaluation document, 30 June 2012. In Modeling and forecasting realized volatility (Working Paper), ed. T. Andersen, T. Bollerslev, F. Diebold, and P. Labys, Durham, NC: Duke University.
- Barberis, N., A. Shleifer, and R. Vishny. 1998. A model of investor sentiment. Journal of Empirical Economics 49 (3):307–43.
- Bernanke, B. S. (2009), Asia and the Global Financial Crisis, Speech as Chairman of the Board of Governors of the U.S. Federal Reserve System delivered at the Federal Reserve Bank of San Francisco’s Conference on Asia and the Global Financial Crisis, Santa Barbara, October 19th.
- Bharghava, A. 1986. On the theory of testing for unit roots in observed time series. Review of Economic Studies 53:36–84.
- Bloomfield, P. 1973. An exponential model in the spectrum of a scalar time series. Biometrika 60:217–26. doi:https://doi.org/10.1093/biomet/60.2.217.
- Brailsford, T. 1996. Volatility spillovers across the Tasman. Australian Journal of Management 21:13–27. doi:https://doi.org/10.1177/031289629602100104.
- Caporale, G. M., L. A. Gil-Alana, and C. J. Orlando. 2016. Linkages between the US and European stock markets: A fractional cointegration approach. International Journal of Finance and Economics 21 (2):143–53.
- Caporale, G. M., L. A. Gil-Alana, and K. You. 2018. Exchange rate linkages between the ASEAN currencies, the US dollar and the Chinese RMB. Research in International Business and Finance 44:227–38. doi:https://doi.org/10.1016/j.ribaf.2017.07.091.
- Cha, B., and S. Oh. 2000. The relationship between developed equity markets and the Pacific Basin’s emerging equity markets. International Review of Economics and Finance 9:299–322. doi:https://doi.org/10.1016/S1059-0560(00)00057-5.
- Chen, H., B. L. Lobo, and W. K. Wong. 2006. Links between the Indian, U.S. and Chinese Stock Markets, Departmental Working Papers wp0602, National University of Singapore, Department of Economics.
- Dolatabadi, S., M. Ø. Nielsen, and K. Xu. 2015. A fractionally cointegrated VAR analysis of price discovery in commodity futures markets. Journal of Futures Markets 35:339–56. doi:https://doi.org/10.1002/fut.21693.
- Engle, R. F., and C. W. J. Granger. 1987. Cointegration and error-correction: Representation. Estimation and Testing, Econometrics 35:1433159. May.
- Essers, D. 2013. Developing country vulnerability in light of the global financial crisis: Shock therapy? Review of Development Finance 3:61–83. doi:https://doi.org/10.1016/j.rdf.2013.02.001.
- Fan, K., Z. Lu, and S. Wang. 2009. Dynamic linkages between the China and international stock markets. Asia-Pacific Financial Markets 16 (3):211–30. doi:https://doi.org/10.1007/s10690-009-9093-5.
- Fang, L., and D. A. Bessler. 2018. Is it China that leads the Asian stock market contagion in 2015? Applied Economics Letters 25 (11):752–57. doi:https://doi.org/10.1080/13504851.2017.1363854.
- Fratzscher, M., and A. Mehl. 2014. China’s dominance hypothesis and the emergence of a tri-polar global currency system. Economic Journal 124 (581):1343–70. doi:https://doi.org/10.1111/ecoj.12098.
- Glick, R., and M. Hutchison. 2013. China’s financial linkages with Asia and the global financial crisis. Journal of International Money and Finance 39:186–206. doi:https://doi.org/10.1016/j.jimonfin.2013.06.025.
- Granger, C. W. J., and N. Hyung. 2004. Occasional structural breaks and long memory with an application to the S&P 500 Absolute Stock Returns. Journal of Empirical Finance 11:213–228.
- Hassan, M. K., and A. Naka. 1996. Short-run and long-run dynamic linkages among international stock markets. International Review of Economics and Finance 5 (4):387–405. doi:https://doi.org/10.1016/S1059-0560(96)90025-8.
- He, D., Z. Zhang, and H. Wang. 2009. Hong Kong’s financial market interactions with the US and Mainland China in crisis and tranquil times, HKMA Working Papers, no 10/2009.
- Hosking, J. R. M. 1981. Modelling persistence in hydrological time series using fractional differencing. Water Resources Research 20:1898–908. doi:https://doi.org/10.1029/WR020i012p01898.
- Johansen, S., and M. O. Nielsen. 2010. Likelihood inference for a nonstationary fractional autoregressive model. Journal of Econometrics 158:51–66. doi:https://doi.org/10.1016/j.jeconom.2010.03.006.
- Johansen, S., and M. O. Nielsen. 2012. Likelihood inference for a fractionally cointegrated vector autoregressive model. Econometrica 80:2667–732.
- Kim, S., and J. W. Lee. 2012. Real and financial integration in East Asia. Review of International Economics 20 (2): 332–49.
- Koch, C., and E. M. Remolona. 2018. Common lenders in emerging Asia: Their changing roles in three crises. BIS Quarterly Review March:17–28.
- Lean, H. H., and R. Smyth. 2014. Stock market co-movement in ASEAN and China. In Emerging markets and the global economy, ed. M. Arouri, S. Boubaker, and D. K. Nguyen, 603–22. Oxford, UK: Elsevier.
- Liu, L., H. L. Chang, C.-W. Su, and C. Jiang. 2013. Real interest rate parity in East Asian countries based on China with flexible fourier stationary test. Japan and the World Economy 25–26:52–58. doi:https://doi.org/10.1016/j.japwor.2013.01.003.
- Mikosch, T., and C. Starica. 2004. Nonstationarities in financial time series, the long ragne dependence and the IGARCH effect. Review of Economics and Statistics 86 (1):378–90. doi:https://doi.org/10.1162/003465304323023886.
- Nabeya, S., and K. Tanaka. 1990. Limiting power of unit root tests in time series regression. Journal of Econometrics 346:247–71. doi:https://doi.org/10.1016/0304-4076(90)90010-Q.
- Palamalai, S., M. Kalaiwani, and C. Devakumar. 2013. Stock market linkages in emerging Asia-Pacific markets. Sage Open 3:1–15. doi:https://doi.org/10.1177/2158244013514060.
- Raj, J., and S. Dhal. 2008. Integration of India’s stock market with global and major regional markets, in regional financial integration in Asia: Present and future, Bank of international settlements, Paper No 42(2008).
- Robinson, P. M. 1994. Efficient tests of nonstationary hypotheses. Journal of the American Statistical Association 89 (428):1420–37. doi:https://doi.org/10.1080/01621459.1994.10476881.
- Salidjanova, N. 2015. China’s stock market collapse and government’s response. Washington, DC: U.S.-China Economic and Security Review Commission Issue Brief. US government.
- Schmidt, P., and P. C. B. Phillips. 1992. LM tests for a unit root in the presence of deterministic terms. Oxford Bulletin of Economics and Statistics 54:257–87. doi:https://doi.org/10.1111/j.1468-0084.1992.tb00002.x.
- Shu, C. 2010. Impact of the Renminbi exchange rate on Asian currencies. In Currency internationalization: Global experiences and implications for the Renminbi, ed. W. Peng and C. Shu, Chapter 5, 115–38. London: Palgrave Macmillan.
- Shu, C., D. He, H. Wang, and J. Dong. 2015. The Influence of Chinese and US Financial Markets on Asia-Pacific, BIS Paper No. 82, Bank for International Settlements, Basel.
- Shu, C., D. He, J. Dong, and H. Wang. 2018. Regional pull vs global push factors: China and US influence on Asian financial markets. Journal of International Money and Finance 87:112–32. doi:https://doi.org/10.1016/j.jimonfin.2018.04.004.
- Singh, A., and P. Kaur. 2016. Do BRIC countries’ equity markets co-move in long run? Theoretical Economics Letters 6:119–30. doi:https://doi.org/10.4236/tel.2016.62014.
- Srinivasan, P., M. Kalaivani, and C. Devakumar. 2013. Stock Market Linkages in Emerging Asia-Pacific Markets, SAGE Open, October-December 3, Issue, 1–15.
- Subramanian, A., and M. Kessler. 2012. The renminbi bloc is here: Asia down, rest of the world to go?, Peterson Institute for International Economics Working Paper No. 12–19.
- Voronkova, S. 2004. Equity market integration in central European emerging markets: A cointegration analysis with shifting regimes. International Review of Financial Analysis 13:633–47. doi:https://doi.org/10.1016/j.irfa.2004.02.017.
- Wu, L., Q. Meng, and K. Xu. 2015. ‘Slow-burn’ spillover and ‘fast and furious’ contagion: A study of international stock markets. Quantitative Finance 15 (6):933–58. doi:https://doi.org/10.1080/14697688.2014.952242.
- Yang, J. 2003. Market segmentation and information asymmetry in Chinese stock markets: A VAR analysis. The Financial Review 38 (4):591–609. doi:https://doi.org/10.1111/1540-6288.00062.
- Yi, Z., C. Heng, and W. K. Wong. 2009. China’s stock market integration with a leading power and a close neighbor. Journal of Risk and Financial Management 2:38–74. doi:https://doi.org/10.3390/jrfm2010038.