
 ?Mathematical formulae have been encoded as MathML and are displayed in this HTML version using MathJax in order to improve their display. Uncheck the box to turn MathJax off. This feature requires Javascript. Click on a formula to zoom.
ABSTRACT
In this study, we investigate the degree to which inflation-rate movements for countries in the East African Community (EAC) have become more similar, which is an important issue for the EAC’s goal of creating a common currency. For the five EAC countries (excluding South Sudan), we find that comovements in inflation rates generally became more similar between 1995 and 2018. A decrease in the correlations of the three largest EAC members with the rest of the EAC (from each of their perspectives) after 2013 is concerning for a smoothly running monetary union.
1. Introduction
Since November 2013, the East African Community (EAC) has been involved in a project of creating a monetary union by 2024. Whether such a union will be fruitful depends on the degree of benefits arising from greater economic interaction that a common currency could promote and the costs arising from the different countries not being able to apply monetary policy independently for optimal support of their economies (see, for example, Mundell Citation1961). These costs are typically higher when countries within the monetary union face asymmetric economic shocks. Greater asymmetry in economic shocks among member countries may be reflected by lower correlation in inflation rates among those countries. The purpose of this paper is to investigate whether correlations in the inflation rates among the EAC countries have become more similar, especially since 2013.
Such an investigation is much different than looking into whether inflation rate levels among countries considering a common currency are converging. Whether inflation rates are converging is an important issue when considering a monetary union: substantial discrepancies in inflation levels prior to implementing a common currency will lead to one or more countries needing to adjust quickly to a much different inflation level, which can lead to economic disruptions, and large inflation-level differences themselves can reflect asymmetric economic structures that could lead to the monetary union not running smoothly. In the case of the EAC, there have been made many studies on this issue, most recently by Dridi and Nguyen (Citation2019), who found substantial evidence that the inflation rates among the EAC members have been converging.
However, considering the degree to which the inflation rates have similar variations is also an important issue, since lower correlation in inflation rates prior to monetary union can be associated with greater real output variation of the participating economies when participating in the monetary union. The subsequent theoretical section in this paper demonstrates this issue. Various other studies on monetary unions in different country or regional contexts have dealt with the closely connected issue of correlations in output cycles (e.g., Mora, Hurtado, and Zerpa de Hurtado Citation2020, who also looked at commonalities of inflation cycles, as indicated by inflation correlations, as a relevant matter for considering the costs of a monetary union among the Mercosur countries).
Kishor and Ssozi (Citation2010) presented Pearson correlations between quarterly inflation rates for pairs of EAC countries for 1981:Q3 to 2000:Q2 and 2000:Q3 to 2009:Q1. They found that in the earlier period the correlations in inflation rates among these countries were negative or below 10%, except for the Burundi and Rwanda country pair and the Tanzania and Uganda country pair. In the later period, representing the era starting with the EAC Treaty coming into force, they found all correlations between pairs of country to range between 32.3% and 48.2%. Nyirakanani (Citation2018) provides a snapshot of Spearman inflation correlation coefficients among the EAC countries for 2006:M01 – 2017:M09 and found that they were low but significantly positive across those EAC countries.
In the current paper we fill some gaps in the literature in the following ways:
We investigate the evolution of inflation-rate correlations among EAC countries, extending our knowledge of how they evolved after the countries agreed in 2013 to create a monetary union in ten years. Our data ends about 9 years after the coverage of Kishor and Ssozi (Citation2010). In her presentation of inflation correlations, Nyirakanani (Citation2018) did not distinguish between the period before and after the agreement to form a monetary union in the EAC.
We apply a non-parametric measure of correlation, Kendall’s tau, due to the existence of outliers and non-normality in the monthly inflation-rate data. Kishor and Ssozi (Citation2010) likely faced similar difficulties with outliers with their monthly inflation data, but they presented only Pearson correlations coefficients. Nyirakanani (Citation2018) provided inflation correlation information with another non-parametric measure, the Spearman rank-order correlation measure, but that measure is more sensitive to error than Kendall’s tau.
We investigate inflation rate correlations using rolling windows of five years to reduce the effects of structural breaks. The rolling-window method also allows us to observe local trends in inflation-rate correlations, most importantly the more recent ones.
We apply another measure, known as a similarity index, to consider whether among the EAC countries there has been a trend of greater similarity in the rises and falls in their inflation rates.
Our dataset consists of monthly EAC inflation data from 1995 to 2018. The EAC data we consider are for the five countries that agreed in 2013 to form a monetary union – Burundi, Kenya, Rwanda, Tanzania, and Uganda; hence, in this paper, the term “EAC” refers to these five countries. Our results indicate that inflation-rate changes between consecutive months trended toward becoming more similar between 1995 and 2018 for most country pairs from the five EAC countries. Furthermore, based on the Kendall’s tau correlations, we observe a strengthening in the inflation-rate comovements of the EAC countries over the whole period of our dataset. The inflation-rate correlations for the EAC countries in 2014–2018 are typically stronger than the analogous ones for the 2001 European Monetary Union (EMU) countries in the five years prior to the creation of the euro and are stronger than the analogous ones recently seen in the West African Economic and Monetary Union (WAEMU). These results are favorable to the success of the proposed monetary union among the EAC countries. Nevertheless, correlations in inflation rates among the three largest EAC economies (Kenya, Tanzania, and Uganda) appear lower after peaking in the 2010–2013 period.
The rest of this study is organized as follows. The next section provides the theoretical framework. Section 3 provides background on the monetary union project in the EAC and inflation convergence among the EAC economies. Section 4 describes the data that are used for the empirical work. Section 5 provides our findings on similarity indices for the EAC countries and presents our results regarding inflation-rate correlations among these countries. Section 6 provides conclusions for the study.
2. Theoretical Framework
The theoretical presentation is in the tradition of the “New Keynesian” monetary model of Clarida, Galí, and Gertler (Citation1999) and closely follows the exposition given in Karras (Citation2002, Citation2003a, Citation2003b, Citation2005, Citation2012), Furceri and Karras (Citation2008), Mora (Citation2006), and Hurtado and Mora (Citation2018), and Mora, Hurtado, and Zerpa de Hurtado (Citation2020).
Suppose country’s i’s monetary authority (i = 1,2, …, N, for N countries being considered for the monetary union) has the loss function
where t is time, E is the mathematical expectation operator, y is the departure of real output from its trend, π is inflation, and β > 0, k ≥ 0, and a > 0 are constants, respectively representing the discount factor, the real output target, and the weight on output deviations. A “New Keynesian” expectations-augmented Phillips’s curve determines country i’s inflation rate:
where λi > 0 and ui,t is a random variable following the following process
Solving EquationEquation (2)(2)
(2) for yi,t, we get
where vit = -uit/λi. The variance in vit is derived to be .
When each central bank can determine an optimal monetary policy independently for its own economy, the loss function in EquationEquation (1)(1)
(1) is minimized subject to EquationEquations (2)
(2)
(2) and (Equation3
(3)
(3) ), resulting in inflation being
where , and the “IND” superscript is provided to indicate variables in the independent monetary policy scenario.
In contrast, if there is a monetary union in which a common central bank sets monetary policy using a loss function like that given by EquationEquation (1)(1)
(1) but using output and inflation values for the whole monetary union, then the analogous equations to EquationEquations (1)
(1)
(1) –(Equation4
(4)
(4) ) for the monetary union would be the same as EquationEquations (1)
(1)
(1) –(Equation4
(4)
(4) ) with “i” replaced with “MU.” The inflation across the monetary union,
, is what each individual country would face under the monetary union scenario, so analogous to EquationEquation (5)
(5)
(5) ,
where the “UNION” superscript is used on the individual-country variables in this scenario. If we substitute EquationEquation (6)(6)
(6) into the right-side of EquationEquation (4)
(4)
(4) , and take into account that
due to EquationEquation (3)
(3)
(3) with i replaced with MU, we get after simplifyingFootnote1
for which we can find the variance to be
where is the variance in
and
is the correlation between
and
. Since the two latter variables are simply
and
multiplied by constants,
also represents the correlation between
and
. For the current paper, the relevant issue is that as the correlation between a country’s inflation when outside the monetary union and the inflation in the monetary union increases, the variability of that country’s real output when in the monetary union decreases, all else equal. Therefore, greater correlation in inflation among the countries prior to joining the monetary union would tend to reduce the output-variability costs associated with monetary union.
3. Background
In November 2013, the five East African Community (EAC) member countries at that timeFootnote2 – Burundi, Kenya, Rwanda, Tanzania, and Uganda – agreed to create a monetary union within ten years. The Protocol on the Establishment of the East African Monetary Union (EAMU) indicates the macroeconomic convergence criteria that need to be achieved and sustained for at least three consecutive years prior to the 2024 introduction of the single currency. The criteria include, inter alia, a core inflation ceiling of 5% as well as a headline inflation ceiling of 8% (for more details, see EAC Citation2013). These criteria as well as the other three key criteria provided subsequently are rooted in theoretical considerations as to what conditions support a common currency, as discussed in optimum currency area (OCA) theory (early contributions to this theory are Mundell Citation1961; McKinnon Citation1963; Kenen Citation1969).
presents the development of the annual inflation rates over the period 1996–2018 for the five EAC countries. What we observe from the figure is a general comovement of the inflation rates between these five countries over the period 1996–2018. Nevertheless, these inflation rates were often above the ceiling of the convergence criterion (8%), the exception being over 2013–2018, the period in which some convergence in inflation levels seemed to be apparent. However, around 2017, there was a notable inflation increase in Burundi to above the ceiling, and Kenya and Rwanda nearly hit the ceiling during that time. Importantly, there was a substantial drop in inflation from the beginning of 2008 until 2010 in all five countries. This drop was likely connected to the financial global crisis in 2008–2009. Indeed, due to the global recession, one would expect a large drop in demand, which would in turn bring all prices to a low level.
Figure 1. Annual inflation rates for the EAC countries (1996–2018).
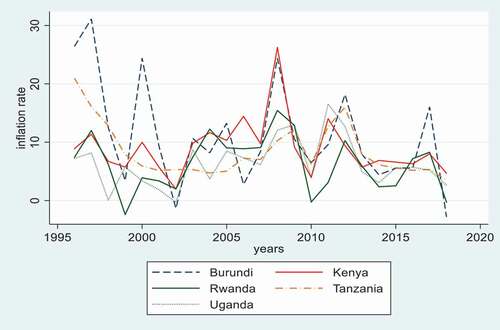
In 2011, the inflation rate in all the EAC countries started to rise again, with a dramatic increase in 2012 that lasted until the following year. As highlighted in the AfDB [African Development Bank] (Citation2012) report, the July 2010–July 2011 higher inflation episode for Kenya, Tanzania and Uganda was driven by higher oil prices (which contributed 20%, 26%, and 21%, respectively, to these countries’ inflation in the short run), although for Uganda, monetary expansion contributed even more (32%). The report also found that the short-run contribution to inflation from world food prices during this period was 9% in Tanzania, 11% in Kenya, and 13% in Uganda (for details, see AfDB [African Development Bank] Citation2012).
Studies on inflation convergence among African countries are numerous. Dridi and Nguyen (Citation2019), who focused on EAC countries, reviewed a substantial number of studies focusing on African monetary unions, especially those focusing on the inflation convergence among the EAC members (their reviewed studies involving the EAC included Kishor and Ssozi Citation2010; Drummond et al. Citation2015; Carcel, Gil-Alaña, and Madigu Citation2015, to name but a few). In their own research, Dridi and Nguyen (Citation2019) found support for convergence in the inflation rates in the EAC based on panel unit-root tests using 2000M1-2015M12 inflation data on the five EAC countries. We similarly find support for convergence in inflation rates among these economies using unit root and stationarity tests in 2013M11-2018M12. Since that is not the main focus of this paper, those results have been relegated to Table S1 in the Supplemental MateriaI for interested readers. In this paper, the issue in focus is the degree to which EAC countries have been facing similar inflation movements and whether that has changed over time.
4. Data
All the inflation data used in this study are based on monthly CPI data collected in June 2019 from the IMF’s International Financial Statistics (Citation2019) database. The study focuses primarily on month-to-month inflation data in the EAC countries 1995M05-2018M12 (thereby requiring 1995M04-2018M12 CPI data), both without and with seasonal adjustment.Footnote3 Seasonal adjustments are performed on the monthly inflation data through the Census X-12 procedure in EViews version 11 using additive X-11 seasonal adjustment along with the automatic (X-12 default) trend filter by Henderson (Citation1916) and no ARIMA specification.
Annual data on real GDP (output-side at chained purchasing power parities; see Feenstra, Inklaar, and Timmer Citation2015) were collected from the St. Louis FRED database.Footnote4 and are averaged over years (1995–2017 for EAC countries) to provide weights to calculate average inflation rates for other countries in the EAC.
The results in the next section are presented for both monthly data that have been seasonally adjusted through the previously noted procedure and data that have not. The argument for considering seasonally adjusted data is that since seasonal inflation shocks are recognized as temporary, they are not relevant for monetary policy adjustments. On the other hand, common seasonal variations in inflation may reveal commonalities in economic structures that are relevant for monetary union considerations, and imperfections in the seasonal adjustment process may create patterns in inflation movements that are not actually present. Maravall (Citation1995) stressed that seasonal adjustment along with detrending, as in the X-11 filter, generates a spectral peak that is non-negligible for a cyclical frequency, and Wright (Citation2013) was concerned that the bandwidth typically used in the X-12 filter is too low. For these reasons, the results are presented for both data that are not seasonally adjusted data and data that are. Beyond seasonal adjustment, Stata version 15.1 was used to generate the Subsection 5.1 results and EViews version 11 was used to generate the Subsection 5.2 results.
5. Methodology, Results, and Discussion
5.1. Trend in Similarity Indices of Inflation Changes for EAC Countries
In this subsection, we investigate the similarity of monthly inflation rate changes between two consecutive time periods for pairs of EAC countries. This approach takes a very short-term perspective by considering only similarity in movement between consecutive periods. The similarity index of inflation-rate movements between countries is measured as follows (see Gianelle, Montinari, and Salotti Citation2017; Giannone, Lenza, and Reichlin Citation2008; Kalemli‐Ozcan, Papaioannou, and Peydro Citation2013, who use an analogous index when measuring the similarity of business cycles between countries):
where and
denote the time-t inflation rates in countries i and j, respectively (with
, given the five EAC countries), and
is the difference operator. Higher values of the index indicate greater similarity in inflation-rate changes, with perfect similarity reflected by the upper bound of zero. We investigate whether inflation-rate changes have been converging, i.e., have tended to become more similar over time, by simply regressing the similarity index on a time trend based on the following regression equation using 1995M05-2018M12 data:
where t (time) is the independent variable, measured in number of months since the first month used, and is the error term (in each regression, the i and j subscripts do not vary since panel regressions are not used). A positive sign for
is indicative of convergence. We applied the Newey and West (Citation1987) method to estimate the standard errors since the Breusch-Godfrey tests show that the error terms are serially correlated in all country pairs.Footnote5
The regression results of the model in EquationEquation (10)(10)
(10) for each of the 10 country pairs among the EAC countries are reported in . Again, we report results for both data that are not seasonally adjusted and data that are. Overall, these results show that the estimated coefficient on the time variable is significantly positive for most of the country pairs. Only the estimates for the Kenya-Rwanda and Tanzania-Rwanda pairs show lower significance (10% significance level) for data without seasonal adjustment, and only the estimates for the Tanzania-Rwanda and Uganda-Rwanda pairs are non-significant for data that are seasonally adjusted. In all the pairs, regardless of seasonal adjustment, the estimated coefficient on the time variable is positive.
Table 1. Regression results based on the model in EquationEquation (10)(10)
(10)
Based on the results in , we can conclude that the short-term inflation-rate movements between each of the country pairs are converging, albeit Rwanda’s. convergence with the three original founders of the EAC is still weak, especially for data that are seasonally adjusted. Nevertheless, given that all the estimated coefficients are positive, it is a good sign for a successful monetary union that the inflation rate changes for the five EAC countries are becoming more similar. Although the estimated coefficients are small both for data without and with seasonal adjustments, the highest coefficient, 0.009, between Tanzania and Burundi, using data without seasonal adjustment, indicates that the inflation rate changes are becoming closer by an average of 0.009 percentage points each month, or 0.108 percentage points over a year. Other country pairs showing strong convergence in inflation-rate changes, both for data that are not seasonally adjusted and data that are, are Kenya-Burundi, Uganda-Burundi, and Rwanda-Burundi. Each of these pairs converged at a rate of at least 0.007 percentage points per month for data both with and without seasonal adjustment.
One can argue that the recent convergence in inflation-rate changes and inflation-rate levels is the result of the efforts these countries are making to achieve monetary policy harmonization to deal with inflation. For instance, according to the EAC (Citation2018) governors’ report, the countries in the EAC have made substantial progress in implementing some of the key priorities, such as putting in place requirements for an adoption of a price-based/inflation-targeting monetary policy framework, including liquidity forecasting and reserve requirements (both national and international). Moreover, they have harmonized monetary policy implementation processes through the development of interbank markets and monetary policy communication strategies, among other developments (EAC Citation2018). However, the report also highlights that the partner states’ central banks are at different stages regarding the harmonized policies meant for the transition period to a monetary union.Footnote6
5.2. Correlation in Inflation
This subsection investigates the degree to which monthly inflation rates are correlated between each EAC member and the other countries in the EAC. It considers both the most recent correlations and those in the recent past.
Before presenting the correlation results, it is relevant to consider the stationarity properties of the data, as correlation findings between nonstationary variables could simply be spurious. The results from some standard unit-root and stationarity tests are presented in Table S2 in the Supplemental Material. That table indicates that stationarity is supported in the vast majority of country-period cases, for four historical periods (1995M05-2000M06, 2000M07-2009M06, 2009M07-2013M10, and 2013M11-2018M12).Footnote7,Footnote8 Similarly, Table S3 in the Supplemental Material shows support for stationarity in the EAC inflation rates over 1995M05-2018M12 based on more recent unit root tests by Narayan and Popp (Citation2010), who allow for a trend and two endogenously determined structural breaks in the level and in both the level and the trend, and Narayan and Liu (Citation2015), who allow for a trend, GARCH (1,1) errors, and structural breaks in the level. Therefore, it appears reasonable to investigate correlations between each country’s inflation series and the weighted averages of other EAC-country inflation series.
Table S4 in the Supplemental Material presents the results from Shapiro-Wilk tests for normality regarding the inflation rates of each EAC country in the four historical periods. The table indicates the frequent appearance of non-normality in the data series, both without and with seasonal adjustment. To avoid problems arising from non-normality and the existence of outliers, a nonparametric measure of correlation is used. Specifically, the correlation measure used is the Kendall rank correlation (tau) coefficient, which captures the ordinal association between a couple of variables.
If observations of data for the same period from the two series are both ranked higher or both ranked lower than another set of observations from another period, then that pair of observations (from both series for the two time periods) is in agreement on the ranking and is said to be concordant. If the observations instead disagree on the ranking, they are said to be discordant. With n representing the length of each data series, nc representing the number of concordant pairs, and nd representing the number of discordant pairs, the basic definition of Kendall’s tau (Kendall Citation1938), without ties (repeated values in one or both data series), is given by:
Kendall’s tau can range from −1 (perfect disagreement in rankings) to 1 (perfect agreement in rankings), and independent random series tend to have a Kendall’s tau value of approximately 0. The specific form of Kendall’s tau used in this paper is tau-b (Kendall Citation1945), which accounts for ties through a slightly more complex formula than the basic Kendall’s tau formula, with some variation across software due to computational efficiency issues.
presents the results for the Kendall’s tau-b correlations between each country’s inflation rate and the weighted average of the inflation rates of the other EAC members in rolling five-year correlations are shown so that we can observe local trends. The year noted for each data point is the midpoint of the five years used to calculate the correlations, or, more precisely, the 31st month in the 60-month window used in that calculation. The figure shows that for all five countries, the correlations rise after 2001 (except for Rwanda when using seasonally adjusted data). However, Burundi shows a small decline in its inflation correlation with other EAC countries after 2013, and Kenya, Tanzania, and Uganda show substantial dips in the correlation around 2013–2014. Rwanda shows a dramatic rise in its correlation with the rest of the EAC after 2012, but its highest correlation with the rest of the EAC occurred in the around 2003–2005 based on the data without seasonal adjustment and around 2000–2001 based on seasonally adjusted data. After 2013, when the goal of creating a common currency for the EAC countries was agreed upon, Rwanda shows an increased correlation of its inflation rate with that of the rest of the EAC, but the same cannot be said of Kenya, Tanzania, and Uganda, which show reduced correlations over this time, and it can be said for Burundi only regarding its seasonally adjusted data. All countries show significantly positive correlations at the 5% significance level for the last 5-year period. Burundi, Kenya, and Uganda also show such significance for all 5-year periods back to at least late 2007, whereas Rwanda and Tanzania show more recent episodes of no significance in each of their correlations with the rest of the EAC.
Figure 2. Rolling Kendall’s tau among EAC countries.
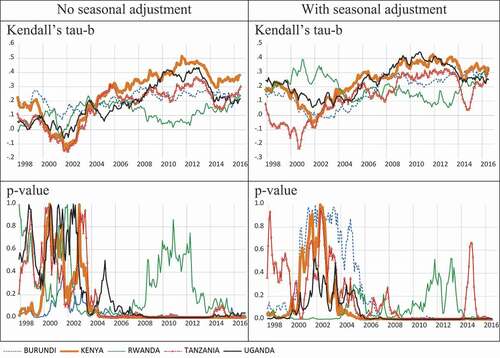
The observation that the correlation of the inflation rates with those of the rest of the EAC peaked in the 2010–2013 period for each of the three largest economies may be connected to world oil prices, which were notably higher in this period than in the other periods. Refined petroleum was the top import at the 4-digit level in each of these three countries and Burundi according to the 2018 International Trade Statistics Yearbook (United Nations, Department of Economic and Social Affairs, Statistics Division Citation2019). All else being equal, when oil prices are high, a 1% change in the oil price is expected to have a larger effect on each economy, with a similar sign of that effect for each economy. However, Burundi did not experience a strong subsequent diminution of the correlation of its inflation rate with those of the rest of the EAC, despite it also having refined petroleum as its top import.
For the last five-year period presented in , 2014M01 – 2018M12, Kendall’s tauranges from 0.217 (Uganda) to 0.376 (Kenya) when using non-seasonally adjusted data, and it ranges from 0.249 (Uganda) to 0.323 (Kenya) with the seasonally adjusted data.Footnote9 Are these magnitudes high for a set of countries aiming to have a single currency? To help answer this question, we compare these inflation correlations to similarly calculated inflation correlations for the twelve countries in the European Monetary Union (EMU) by 2001 and the eight countries in the West African Economic and Monetary Union (WAEMU). Again the correlations are calculated between the inflation of each country and a GDP-weighted aggregate inflation of the others in the same group (the other 2001-EMU members and the other WAEMU members respectively). The results are presented in Tables S6 and S7 in the Supplemental Material. The studied EMU countries all joined the EMU in 1999 except Greece, which joined in 2001. All the WAEMU countries use the West African CFA franc, which is pegged to the euro.
For each of the twelve 2001-EMU countries, we collected Kendall’s tau values for the sixty-month period prior to the launch of the euro, 1994M01 – 1998M12, and the sixty-month period of 2014M01-2018M12. During the earlier period, the median Kendall’s tau across the countries was 0.119 using seasonally unadjusted data and was 0.173 using seasonally adjusted data. These correlations are below those presented for the EAC countries in the 2013M11-2018M12 period, in which the lowest Kendall’s tau over all five countries was 0.217 using non-seasonally adjusted data and was 0.249 using seasonally adjusted data. During the 2014M01-2018M12 period for the 2001-EMU countries, the Kendall’s tau values were typically much higher: the median Kendall’s tau across the countries was 0.387 using seasonally unadjusted data and was 0.412 using seasonally adjusted data. This much stronger set of inflation correlations for the EMU members in comparison to the 1994–1998 period may be attributed to success in integrating the EU economies, a process in which a common currency was instrumental.Footnote10
Across the eight members of the WAEMU during the period 2014M01–2018M03, the latest 60-month period for these countries available at the time of this study, the median Kendall’s tau value across the countries was 0.073 using data without seasonal adjustment and was 0.018 using seasonally adjusted data. These median values are lower than the analogous ones presented for the EAC countries in the 2013M11-2018M12 period. In considering only inflation correlations, the EAC countries are arguably better positioned for a common currency than the WAEMU countries have been recently.
6. Conclusions
In this study, we have explored how inflation-rate levels and inflation-rate movements for EAC countries have developed over time. Through a similarity index, we have shown that for most country pairs (8 of 10) among the five EAC countries, changes in inflation between consecutive months became more similar between 1995 and 2018.
We also explored inflation-movement similarities through a rank-correlation measure, Kendall’s tau, applied to monthly data over historically relevant periods and over rolling 5-year periods. Overall, the correlations between the EAC countries seem favorable to monetary union when these correlations are compared to analogous ones for the 2001 EMU countries prior to the creation of the euro. These results are supportive of the success of the planned EAC monetary union, but there is some cause for concern regarding the decrease in the correlations of the three largest EAC members with the rest of the EAC (from each of their perspectives) after 2013. The recent decline in these inflation correlations suggest that the EAC needs to consider more the differences in economic shocks these countries face and accordingly improve mechanisms for inter-EAC financial transfers to deal with asymmetric shocks.
Supplemental Material
Download MS Word (58.1 KB)Acknowledgments
We are grateful to Almas Heshmati, Thomas Rusuhuzwa Kigabo, Guglielmo Maria Corporale, Luis Alberiko Gil-Alaña, and Andreas Stephan for their valuable comments. We also thank others providing commentary on this paper at seminars and defenses held at Jönköping International Business School, Jönköping University. An earlier version of this paper is a chapter in Yvonne Umulisa’s 2020 doctoral thesis, The Prospects for the East African Monetary Union: An Empirical Analysis, JIBS dissertation Series 135, published by Jönköping International Business School.
Disclosure Statement
No potential conflict of interest was reported by the author(s).
Supplementary Material
Supplemental data for this article can be accessed on the publisher’s website.
Notes
1. The reaction of inflation to output may be considered similar across the monetary union given a common monetary policy, so λMU may be considered the same as λi , a finding that is also used in the derivation of equation (7).
2. The EAC (an intergovernmental organization) is now composed of six countries, as South Sudan joined it in September 2016. The EAC was reestablished between Kenya, Tanzania, and Uganda in July 2000 following a previous version of it that existed in 1967–1977. Burundi and Rwanda joined the EAC in July 2007.
3. The monthly inflation data for the EAC countries are from 1995M05 to 2018M12, although three months for Rwanda, 1997M06-1997M08, are imputed due to missing CPI data for two months. Inflation data prior to 1995M05 are not used since Rwanda has a year of missing CPI data prior to that. The imputations for the missing Rwanda months are simply a straight average of the inflation rates for 1997M05 and 1997M09.
4. University of Groningen and University of California, Davis (Citation2019).
5. According to Newey and West (Citation1987), if the error terms are serially correlated, even the statistical inferences from the usual robust standard errors can still be misleading. Hence, we correct this issue by using the heteroscedasticity- and autocorrelation-consistent (HAC) estimators of the variance-covariance matrix of the coefficient estimates (VCE).
6. The transition period is three years before the partner states adopt the common monetary policy framework, and according to the current agenda, this is the period between 2018 and 2021.
7. The four periods are based on three historically relevant break points: 2000M07, when the new EAC between Kenya, Tanzania, and Uganda was established; 2009M07, when Burundi and Rwanda joined the EAC Customs Union (they joined the EAC two years earlier); and 2013M11, when the five EAC members agreed to create a monetary union within ten years.
8. These results contrast with the ADF and PP test results for these countries’ monthly inflation rates (without seasonal adjustment) presented in Carcel, Gil-Alaña, and Madigu (Citation2015), who, when using a shorter timespan of 2004M01 to 2013M12, could not reject the unit root for these countries (without seasonal adjustment). They also found evidence of structural breaks. One reason for the difference between their results and ours could be that our time series consists of month-to-month inflation rates, whereas they apparently used monthly year-over-year inflation rates.
9. For comparison to other studies that provide Pearson correlations for inflation rates among EAC countries we present such correlations also in Table S5 for four historical periods.
10. Nevertheless, even in the 2014M01-2018M12 period, Italy and Portugal show low correlations with the rest of the 2001 EMU members: −0.032 and −0.159, respectively, for the data without seasonal adjustment and 0.096 and 0.120, respectively, for the data with seasonal adjustment.
References
- AfDB [African Development Bank]. 2012. Inflation dynamics in selected East African countries: Ethiopia, Kenya, Tanzania and Uganda. AfDB Brief. https://www.afdb.org/fileadmin/uploads/afdb/Documents/Publications/07022012 (accessed June 15, 2019).
- Carcel, H., L. A. Gil-Alaña, and G. Madigu. 2015. Inflation convergence in the East African Community: A fractional integration and cointegration study. Global Economy Journal 15 (4):507–24. doi:https://doi.org/10.1515/gej-2015-0002.
- Clarida, R., J. Galí, and M. Gertler. 1999. The science of monetary policy: A new Keynesian perspective. Journal of Economic Literature XXXVII:1661–707. December. doi:https://doi.org/10.1257/jel.37.4.1661.
- Dridi, J., and A. D. Nguyen. 2019. Assessing inflation convergence in the East African community. Journal of International Development 31 (2):119–36. doi:https://doi.org/10.1002/jid.3396.
- Drummond, P., A. Aisen, E. Alper, E. Fuli, and S. Walker. 2015. Toward a monetary union in the East African Community: Asymmetric shocks, exchange rates, and risk-sharing mechanisms. African Departmental Series. Departmental Paper No 15/08, International Monetary Fund. Accessed July 27, 2021. https://www.imf.org/en/Publications/Departmental-Papers-Policy-Papers/Issues/2016/12/31/Toward-a-Monetary-Union-in-the-East-African-Community-Asymmetric-Shocks-Exchange-Rates-and-43066
- EAC. 2013. Protocol on the establishment of the East African Monetary Union. East African Community. Accessed July 27, 2021. https://www.eac.int/documents/category/key-documents
- EAC. 2018. The 22nd ordinary meeting of the Monetary Affairs Committee (MAC). Report of the Governors, EAC Secretariat, Arusha, Tanzania. August 24.
- Feenstra, R. C., R. Inklaar, and M. P. Timmer. 2015. The next generation of the Penn World Table. American Economic Review 105 (10):3150–82. doi:https://doi.org/10.1257/aer.20130954.
- Furceri, D., and G. Karras. 2008. Is the Middle East an optimum currency area? A comparison of costs and benefits. Open Economies Review 19 (4):479–91. doi:https://doi.org/10.1007/s11079-007-9046-4.
- Gianelle, C., L. Montinari, and S. Salotti. 2017. Interregional trade, specialization, and the business cycle: Policy implications for the EMU. Journal of Business Cycle Research 13 (1):1–27. doi:https://doi.org/10.1007/s41549-017-0012-y.
- Giannone, D., M. Lenza, and L. Reichlin. 2008. Business cycles in the euro area. Working paper No. 14529, National Bureau of Economic Research. Accessed July 27, 2021. https://www.nber.org/papers/w14529
- Henderson, R. 1916. Note on graduation by adjusted average. Transactions of the Actuarial Society of America 17:43–48.
- Hurtado, A., and J. U. Mora. 2018. Alternativas de integración monetaria para Mercosur (Alternatives of monetary integration for Mercosur). Economíaunam 15 (44):70–88.
- International Financial Statistics. 2019. Data tables, data by country, prices 1995–2018 for various countries [Data File]. Washington, D.C.: International Monetary Fund. https://data.imf.org/regular.aspx?key=61545849 (accessed June 24, 2019).
- Kalemli‐Ozcan, S., E. Papaioannou, and J. L. Peydro. 2013. Financial regulation, financial globalization, and the synchronization of economic activity. The Journal of Finance 68 (3):1179–228. doi:https://doi.org/10.1111/jofi.12025.
- Karras, G. 2002. Costs and benefits of dollarization: Evidence from North, Central, and South America. Journal of Economic Integration 17 (3):502–16. doi:https://doi.org/10.11130/jei.2002.17.3.502.
- Karras, G. 2003b. How homogenizing are monetary unions? Evidence from the U.S. states. North American Journal of Economics and Finance 14(3):381–97. December. doi:https://doi.org/10.1016/S1062-9408(03)00034-2.
- Karras, G. 2005. Is there a yen optimum currency area? Evidence from 18 Asian and Pacific economies. Japan and the World Economy 17(4):456–69. December. doi:https://doi.org/10.1016/j.japwor.2004.04.005.
- Karras, G. 2012. Optimal stabilization policy in a monetary union: Implications of the Mankiw-Weinzierl model. International Journal of Monetary Economics and Finance 5(2):139–52. June. doi:https://doi.org/10.1504/IJMEF.2012.048733.
- Karras, G. 2003a. The prospect of dollarization: Are the Americas an optimum currency area?”. In Aspects of globalisation: Macroeconomic and capital market linkages in the integrated world economy, ed. C. Tsoukis, G. M. Agiomirgianakis, and T. Biswas, 183–99. Boston/Dordrecht/London: Kluwer Academic Publishers.
- Kendall, M. G. 1938. A new measure of rank correlation. Biometrika 30 (1–2):81–93. doi:https://doi.org/10.1093/biomet/30.1-2.81.
- Kendall, M. G. 1945. The treatment of ties in ranking problems. Biometrika 33 (3):239–51. doi:https://doi.org/10.1093/biomet/33.3.239.
- Kenen, P. B. 1969. The optimum currency area: An eclectic view. In Monetary problems of the international economy, ed. R. A. Mundell and A. K. Swoboda, 41–60. Chicago: University of Chicago Press.
- Kishor, N., and J. Ssozi. 2010. Inflation convergence and currency unions: The case of the East African community. Indian Growth and Development Review 3 (1):36–52. doi:https://doi.org/10.1108/17538251011035864.
- Maravall, A. 1995. Unobserved components in economic time series. In Handbook of applied econometrics, Vol 1. macroeconomics, ed. M. H. Pesaran and M. Wickens, 12–72. Oxford: Blackwell.
- McKinnon, R. I. 1963. Optimum currency areas. The American Economic Review 53 (4):717–25.
- Mora, J. U., A. J. Hurtado, and S. Zerpa de Hurtado. 2020. Reactivating the dynamism of Mercosur: A monetary approach. Applied Econometrics and International Development 20 (1):81–96.
- Mora, J. U. 2006. ¿Dolarización individual o moneda común? evidencia para los países suramericanos. Revista Aportes para la Integración latinoamericana XII (14):88–106.
- Mundell, R. A. 1961. A theory of optimum currency areas. The American Economic Review 51 (4):657–65.
- Narayan, P. K., and R. Liu. 2015. A unit root model for trending time-series energy variables. Energy Economics 50:391–402. doi:https://doi.org/10.1016/j.eneco.2014.11.021.
- Narayan, P. K., and S. Popp. 2010. A new unit root test with two structural breaks in level and slope at unknown time. Journal of Applied Statistics 37 (9):1425–38. doi:https://doi.org/10.1080/02664760903039883.
- Newey, W. K., and K. D. West. 1987. A simple, positive semi-definite, heteroskedasticity and autocorrelation consistent covariance matrix. Econometrica 55 (3):703–08. doi:https://doi.org/10.2307/1913610.
- Nyirakanani, R. 2018. Is EAC an optimum currency area? BNR Economic Review 12:61–126.
- United Nations, Department of Economic and Social Affairs, Statistics Division. 2019. 2018 International trade statistics yearbook, volume I: Trade by country. https://comtrade.un.org/pb/downloads/2018/VolI2018.pdf (accessed July 10, 2020).
- University of Groningen and University of California, Davis. 2019. Output-side real GDP at chained purchasing power parities, for various countries. Federal Reserve Bank of St. Louis, https://fred.stlouisfed.org/ (accessed November 13, 2019).
- World Bank. 2019. World development indicators. Accessed March 26, 2019. https://databank.worldbank.org/source/world-development-indicators#.
- Wright, J. H. 2013. Unseasonal seasonals? (Including comments and discussion). Brookings Papers on Economic Activity 65–126. Fall. doi:https://doi.org/10.1353/eca.2013.0017.