
 ?Mathematical formulae have been encoded as MathML and are displayed in this HTML version using MathJax in order to improve their display. Uncheck the box to turn MathJax off. This feature requires Javascript. Click on a formula to zoom.
ABSTRACT
This study proposes a two-stage modeling framework to evaluate the efficiency of firm performance based on sustainability (environmental, social, and governance (ESG)), operational and financial measures. Diverging from previous studies, this study conceptualizes firm performance as two serially linked stages, with operational performance as the first stage and market performance as the second stage. Acknowledging that ESG activities may reflect firm value and that these activities depend on a firm’s operational performance, ESG scores are modeled simultaneously as an output of the operational performance stage and as an input for the market stage. Under this performance appraisal framework, two-stage data envelopment analysis models capturing overall and stage-level efficiency are constructed. The application of the proposed modeling framework is demonstrated using a sample of large Saudi listed firms as a case study of an emerging market. The main conclusion is that ESG legislation, regulations, and disclosure guidelines should be well defined in emerging markets to increase the overall efficiency of listed firms’ performance.
1. Introduction
Traditionally, firm performance has been assessed using operational and financial measures. However, there is strong evidence that firm performance is associated with other factors, such as environmental, social, and governance (ESG) activities. ESG activities enhance firms’ financial stability, market value, and efficiency (Chouaibi, Chouaibi, and Rossi Citation2021; Feng and Wu Citation2021; Wong et al. Citation2021). ESG activities may create value by increasing shareholder wealth (increasing cash flow or decreasing the discount rate) or maximizing shareholder utility (Gillan, Koch, and Starks Citation2021). ESG activities also facilitate investment decision-making by providing a source of non-financial information that helps investors evaluate the risks and opportunities associated with potential investments (Broadstock et al. Citation2021; Lööf, Sahamkhadam, and Stephan Citation2022). Thus, a modeling framework that comprehensively integrates multidimensional measures of performance, including sustainability, operational and financial measures, is necessary for both firms’ executives (to improve firm efficiency) and firms’ investors (to guide them to incorporate sustainability factors into their asset allocation). The question that we address in this study is how to integrate sustainability, operational and financial performance measures to develop a comprehensive measure of firm performance.
Studies have shown that efficiency is a key element of firm performance (e.g., Cooper et al. Citation2007; Henriques et al. Citation2020) and that it is enhanced by ESG activities (Chang et al. Citation2023; Iazzolino et al. Citation2023; Xie et al. Citation2019). Various studies have investigated the transformation of inputs into outputs (i.e., firm efficiency) using data envelopment analysis (DEA). DEA is widely used to measure organizational efficiency; it involves multiple input and output variables and linear programming techniques (Cook, Tone, and Zhu Citation2014; Wu, Yang, and Liang Citation2006). It provides a holistic approach to measuring firm performance by integrating different productivity measures (e.g., market‐based metrics and accounting‐based metrics) into a single model and providing a performance index (Xie et al. Citation2019; Zhang et al. Citation2021). In addition, it identifies best practice thresholds and supports policymakers’ decision-making (Cook, Tone, and Zhu Citation2014).
Existing studies on firm performance mainly measure firm efficiency by 1) conducting one-stage DEA with ESG scores (Iazzolino et al. Citation2023; Stefanoni and Voltes-Dorta Citation2021), 2) using external two-stage DEA models where the first stage involves DEA with multiple financial and operational inputs and outputs; and the second stage involves nonparametric regression analysis with ESG scores (Chang et al. Citation2023; Xie et al. Citation2019), and 3) using internal two-stage DEA models that divide the process into subprocesses in which the outputs of the first stage may become the inputs of the second stage (C. Huang Citation2021; Kuo et al. Citation2022; Lu et al. Citation2021; Zhang et al. Citation2021). On this basis, according to best of our knowledge, there is no study concerning on establishing links between ESG scores and other vital aspects of firm efficiency and at the same time consider the interaction effects of the variables.
As noted by Xie et al. (Citation2019), Chang et al. (Citation2023) and Iazzolino et al. (Citation2023), a multiple input – output model using ESG measures (among several other measures) is required to assess firm performance and develop a ratio-based measure of efficiency. However, we differ from Xie et al. (Citation2019), Chang et al. (Citation2023) and Iazzolino et al. (Citation2023) in that we see efficiency not as a single-stage DEA model but as a simultaneously networked process with two stages linked via intermediate variables. We argue that firm value may be conditional on ESG activities, and that these activities are determined by the firm’s operational performance. Thus, ESG activities should be treated as an intermediate variable. Accordingly, we address the much debated questions of whether and how management choices with regard to ESG affect firm performance and firm value and whether and how firm performance drives ESG choices (Gillan, Koch, and Starks Citation2021).
We conceptualize firm performance as two serially linked stages, with operational performance as the first stage and market performance as the second stage. The first stage, operational performance, denotes a firm’s ability to generate revenue (Mohtashami and Ghiasvand Citation2020; Stefanoni and Voltes-Dorta Citation2021; Zhang et al. Citation2021), which contributes to its ESG performance (Stefanoni and Voltes-Dorta Citation2021). The second stage, market performance, represents firm value according to the stock market (C. Huang Citation2021; Wang, Li, and Sueyoshi Citation2014). Thus, revenue and ESG are modeled simultaneously as outputs of the operational stage and inputs of the market stage. Instead of considering the two stages as independent, we treat them as a holistic process. Hence, our model of firm performance comprehensively considers operational, financial, and sustainability variables. Our modeling framework represents a novel contribution to the firm performance literature.
Our proposed framework for assessing the relative efficiency of firm performance involves a two-stage DEA process developed by Despotis, Sotiros, and Koronakos (Citation2016), which measures two stages simultaneously: operational performance and market performance. Conceptualizing firm performance as a multi-stage process helps researchers to assess not only overall firm performance but also stage-level performance. We incorporate operational, financial, and sustainability variables into our modeling framework. To demonstrate the application of our framework, we use a sample of Saudi listed firms as a case study. The first stage produces outputs that are simultaneously considered as inputs for the second stage. In addition, several different scenarios for the two-stage DEA modeling framework are considered by changing or omitting the sustainability variables (i.e., overall ESG and environmental (E), social (S), and governance (G) factors, respectively) to understand the roles of these variables in overall firm performance.
This article provides the several contributions to the literature. First, to the best of our knowledge, this is one of the first attempts to measure the relative efficiency of firms’ performance using a two-stage DEA model that combines operational and financial measures with sustainability measures. Thus, it enriches the literature on the causal relationship between ESG performance and firm performance from the perspectives of inputs, intermediaries, and outputs (Chang et al. Citation2023; Iazzolino et al. Citation2023; Xie et al. Citation2019). Instead of focusing on ESG measures alone to assess the impact of ESG on firm performance, we examine the roles of individual sustainability variables in the production process. Second, the research paper adds to prior studies by evaluating the impact of sustainability on firm performance in multiple dimensions. We explore the effects of a total ESG measure, three individual ESG factors (E, S, and G), and average efficiency on firm operational and market efficiency. Hence, our assessment of the role of ESG activities in firm efficiency captures the diversity of such activities. Third, the study’s empirical findings provide novel insights for policymakers, firms’ decision makers, and investors. The proposed framework provides a useful tool for performance evaluation and benchmarking by firm executives and managers, enabling them to assess firm performance both overall and in two dimensions, namely operational and market performance. The tool will provide executives and managers with information on how they are performing relative to their peers in several domains. It will also help investors to identify efficient and inefficient firms by defining a threshold for efficiency, ultimately enabling them to build efficient and sustainable investment portfolios. By shedding light on how the efficiency of firms differs depending on their ESG performance, our tool will help both decision makers and investors in firms to gain sustainable and responsible investment knowledge. For instance, it provides insights into the maturity level necessary to assess sustainability norms, regulations, and practices (Rahi, Akter, and Johansson Citation2021). Fourth, the proposed framework can be applied to firms in different sectors, as well as different countries and regions.
The remainder of this study is organized as follows. Section 2 provides a literature review. Section 3 describes the empirical methodology. Section 5 demonstrates the application of the proposed framework and discusses the results. Section 6 concludes the research and proposes future extensions.
2. Literature Review
This section has two purposes. First, it reviews the literature on the relationship between sustainability and firm performance (subsection 2.1). Second, it discusses studies that have applied DEA to estimate firm efficiency (subsection 2.2).
2.1. Firm Performance
Studies have identified numerous factors that affect firm performance, including financial, operational, and sustainability factors. As the goal of this article is to develop a comprehensive measure of firm performance, in this subsection, we review the literature on the relationship between sustainability (i.e., ESG measures) and firm performance. In subsection 2.2, we review studies evaluating the influence of financial, operational, and sustainability perspectives on firm performance using DEA.
A rapidly emerging strand of the literature has suggested that ESG characteristics determine firm performance and has investigated the relationship between ESG activities and firm performance (for a review see Gillan, Koch, and Starks Citation2021; D. Z. Huang Citation2021). However, findings regarding the impact of ESG measures on firm performance are inconsistent. Friede, Busch, and Bassen (Citation2015) reviewed approximately 2,000 papers and found that the majority of the reviewed articles reported that higher ESG performance led to better firm performance. Fatemi, Glaum, and Kaiser (Citation2018), Alareeni and Hamdan (Citation2020) and Bruna et al. (Citation2022) reported that an increase in ESG or corporate social responsibility (CSR) performance enhanced firm performance. However, other studies have documented a negative impact of ESG performance on firm performance (Lahouel et al. Citation2021; Rahi, Akter, and Johansson Citation2021). Meanwhile, Azmi et al. (Citation2021) and Atan et al. (Citation2018) found no relationship between ESG measures and firm performance. These contradictory findings may have arisen because management decisions with regard to firm responsibility (such as ESG activities) are not immediately reflected in firm performance.
Another stream of literature has focused on investigating the impact of single ESG measures on firm performance. For example, Hsieh, Lee, and Shen (Citation2023), Kasbar et al. (Citation2023), Din et al. (Citation2021), Rahi, Akter, and Johansson (Citation2021) and Siddiqui, YuSheng, and Tajeddini (Citation2023) investigated the relationships between corporate governance factors (e.g., ownership structure and the attributes of the board of directors) and firm performance. They documented that in general, ownership concentration, institutional ownership, and corporate governance quality promoted firm performance. Regarding environmental impact, Lee, Yahya, and Razzaq (Citation2022) found a positive relationship between environmental performance and stock prices for renewable energy stocks in China. Cek and Eyupoglu (Citation2020) investigated the relationship between the ESG performance and economic performance of S&P 500 companies. In all of their regression models, social and governance performance significantly affected economic performance, but environmental performance had no statistically significant effect.
Contradictory results have also been reported by studies examining the influence of ESG and its three individual components on firm performance. For instance, Alareeni and Hamdan (Citation2020) and Lu et al. (Citation2023) found that although ESG initiatives improved firm performance overall, the effects of individual ESG factors differed. Specifically, Alareeni and Hamdan (Citation2020) found that environmental disclosure and social disclosure were negatively associated with firms’ financial and operational performance, but environmental disclosure was positively related to firms’ market performance. Alareeni and Hamdan (Citation2020) also found that individual governance disclosure was positively related to firms’ market performance and negatively related to firms’ financial performance. Lu et al. (Citation2023) investigated the impact of ESG ratings and the three individual ESG elements on the eco-efficiency and profitability efficiency of Apple Incorporated’s value-chain counterparts. They found that environmental and social ratings significantly and positively affected firm efficiency, but there was no significant correlation between governance and efficiency.
Many of the above studies used regression analysis to estimate the relationship between firm sustainability and firm performance. However, another stream of literature has moved beyond regression analysis to use the DEA method to determine firms’ production efficiency. DEA overcomes the single metric problem and provides a holistic approach to measuring firm performance by considering multiple productivity measures, such as financial and operational metrics (Xie et al. Citation2019). In the following subsection, we review research that has adopted the DEA approach to assess firm performance. We also show how this approach yields rich insights into firm performance.
2.2. DEA-Based Studies of Firm Performance
Research on firm performance has conceptualized firm efficiency using DEA techniques. In this section, we discuss studies of firm performance that have used one-stage and/or two-stage DEA models (either external or internal). For two-stage DEA models, we adopt the categorization proposed by Henriques et al. (Citation2020), namely external vs. internal. The former models consider the first stage as a production process (i.e., applying conventional DEA), followed by a second stage outside the production process (e.g., a type of regression, an analytical hierarchy process, or an artificial neural network). The latter models divide the firm process into subprocesses in which the outputs of the first stage (called intermediate) may become the inputs of the second stage, bringing the analysis closer to reality (Henriques et al. Citation2020). summarizes the characteristics of these studies, elucidating each study’s main purpose, sample analyzed, and DEA approach type and whether the analysis included ESG or other data.
Table 1. Latest DEA-based research on the efficiency of firms’ performance.
Most studies have applied conventional one-stage DEA models by analyzing financial data along with nonfinancial data. Mohammadian and Rezaee (Citation2020), Mohtashami and Ghiasvand (Citation2020), and Ebrahimi and Hajizadeh (Citation2021) measured the efficiency of stock exchange companies using one-stage DEA models that considered financial variables. In their proposed models, the input financial variables were liquidity, leverage, and asset utilization, while the output financial variables were profitability and growth. Incorporating financial and nonfinancial variables, Hou, Lu, and Hung (Citation2019) and Quan et al. (Citation2022) conducted one-stage DEA that investigated listed firms’ performance from an efficiency perspective using both financial data and other social data. Two studies based on one-stage DEA used ESG measures as the output. Stefanoni and Voltes-Dorta (Citation2021) evaluated firm efficiency using finished goods, total revenue, total assets, and employees as inputs and ESG scores as outputs in a one-stage DEA model. Iazzolino et al. (Citation2023) measured financial and market efficiency by employing a one-stage DEA model with two inputs, namely total assets and total equity, and three outputs, namely earnings before interest tax depreciation amortization (EBITDA), revenue, and ESG activities.
Turning to external two-stage DEA models, some studies have conducted one-stage DEA with financial and operational variables along with regression analyses that include ESG data. For example, Xie et al. (Citation2019) applied one-stage DEA to estimate corporate efficiency, using fixed assets, number of employees, and cost of capital goods sold as inputs and revenue as output. They also investigated the nonlinear relationship between corporate efficiency and ESG disclosure by conducting nonparametric regression analysis. Chang et al. (Citation2023) utilized one-stage DEA along with panel data regression analysis to explore the interaction effects of digital finance and ESG performance on corporate financing efficiency in a stock market. For their financial data, they used input indicators such as the total liability-to-asset ratio, total asset value, total liability, and ownership interest, and their output indicators were returns on net assets (ROA), main business revenue, corporate growth ratio, and liquid asset turnover ratio. Regarding nonfinancial data, Chang et al. (Citation2023) investigated ESG information disclosure using generalized method of moments with fixed-effects panel data analysis. Similarly, Bruna et al. (Citation2022) carried out one-stage DEA to measure firm performance, with the firm’s leverage ratio and operating expense ratio as inputs and the EBITDA to interest coverage ratio, total turnover ratio, and ROA as outputs. The authors also investigated the impact of ESG on firm performance through fixed-effects panel regression analysis.
Lahouel et al. (Citation2022) adopted one-stage DEA to calculate the Green Total Factor Productivity Index (GTFPI), representing firm environmental performance. They used capital stock, energy consumption, gross capital formation, and labor as inputs to generate gross domestic product (GDP), and they used CO2 emissions as the output. They also incorporated a panel smooth transition regression model to examine the relationship between environmental performance and economic development. In another study, Lahouel et al. (Citation2021) utilized three regression models to investigate the relationship between corporate social performance, measured by one-stage DEA (without an explicit input), and firm market performance. Later, Lahouel et al. (Citation2022) carried out one-stage DEA to estimate the financial stability of European banks. They ran a nonlinear panel smooth transition regression to investigate the impact of liquidity risk on bank stability. Puertas et al. (Citation2022) conducted one-stage DEA to estimate the efficiency of investments in research and development (R&D) by the most innovative European companies. Subsequently, they ran a multilevel regression to analyze the impact of environmental policies and efficiency of innovation, determined using DEA, on market capitalization. However, none of the above-mentioned studies incorporated ESG data into their one-stage DEA models.
Turning to internal two-stage DEA models, some studies have conducted two-stage DEA to evaluate firm performance, using financial and operational data as inputs and outputs, as well as a set of intermediate measures between the two stages (C. Huang Citation2021; Kuo et al. Citation2022; Lu et al. Citation2021, Citation2023; Zhang et al. Citation2021). Lu et al. (Citation2021) proposed two stages (a production stage and a market stage) to measure the operational efficiency of listed companies. The input variables included fixed assets, number of employees, and research and development expenses; the sole intermediate measure was non-operating revenue; and the outputs included market value and earnings per share (EPS). C. Huang (Citation2021) conducted two-stage DEA to calculate firm efficiency in terms of profitability and marketability. He used fixed assets, operating expenses, and number of employees as the input variables; revenue and product inventory as intermediate variables linking the two stages; and EPS and market value as the output variables. Zhang et al. (Citation2021) conducted two-stage DEA based on both operational and stock market indicators to evaluate firm performance.
Lu et al. (Citation2023) conducted two-stage DEA to estimate the eco-efficiency (stage 1) and profitability efficiency (stage 2) of Apple Incorporated’s value-chain counterparts. For the first stage, the input variables comprised operating expenses, energy use, property, plant and equipment, and employees, while the outputs were CO2 emissions and sales. The second stage took sales as the input and net income and market value as the outputs. Hence, sales were considered as an intermediate variable in the two-stage DEA model. Lahouel et al. (Citation2022) conceptualized banking production as a process involving three stages. They calculated bank stability using three-stage dynamic network DEA, taking labor, physical capital, and equity as inputs for the first stage; deposits as the intermediate variable for the second stage; and loans and securities as outputs for the third stage.
Three important themes emerge from the studies discussed so far. First, while recent studies have measured firm efficiency by conducting one-stage DEA with ESG scores (Iazzolino et al. Citation2023; Stefanoni and Voltes-Dorta Citation2021), they have made little effort to establish links between ESG scores and other vital aspects of firm efficiency. Second, studies using external two-stage DEA models have measured firm performance in two stages: the first stage involves DEA with multiple financial and operational inputs and outputs; and the second stage involves nonparametric regression analysis with ESG scores (Chang et al. Citation2023; Xie et al. Citation2019). However, these studies have rarely considered the potential interaction effects of the variables in the second stage. Moreover, they have not conceptualized firm performance in terms of subprocesses such as operations and marketability. Third, research using internal two-stage DEA models to examine firm performance has been conducted with financial and operational measures only (C. Huang Citation2021; Kuo et al. Citation2022; Lu et al. Citation2021; Zhang et al. Citation2021). Additionally, researchers have not incorporated ESG scores into their internal two-stage DEA models. Therefore, there is a paucity of research on the efficiency of firms’ performance in two dimensions (operational and market performance) and how firm performance relates to ESG performance. To fill this gap, the present study proposes a comprehensive method of analysis, namely internal two-stage DEA including sustainability, operational, and financial variables. The results shed light on whether and how sustainability performance (overall ESG and individual ESG factors), measured in terms of efficiency, is a determinant of firm performance. For simplicity, we refer to “internal two-stage DEA” as “two-stage DEA” hereafter.
3. Methodology
3.1. Underlying Principles of DEA
DEA is a non-parametric, data-driven analytical method based on relative efficiency frontier theory (Charnes, Cooper, and Rhodes Citation1979). The first such model was the CCR model, named after its developers Charnes, Cooper, and Rhodes (Citation1979), which became a standard measure of performance under the assumptions of the constant return to scale structure. To consider variable return to scale, a new model, the BCC model, was introduced by Banker, Charnes, and Cooper (Citation1984). CCR constant returns to scale models are more restrictive than BCC variable returns to scale models, because fixed returns to scale models include fewer efficiency units and the modeled efficiency is lower (Mohtashami and Ghiasvand Citation2020). For more detailed discussion of the CCR and BCC models and some of their extensions, refer to Cooper et al. (Citation2007) and Cooper, Seiford, and Zhu (Citation2011).
DEA plays an increasingly important role in research measuring the efficiency and performance of multiple peer units, which are called decision-making units (DMUs). It is used to estimate the relative efficiency of multiple inputs and outputs. DEA is rooted in microeconomic theories of firm behavior, which describe the input – output relationship (Charnes et al. Citation1997). DEA is a vital decision-making tool with a huge number of real-world applications (Emrouznejad and G-L Citation2018; Hou, Lu, and Hung Citation2019; Quan et al. Citation2022). DEA is conducted by measuring the efficiency of each DMU, referred to as the performance level, relative to that of the remaining others (Wang, Li, and Sueyoshi Citation2014) and identifying several best performing DMUs. All of the DMUs are ranked to determine whether each DMU is effective (relative efficiency ) or not (relative efficiency
). If not, the reasons why not, directions for improvement and the degree of improvement required are identified (Quan et al. Citation2022). In sum, DEA is a data analytics tool that provides performance benchmarking for DMUs (Zhang et al. Citation2021).
However, conventional DEA is a one-stage process that fails to consider the internal structure of DMUs (Despotis, Sotiros, and Koronakos Citation2016). Thus, our proposed DEA approach is a two-stage process, whose basic structure indicates the flow of intermediate measures between the stages and plays a major role in evaluating efficiency (Chen et al. Citation2009; Despotis, Sotiros, and Koronakos Citation2016; Kao and Hwang Citation2011). The two-stage DEA method has been used in diverse fields, such as banking, energy, insurance, medical manufacturing, and the airline industry (Almulhim Citation2019; C. Huang Citation2021; Jebali, Essid, and Khraief Citation2017; Wanke and Barros Citation2014; Zhang et al. Citation2021).
3.2. Method
This section presents the research method used to develop the proposed modeling framework to evaluate the efficiency of firm performance from operational, financial, and sustainability perspectives. The proposed framework and the algorithmic steps are introduced. The proposed framework consists of three phases, as depicted in .
Figure 1. Simplified conceptual framework of the research methodology.
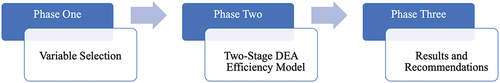
3.2.1. Phase One: Variable Selection
In this phase, selected variables are classified as input, intermediate, and output variables for use in the two-stage DEA model. The selected variables are defined based on recent research on firm performance.
Financial, operational, and sustainability variables are used to construct the proposed two-stage DEA efficiency model. Three financial variables are adopted as input variables from previous studies (Bai-Chen, Ying, and Qian-Qian Citation2012; Hou, Lu, and Hung Citation2019; C. Huang Citation2021; Stefanoni and Voltes-Dorta Citation2021; Xie et al. Citation2019; Zhang et al. Citation2021). We use total assets as the material input, measuring the capital of the firm (Stefanoni and Voltes-Dorta Citation2021). As an operational variable, we take the total number of employees, a widely used measure, as the human resource input (Stefanoni and Voltes-Dorta Citation2021; Zhang et al. Citation2021). The third input is operating expenses, referring to expenditure on business operations, such as materials, equipment, and maintenance (Hou, Lu, and Hung Citation2019; C. Huang Citation2021; Maritz and Shieh Citation2013). Revenue is a major objective criterion for firm performance (Lim, Oh, and Zhu Citation2014); in the literature, it has been considered an output of firm performance in the operating stage (Mohtashami and Ghiasvand Citation2020; Stefanoni and Voltes-Dorta Citation2021; Zhang et al. Citation2021). Accordingly, we consider revenue as an output in the model. Moving to sustainability variables, Stefanoni and Voltes-Dorta (Citation2021) used ESG scores as an output of the operating stage. According to Refinitiv (Citation2023), ESG scores measure a company’s relative ESG performance, commitment, and effectiveness in 10 main dimensions, including emissions, environmental product innovation, human rights, and shareholders. It is calculated as the arithmetic mean of the score for each of the three individual components of ESG. Thus, we also incorporate revenue and ESG scores as the intermediate variables linking the two stages. These two intermediate variables are the output of the operational stage and then the input of the market stage.
Studies have used market value (C. Huang Citation2021; Wang, Li, and Sueyoshi Citation2014) and ROE (Ebrahimi and Hajizadeh Citation2021; Mohtashami and Ghiasvand Citation2020; Zhang et al. Citation2021) as final outputs for the market stage. The market value variable represents future investor expectations and the firm’s competitive capacity (Wang, Li, and Sueyoshi Citation2014). ROE is the amount of net income returned as a percentage of shareholders’ equity (Zhang et al. Citation2021). It reflects profitability, measured as the profits that the company has made from the money invested by shareholders (Mohtashami and Ghiasvand Citation2020; Zhang et al. Citation2021). Therefore, the output variables of the second stage (i.e., the market stage) in this analysis are market value and ROE.
3.2.2. Phase Two: Structure of Efficiency Models
A structure that links different stages of DEA models with inputs, intermediates, and outputs in a series of activity processes was introduced by Färe (Citation1991) and further developed by several scholars (Chen and Zhu Citation2019; Chen et al. Citation2009; Despotis, Sotiros, and Koronakos Citation2016; Kao Citation2012; Kao and Hwang Citation2009, Citation2011; Lozano Citation2011). The stages in these models are not independent; they are connected by the first stage’s intermediates, which are the output of the first stage and become an input in the second stage. Two-stage DEA models can tackle possible conflict between the two stages arising from the use of intermediate measures (Despotis, Sotiros, and Koronakos Citation2016; Kao and Hwang Citation2011; Liang, Cook, and Zhu Citation2008).
This study constructs efficiency models based on a two-stage DEA method following the composition approach introduced by Despotis, Sotiros, and Koronakos (Citation2016). The first stage is the firm’s operational performance, which measures operational efficiency by considering ESG scores as outputs. The second stage is market performance, which uses the operational stage’s outputs to obtain market value. We assume that there are listed firms, denoted by
(
). Each
has
inputs and
(
) intermediate outputs from the first stage. Next,
intermediate outputs from stage 1 feed into the second stage as the second stage’s inputs. Finally, the second stage has another
(
) as its final output. illustrates the framework of the two-stage DEA approach for
.
Figure 2. Framework of two-stage DEA efficiency model for .
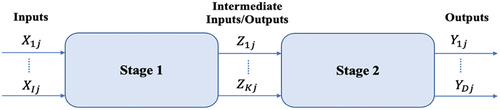
We use an output-oriented DEA model. Given a certain value of inputs, the model seeks to maximize the final output. Performance is assessed by focusing on output growth. This will enable decision makers (i.e., managers) in inefficient firms to determine how much improvement in outputs is required to improve the firms’ overall efficiency.
Following Despotis, Sotiros, and Koronakos (Citation2016), the efficiency of the first and second stages of is denoted as
and
, respectively, and the overall efficiency of
is expressed as
. In the independent stage for
,
is the independent efficiency score for the first stage and
is the independent efficiency score for the second stage (Despotis, Sotiros, and Koronakos Citation2016). For unit
, Despotis, Sotiros, and Koronakos (Citation2016) proposed the following linear model:
where is the vector of weights for the stage-1 inputs in the linear model;
is the vector of weights for the stage-2 outputs in the linear model;
is the vector of weights for the intermediate measures in the linear model; and
is a non-Archimedean constant (for more details see Amin, Toloo, and Sohrabi (Citation2006)).
and
denote estimates of the optimal independent efficiency scores, obtained using multi-objective programming (MOP). For full details of the calculation process, see Despotis, Sotiros, and Koronakos (Citation2016) and Li et al. (Citation2018). Finally,
is the optimal solution to model (1), then
.
Another method of computing overall efficiency of a serially linked two-stage process is the product of the individual stage-level efficiencies (Kao and Hwang Citation2009). This method proposed by Kao and Hwang (Citation2009) which takes a multiplicative decomposition approach. The multiplicative decomposition model assumes that the overall efficiency is the product of individual efficiencies of the two stages: . The model below estimates the stage efficiencies by optimizing the overall efficiency:
Unlike the multiplicative efficiency decomposition approach (Kao and Hwang Citation2009), the composition approach (Despotis, Sotiros, and Koronakos Citation2016) generates unique and unbiased efficiency scores.
3.2.3. Phase Three: Results and Recommendations
The overall efficiency scores for are computed based on the computational processes from the previous phase, using MATLAB software. Next, a ranking list is proposed, leading to recommendations for policymakers, decision makers at the management level, and investors. However, as three different production frontiers (stage 1, stage 2, and overall efficiency) are involved, it may be challenging to compare the results. The ranking list for
can be used as a benchmark and guide to improve the performance of other DMUs.
4. Empirical Demonstration
We present a case study to test our proposed modeling framework using a sample of firms listed on the Saudi Stock Exchange that make ESG information disclosures. Saudi firms are chosen as our sample for several reasons. First, the Saudi market is one of the biggest markets in the Middle East and North Africa region and offers unique investment opportunities. Second, the Saudi government has established (Saudi Vision Citation2022), an ambitious plan to diversify the country’s economy away from its reliance on oil. Sustainable development is a major strategic framework under Vision 2030. Third, in line with the national vision, ESG ratings and disclosure are gaining increasing attention from participants in the Saudi market. The Saudi Stock Exchange has gradually incorporated ESG ratings since 2018 and has partnered with the Sustainable Stock ExchangeFootnote1 (SSE) initiative. Adopting principles of sustainability and incorporating ESG into strategic decisions can help firms attract new capital and border stakeholders who wish to make ESG-related investments (Vinodkumar and Alarifi Citation2020). However, the disclosure of ESG performance is still voluntary in Saudi Arabia (Saudi Exchange Citation2022a). Finally, the literature concerning firm market value in relation to ESG has generally neglected Saudi’s developing market. Thus, research on the Saudi market is still emerging.
In this section, we apply the proposed modeling framework to measure the performance of listed firms in the Saudi stock market, simultaneously considering operational performance and market performance by linking sustainability (i.e., ESG), operational, and financial variables.
4.1. Phase One: Dataset and Variable Selection
As discussed above, ESG disclosure is voluntary under the current regulations of the Saudi Stock Exchange, which introduced voluntary ESG disclosure in 2018. A sample of 24 listed firms in the Tadawul All Share Index is selected based on their high market capitalization, providing panel data for 3 years (2019–2021). The data are drawn from the Refinitiv database. shows the 24 largest listed firms, coded as DMUs: .
Table 2. Top 24 Saudi listed firms (DMUs).
The efficiency model comprises two stages: an operational stage and a market stage. Three variables , namely total assets (
), number of employees (
), and operating expenses (
), are taken as inputs for the operational stage. Two intermediate variables
, namely revenue (
) and ESG scores (
), are taken as the output of the operational stage and then fed into the market stage as inputs. Two output variables (
), namely market value (
) and return on equity (ROE) (
), are considered as outputs of the market stage. The sample of 24 listed firms conforms to Cooper’s rule, namely the rule of thumb (Cooper, Seiford, and Zhu Citation2011) that the minimum sample size threshold
is relative to the number of inputs
and outputs
, where
.
provides descriptive statistics for the input, intermediate, and output variables for the 3 years under study (2019–2021).
Table 3. Descriptive statistics of the variables (source: Refinitiv workspace for datastream).
4.2. Phase 2: Structuring Efficiency Models
First, three models are constructed to measure overall and stage-level performance for each year from 2019 to 2021. Analyses of three models are provided in subsection 5.3.1. In this subsection, we apply three inputs (i.e., total assets, number of employees, and operating expenses), two intermediate (i.e., revenue and ESG scores), and two outputs (i.e., market value and ROE) over the sample years. Theses analyses followed by robustness analysis including comparison analysis and sensitivity analysis. We conducted a comparison analysis to check the accuracy of the obtained results. This is done by applying two models, Model (A) proposed by Despotis, Sotiros, and Koronakos (Citation2016) and Model (B) proposed by Kao and Hwang (Citation2009) across the 2019–2021 period. Both models are presented in subsection 4.2. Afterward, we conduct sensitivity analysis using various two-stage DEA models. We construct five scenarios between 2019 and 2021 by retaining or moving relevant variables (overall ESG scores and three individual ESG components (E, S, and G)). More details are given in subsection 5.3.2. All the analyses in this article only focus on the separate time period independently. Thus, this study uses 3-year data independently from 2019 to 2021.
4.3. Phase 3: Results and Discussion
In this phase, analyses of the structure of the two main types of efficiency models are conducted for each year of the selected sample, applying linear model (1). The computational processes are conducted using MATLAB software.
4.3.1. Analysis for Overall and Stage-Level Performance
shows the overall efficiency scores across the 24 focal firms between 2019 and 2021. D-09 is the most efficient, while D-24 and D-07 are the most inefficient. provides more insights into the obtained results for each year from 2019 to 2021. It presents the efficiency scores for stage 1 and stage 2 and the overall efficiency scores and their rankings for individual DMUs. The overall rankings in are constructed according to the scores for overall performance for each DMU. In terms of overall performance, there are three efficient DMUs (i.e., D-09, D-18, and D-01). In 2019 and 2020, D-09, D-18, and D-01 ranked first, second, and third, respectively. In 2021, the first, second, and third spots were taken by D-09, D-01, and D-18. These firms have relatively high efficiency levels and may offer a performance efficiency benchmark that can be used as a guide to improve the performance of other firms.
Figure 3. Overall efficiency of 24 listed firms in Saudi Stock Exchange (2019–2021).
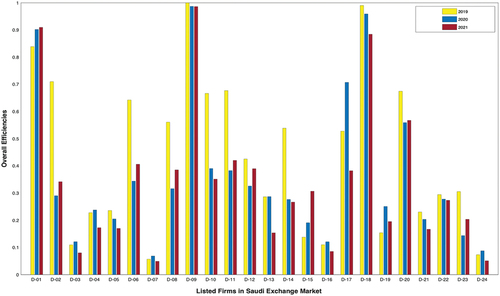
Table 4. Efficiency scores and their ranking for 24 listed firms in the Saudi Stock Exchange for each year from 2019 to 2021.
The average efficiency for each stage and the overall efficiency for each year from 2019 to 2021 are shown in . Fluctuations can be seen in the DMUs’ average efficiency across the three sampled years. The DMUs’ average overall efficiency and average market efficiency are, respectively, 0.4363 and 0.4920 in 2019, 0.3596 and 0.4533 in 2020, and 0.3414 and 0.4220 in 2021. The overall efficiency of most of the DMUs is relatively low and tends to decrease over the 2019 to 2021 period. These fluctuations could be due to stock market volatility, which played a significant role in the short and middle horizons during the COVID-19 pandemic, as demonstrated by Tissaoui et al. (Citation2021). This finding is consistent with that of Makni (Citation2023), who indicated that COVID-19 significantly impaired firms’ performance, and Tetteh et al. (Citation2022), who concluded that the outbreak of the pandemic had a statistically significant negative effect on two emerging stock markets (i.e., Ghana and Botswana).
Regarding the differences between the two stages, we find that the 24 listed firms perform better in the first stage (i.e., operational performance) than in the second stage (i.e., market performance). The market value mechanisms for all 24 DMUs are less efficient than they could be, indicating potential for significant improvement. This may be because Saudi listed firms did not manage their revenue and sustainability activities efficiently during the focal period. These results are consistent with those of Vinodkumar and Alarifi (Citation2020), who indicated that most Saudi stocks have a low market value, given that they are still categorized as overpriced. This may also explain why legislation on sustainability reporting was recently introduced in Saudi Arabia (Vinodkumar and Alarifi Citation2020). Therefore, Saudi firms are at an early stage in the adoption and implementation of sustainability initiatives.
We might conclude that firms’ overall efficiency decreases and increases in line with market performance. Therefore, there may be a bias in overall efficiency performance in favor of the second stage of the model. We find that market performance efficiency is a common factor restricting overall efficiency improvement. The Saudi stock market has certain key characteristics that differ considerably from those of mature markets (Alshammari and Goto Citation2022). These characteristics include the dominance of uninformed retail investors and strict limits to arbitrage, such as the absence of short-selling restrictions and leverage and the limited access granted to foreign institutions (ibid.). It is well documented that the Saudi stock market is dominated by retail investors, who account for 75% of the market’s trading activities (Saudi Exchange Citation2022b). Moreover, Saudi retail investors are uninformed investors, who engage in stock trading with limited knowledge of and training in interpreting financial information (Lerner, Leamon, and Dew Citation2017; Rahman, Chowdhury, and Sadique Citation2015). In addition, as short selling does not occur in the Saudi markets, there is no correction in mispricing (Hong and Stein Citation2003). These characteristics have led to considerable volatility in the market and have affected stock prices, which may explain the moderate market performance of the Saudi listed firms observed in this study. This study echoes the finding of previous research that retail investors (vs. other investors) are more likely to be noise traders (Rahman, Chowdhury, and Sadique Citation2015). This may generate predictable variations in Saudi stock returns (Alshammari and Goto Citation2022).
At the management level, to balance overall performance across the operational and market stages, listed firms could be encouraged to pay more attention to upgrading their market performance efficiency. It may be difficult for these firms to enhance their overall efficiency performance if they do not increase their market stage performance inputs and outputs. This may require a focus on increasing profits, incorporating more ESG activities, and then building market value. This would in turn increase firms’ market value and attract investors with an interest in sustainability.
4.3.2. Robustness Analysis
Two additional analyses are carried out in this subsection to determine whether our results are robust: a comparative analysis and sensitivity analysis.
For our comparative analysis, we check the accuracy of the previously obtained results by applying two models across the 2019–2021 period: 1) Model (A) by Despotis, Sotiros, and Koronakos (Citation2016), and 2) Model (B) by Kao and Hwang (Citation2009). Model (A) is the two-stage DEA model (1) proposed by Despotis, Sotiros, and Koronakos (Citation2016), while Model (B) is a two-stage DEA series model (2) proposed by Kao and Hwang (Citation2009), both model presented in subsection 4.2. Model (A) takes a composition approach (Despotis, Sotiros, and Koronakos Citation2016), whereas Model (B) takes a multiplicative decomposition approach (Kao and Hwang Citation2009). Model (B) is another method of computing the overall efficiency of a serially linked two-stage process, measured as the product of the individual stage-level efficiency scores. Next, the overall performance is aggregated as the product of the two-stage performance scores. The elements for comparison for each year are the ranking of the three firms with the highest overall efficiency; the average overall efficiency; and the range of efficiency, from minimum efficiency to maximum efficiency.
illustrates the results of the comparative analysis. Two DMUs, D-09 and D-18, consistently rank the highest in terms of overall efficiency over the period sampled. These firms might provide a performance efficiency benchmark that can be used as a guide to improve the performance of other firms. The range of overall efficiency varies slightly across the sampled period for both models. The average overall efficiency shows a decreasing trend over the 2019 to 2021 period. In addition, the average efficiency scores for each year are slightly lower than those obtained using Model A. The main reason for these small differences is that the overall efficiency is defined as the square geometric mean of the efficiency in each stage of the two-stage multiplicative decomposition DEA approach (Model B). In other words, Model B derives the overall efficiency based on individual-stage efficiency values that are obtained by decomposing the overall efficiency. In contrast, in Model A, the stage-level efficiency is as close as possible to its ideal values in the minmax sense (Despotis, Sotiros, and Koronakos Citation2016). All in all, the two models yield the same order (ranking) for the DMUs with the two highest efficiency scores.
Table 5. Results of comparative analysis (2019–2021).
A sensitivity analysis with different scenarios which is another analysis is carried out for checking the robustness of the results. Efficiency scores obtained using two-stage DEA models depend on the choice of variables; changing the combination of variables can to some extent change the scores (Dutta, Jain, and Gupta Citation2020). It is therefore necessary to perform a sensitivity analysis of the two-stage DEA models in different scenarios, with different combinations of the selection variables. In addition, sensitivity analysis is an important way of determining whether the efficiency results are robust and measuring the precision of the two-stage DEA (Avkiran Citation2015; Avkiran and McCrystal Citation2012).
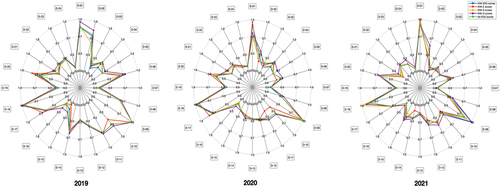
Sensitivity analysis is performed to observe how the results of the two-stage DEA models vary when a single intermediate variable (e.g., ESG scores) is changed. This offers insight into the impact of changing or removing the sustainability variables on firm performance. To perform the sensitivity analysis (Avkiran Citation2015; Avkiran and McCrystal Citation2012), five scenarios between 2019 and 2021 are estimated using 15 two-stage DEA models. This is done while retaining or moving relevant variables (ESG scores, namely environmental (E) scores, social (S) scores, and governance (G) scores). Scenario 1 is the baseline model (with ESG scores), which includes total assets, number of employees, and operating expenses as inputs, ESG scores and revenues as intermediate, and market value and ROE as outputs. Scenarios 2, 3, and 4 use the same input, intermediate, and output variables as the baseline model, but they each substitute the overall ESG score for one of the sustainability scores as an intermediate variable: E, S, or G scores, respectively. Scenario 5 uses the same input, intermediate, and output variables as the baseline model, but it does not include ESG scores. In sum, this analysis helps us understand whether the sustainability variables are likely to change firms’ overall efficiency and performance rankings.
illustrates the sensitivity analysis for the overall efficiency and ranking of the 24 focal listed firms. Analysis of the five scenarios reveals that the firms’ ranking does not change significantly during the sample period, but there are very slight differences in the efficiency performance of the firms over the studied timeframe. Nevertheless, the sustainability variables do not have a significant effect on firm performance (as shown in ). Thus, unexpectedly, ESG activities may not improve Saudi listed firms’ overall performance when considering more than one performance stage simultaneously – such as operational performance and market performance. There are two possible reasons for these findings. First, the Saudi macroeconomic environment (such as legislations, regulations, and ESG disclosure guidelines) is constantly changing and evolving. Second, ESG disclosure is voluntary in the current regulations of the Saudi Stock Exchange, and the lack of ESG regulatory guidance might create a barrier to the integration of sustainability factors into management and investment decisions. Thus, legislation, regulations, and ESG disclosure guidelines should be well defined to increase the overall efficiency, resilience, and integrity of listed firms’ performance. Our findings indicate that ESG practices remain at an early stage in this emerging market, due to business ecosystem legislation. These results echo those of previous studies of emerging economies, which have called on governments to develop regulations and other stakeholders to incorporate ESG practices into their business strategies (Naeem, Cankaya, and Bildik Citation2022).
Figure 4. Overall efficiencies of 24 listed firms based on sensitivity analysis with various models (2019–2021).
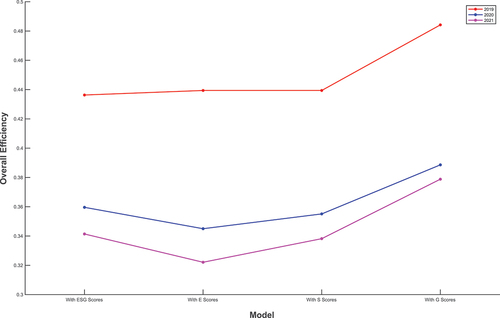
To further investigate the potential effects of the sustainability variables on firm performance, the average overall efficiency is calculated for just four scenarios over the 3 years. The comparative results are illustrated in . Over the studied timeframe, the average overall efficiency varies across the models, with the G score model’s efficiency being the highest, followed by the model with S scores and finally the model with E scores. We can thus infer that more attention has been paid to governance activities and projects than to other sustainability (i.e., environmental and social) activities and projects. This is due to the early emphasis on corporate governance in the Saudi Stock Exchange, represented by the issuing of a corporate governance code by the Saudi Capital Market Authority in 2006 to increase disclosure and transparency and enforce regulations. The code was amended in 2009 and made compulsory in 2017. It aims to regulate Saudi listed firms to ensure full compliance with the best governance practice. This may explain the difference in the level of efficiency between the G model and the other ESG component models. also shows that the level of overall efficiency across the four models decreases after 2020. This is likely to be due to the COVID-19 crisis, which had a negative effect on firm performance in all global stock markets. Therefore, Saudi listed firms should focus on increasing the quality of their sustainability practices while enhancing overall efficiency to continue attracting investors with an interest in sustainability.
Figure 5. Average overall efficiency of 24 listed firms across various models with different sustainability variables (2019–2021).
Finally, we cannot confidently state that these findings from the sample are generalizable to all emerging markets. These results may apply solely to the Saudi emerging market and its legislation regarding ESG.
5. Conclusion
Building on previous research, we propose a new framework for measuring firms’ relative efficiency, which integrates operational and financial measures along with sustainability indicators in a two-stage DEA model. The framework is tested with data on 24 large Saudi listed firms, considering both operational and market performance. Acknowledging that ESG activities may reflect firm value and that these activities may reflect a firm’s operational performance (Gillan, Koch, and Starks Citation2021), ESG scores are modeled simultaneously as an output of the operational performance stage and as an input for the market stage. That is, instead of focusing on ESG measures as a single variable to assess the impact of ESG activities on firm performance, we examine the effects of both total ESG and its three individual components (E, S, and G). Sensitivity analysis, including several different structures of serial two-stage DEA, is conducted.
This study contributes to the literature by measuring firm efficiency from two perspectives, namely operational and market efficiency. Its main empirical findings are as follows. 1) Market stage efficiency has a positive impact on listed firms’ overall performance based on sustainability, operational and financial measures. 2) The mechanism of the proposed modeling framework provides information about efficiency and enables researchers to rank firms’ performance. Thus, it may offer a useful tool for firms’ decision makers and investors to gain sustainable and responsible investment knowledge. 3) Interestingly, the role of sustainability variables in firm performance remains unclear when performance is measured based on the operational and market stages. 4) The empirical findings indicate that ESG practice remains at an early stage in emerging markets; it will take time for related norms and regulations to be implemented and internalized by firms.
These empirical findings suggest several courses of action for policymakers, regulators, firm managers, and participants in emerging markets. A key policy priority should be to develop legislation, regulations, and disclosure guidelines for sustainability practices (e.g., ESG reporting). ESG assessment methods are immature in Saudi Arabia, making it necessary to increase the availability, quality, and transparency of ESG data and metrics. This could offer a useful mechanism for systematizing the macroeconomic environment of emerging markets in relation to ESG practices. Second, regulators should encourage the efficient mobilization of capital to support and strengthen ESG practices. Regulators should also increase awareness of sustainability issues and encourage firms’ managers to focus on ESG objectives. Third, managers should pay attention to promoting ESG practices and thereby enhance firms’ sustainable development. Finally, developing preventive plans and policies for public health crises like the pandemic should be a priority for regulatory authorities.
This study also has certain limitations that point to future research directions. First, the generalizability of the findings is questionable. Future research should treat the findings with caution and use samples of different sizes to model emerging markets. Similarly, future research could extend the period of analysis and enlarge the sample to assess the long-term sustainability performance of listed firms. This is important because investing in ESG requires a long-term perspective; it takes time for these investments to be reflected in market value. Second, our study considers just three inputs, two intermediate, and two outputs. Using a wider range of variables could yield more insights. Third, our study models only two serially linked stages, operational and market performance. Further research could deploy models with more than two stages to measure firm performance with a range of variables. Fourth, this study does not account for the dynamic relationships between periods in firm performance. To accommodate this factor, a dynamic two-stage DEA model will be needed to estimate firm performance. Finally, this study does not deal with uncertainty that might occur in the real world due to variation or ambiguity in the data/variables. Hence, another fruitful direction for further work would be to integrate fuzzy set theory to tackle uncertainty.
Disclosure statement
No potential conflict of interest was reported by the author(s).
Additional information
Funding
Notes
1. The SSE initiative engages market participants and has published guidelines for exploring and enhancing ESG awareness and sustainable investment.
References
- Alareeni, B. A., and A. Hamdan. 2020. ESG impact on performance of US S&P 500-listed firms. Corporate Governance the International Journal of Business in Society 20 (7):1409–28. doi:10.1108/CG-06-2020-0258.
- Almulhim, T. 2019. Analysis of takaful vs. Conventional insurance firms’ efficiency: Two-stage DEA of Saudi Arabia’s insurance market. Cogent Business & Management 6 (1):1633807. doi:10.1080/23311975.2019.1633807.
- Alshammari, S., and S. Goto. 2022. What factors drive Saudi stock markets?–firm characteristics that attract retail trades. International Review of Economics & Finance 80:994–1011. doi:10.1016/j.iref.2022.02.004.
- Amin, G. R., M. Toloo, and B. Sohrabi. 2006. An improved MCDM DEA model for technology selection. International Journal of Production Research 44 (13):2681–86. doi:10.1080/00207540500472754.
- Atan, R., M. M. Alam, J. Said, and M. Zamri. 2018. The impacts of environmental, social, and governance factors on firm performance: Panel study of Malaysian companies. Management of Environmental Quality: An International Journal 29 (2):182–94. doi:10.1108/MEQ-03-2017-0033.
- Avkiran, N. K. 2015. An illustration of dynamic network DEA in commercial banking including robustness tests. Omega 55:141–50. doi:10.1016/j.omega.2014.07.002.
- Avkiran, N. K., and A. McCrystal. 2012. Sensitivity analysis of network DEA: NSBM versus NRAM. Applied Mathematics and Computation 218 (22):11226–39. doi:10.1016/j.amc.2012.05.014.
- Azmi, W., M. K. Hassan, R. Houston, and M. S. Karim. 2021. ESG activities and banking performance: International evidence from emerging economies. Journal of International Financial Markets, Institutions and Money 70:101277. doi:10.1016/j.intfin.2020.101277.
- Bai-Chen, X., F. Ying, and Q. Qian-Qian. 2012. Does generation form influence environmental efficiency performance? An analysis of China’s power system. Applied Energy 96:261–71. doi:10.1016/j.apenergy.2011.11.011.
- Banker, R. D., A. Charnes, and W. W. Cooper. 1984. Some models for estimating technical and scale inefficiencies in data envelopment analysis. Management Science 30 (9):1078–92. doi:10.1287/mnsc.30.9.1078.
- Broadstock, D. C., K. Chan, L. T. Cheng, and X. Wang. 2021. The role of ESG performance during times of financial crisis: Evidence from COVID-19 in China. Finance Research Letters 38:101716. doi:10.1016/j.frl.2020.101716.
- Bruna, M. G., S. Loprevite, D. Raucci, B. Ricca, and D. Rupo. 2022. Investigating the marginal impact of ESG results on corporate financial performance. Finance Research Letters 47:102828. doi:10.1016/j.frl.2022.102828.
- Cek, K., and S. Eyupoglu. 2020. Does environmental, social and governance performance influence economic performance? Journal of Business Economics and Management 21 (4):1165–84. doi:10.3846/jbem.2020.12725.
- Chang, K., X. Cheng, Y. Wang, Q. Liu, and J. Hu. 2023. The impacts of ESG performance and digital finance on corporate financing efficiency in China. Applied Economics Letters 30 (4):871–74. doi:10.1080/13504851.2021.1996527.
- Charnes, A., W. Cooper, A. Y. Lewin, and L. M. Seiford 1997. Data envelopment analysis theory, methodology and applications. The Journal of the Operational Research Society 48 (3):332–33.
- Charnes, A., W. W. Cooper, and E. Rhodes. 1979. Measuring the efficiency of decision-making units. European Journal of Operational Research 3 (4):339–338. doi:10.1016/0377-2217(79)90229-7.
- Chen, Y., W. D. Cook, N. Li, and J. Zhu. 2009. Additive efficiency decomposition in two-stage DEA. European Journal of Operational Research 196 (3):1170–76. doi:10.1016/j.ejor.2008.05.011.
- Chen, K., and J. Zhu. 2019. Scale efficiency in two-stage network DEA. Journal of the Operational Research Society 70 (1):101–10. doi:10.1080/01605682.2017.1421850.
- Chouaibi, S., J. Chouaibi, and M. Rossi. 2021. ESG and corporate financial performance: The mediating role of green innovation: UK common law versus Germany civil law. EuroMed Journal of Business 17 (1):46–71. doi:10.1108/EMJB-09-2020-0101.
- Cook, W. D., K. Tone, and J. Zhu. 2014. Data envelopment analysis: Prior to choosing a model. Omega 44:1–4. doi:10.1016/j.omega.2013.09.004.
- Cooper, W., L. Seiford, K. Tone, and J. Zhu. 2007. Some models and measures for evaluating performances with DEA: Past accomplishments and future prospects. Journal of Productivity Analysis 28 (3):151–63. doi:10.1007/s11123-007-0056-4.
- Cooper, W. W., L. M. Seiford, and J. Zhu. 2011. Data envelopment analysis: History, models, and interpretations. In Handbook on data envelopment analysis, eds. William W. Cooper, Lawrence M. Seiford & Joe Zhu, 1–39. Springer New York, NY: Springer.
- Despotis, D. K., D. Sotiros, and G. Koronakos. 2016. A network DEA approach for series multi-stage processes. Omega 61:35–48. doi:10.1016/j.omega.2015.07.005.
- Din, S. U., M. A. Khan, M. J. Khan, and M. Y. Khan. 2021. Ownership structure and corporate financial performance in an emerging market: A dynamic panel data analysis. International Journal of Emerging Markets 17 (8):1973–97. doi:10.1108/IJOEM-03-2019-0220.
- Dutta, P., A. Jain, and A. Gupta. 2020. Performance analysis of non-banking finance companies using two-stage data envelopment analysis. Annals of Operations Research 295 (1):91–116. doi:10.1007/s10479-020-03705-6.
- Ebrahimi, B., and E. Hajizadeh. 2021. A novel DEA model for solving performance measurement problems with flexible measures: An application to Tehran Stock Exchange. Measurement 179:109444. doi:10.1016/j.measurement.2021.109444.
- Emrouznejad, A., and G-L. Yang. 2018. A survey and analysis of the first 40 years of scholarly literature in DEA: 1978–2016. Socio-Economic Planning Sciences 61:4–8. doi:10.1016/j.seps.2017.01.008.
- Färe, R. 1991. Measuring Farrell efficiency for a firm with intermediate inputs. Academia Economic Papers 19 (2):329–40.
- Fatemi, A., M. Glaum, and S. Kaiser. 2018. ESG performance and firm value: The moderating role of disclosure. Global Finance Journal 38:45–64. doi:10.1016/j.gfj.2017.03.001.
- Feng, Z., and Z. Wu. 2021. ESG disclosure, REIT debt financing and firm value. The Journal of Real Estate Finance & Economics 67 (3):1–35. doi:10.1007/s11146-021-09857-x.
- Friede, G., T. Busch, and A. Bassen. 2015. ESG and financial performance: aggregated evidence from more than 2000 empirical studies. Journal of Sustainable Finance & Investment 5 (4):210–33. doi:10.1080/20430795.2015.1118917.
- Gillan, S. L., A. Koch, and L. T. Starks. 2021. Firms and social responsibility: A review of ESG and CSR research in corporate finance. Journal of Corporate Finance 66:101889. doi:10.1016/j.jcorpfin.2021.101889.
- Henriques, I. C., V. A. Sobreiro, H. Kimura, and E. B. Mariano. 2020. Two-stage DEA in banks: Terminological controversies and future directions. Expert Systems with Applications 161:113632. doi:10.1016/j.eswa.2020.113632.
- Hong, H., and J. C. Stein. 2003. Differences of opinion, short-sales constraints, and market crashes. The Review of Financial Studies 16 (2):487–525. doi:10.1093/rfs/hhg006.
- Hou, C.-E., W.-M. Lu, and S.-W. Hung. 2019. Does CSR matter? Influence of corporate social responsibility on corporate performance in the creative industry. Annals of Operations Research 278 (1):255–79. doi:10.1007/s10479-017-2626-9.
- Hsieh, M.-F., C.-C. Lee, and M.-F. Shen. 2023. Ownership structure, diversification, and bank performance: International evidence. Emerging Markets Finance and Trade 59 (1):90–112. doi:10.1080/1540496X.2022.2093103.
- Huang, C. 2021. Using a hybrid two‐stage DEA model to analyze the profitability and marketability of medical manufacturing firms. International Transactions in Operational Research 28 (1):470–92. doi:10.1111/itor.12546.
- Huang, D. Z. 2021. Environmental, social and governance (ESG) activity and firm performance: A review and consolidation. Accounting & Finance 61 (1):335–60. doi:10.1111/acfi.12569.
- Iazzolino, G., M. E. Bruni, S. Veltri, D. Morea, and G. Baldissarro. 2023. The impact of ESG factors on financial efficiency: An empirical analysis for the selection of sustainable firm portfolios. Corporate Social Responsibility and Environmental Management 30 (4):1917–27. doi:10.1002/csr.2463.
- Jebali, E., H. Essid, and N. Khraief. 2017. The analysis of energy efficiency of the Mediterranean countries: A two-stage double bootstrap DEA approach. Energy 134:991–1000. doi:10.1016/j.energy.2017.06.063.
- Kao, C. 2012. Efficiency decomposition for parallel production systems. Journal of the Operational Research Society 63 (1):64–71. doi:10.1057/jors.2011.16.
- Kao, C., and S. Hwang. 2009. Efficiency decomposition in network data envelopment analysis: A relational model. European Journal of Operational Research 192 (3):949–62. doi:10.1016/j.ejor.2007.10.008.
- Kao, C., and S.-N. Hwang. 2011. Decomposition of technical and scale efficiencies in two-stage production systems. European Journal of Operational Research 211 (3):515–19. doi:10.1016/j.ejor.2011.01.010.
- Kasbar, M. S. H., N. Tsitsianis, A. Triantafylli, and C. Haslam. 2023. An empirical evaluation of the impact of agency conflicts on the association between corporate governance and firm financial performance. Journal of Applied Accounting Research 24 (2):235–59. doi:10.1108/JAAR-09-2021-0247.
- Kuo, K.-C., H.-Y. Yu, W.-M. Lu, and T.T. Le. 2022. Sustainability and corporate performance: Moderating role of environmental, social, and governance investments in the transportation sector. Sustainability 14 (7):40–95. doi:10.3390/su14074095.
- Lahouel, B., Y. Ben Zaied, Y. G-L, M.-G. Bruna, and Y. Song. 2022. A non-parametric decomposition of the environmental performance-income relationship: Evidence from a non-linear model. Annals of Operations Research 313 (1):525–58. doi:10.1007/s10479-021-04019-x.
- Lahouel, B., L. Taleb, Y. Ben Zaied, and Managi, S. 2022. Financial stability, liquidity risk and income diversification: Evidence from European banks using the CAMELS–DEA approach. Annals of Operations Research 1–32. doi:10.1007/s10479-022-04805-1.
- Lahouel, B., L. Taleb, K. Kočišová, and Y. Ben Zaied. 2022. The threshold effects of income diversification on bank stability: An efficiency perspective based on a dynamic network slacks-based measure model. Annals of Operations Research 1–38. doi:10.1007/s10479-021-04503-4.
- Lahouel, B. B., Y. B. Zaied, Y. Song, and G.L. Yang. 2021. Corporate social performance and financial performance relationship: A data envelopment analysis approach without explicit input. Finance Research Letters 39:101656. doi:10.1016/j.frl.2020.101656.
- Lee, C.-C., F. Yahya, and A. Razzaq. 2022. The asymmetric effect of temperature, exchange rate, metals, and investor sentiments on solar stock price performance in China: Evidence from QARDL approach. Environmental Science and Pollution Research 29 (52):78588–602. doi:10.1007/s11356-022-21341-4.
- Lerner, J., A. Leamon, and S. Dew. 2017. The CMA and the Saudi stock market crash of 2006. BELLA Research Group and Saudi Capital Market Authority (CMA) 1:1–14.
- Liang, L., W. D. Cook, and J. Zhu. 2008. DEA models for two‐stage processes: Game approach and efficiency decomposition. Naval Research Logistics (NRL) 55 (7):643–53. doi:10.1002/nav.20308.
- Li, H., C. Chen, W. D. Cook, J. Zhang, and J. Zhu. 2018. Two-stage network DEA: Who is the leader? Omega 74:15–19. doi:10.1016/j.omega.2016.12.009.
- Lim, S., K. W. Oh, and J. Zhu. 2014. Use of DEA cross-efficiency evaluation in portfolio selection: An application to Korean stock market. European Journal of Operational Research 236 (1):361–68. doi:10.1016/j.ejor.2013.12.002.
- Lööf, H., M. Sahamkhadam, and A. Stephan. 2022. Is corporate social responsibility investing a free lunch? The relationship between ESG, tail risk, and upside potential of stocks before and during the COVID-19 crisis. Finance Research Letters 46:102499. doi:10.1016/j.frl.2021.102499.
- Lozano, S. 2011. Scale and cost efficiency analysis of networks of processes. Expert Systems with Applications 38 (6):6612–17. doi:10.1016/j.eswa.2010.11.077.
- Lu, C.-C., W. Dan, X. Chen, C. K. Tseng, and K. W. Chou. 2021. Evaluation of the operating performance of Taiwanese machine tool industry with the dynamic network DEA model. Enterprise Information Systems 15 (1):87–104. doi:10.1080/17517575.2019.1709662.
- Lu, W. M., Q. L. Kweh, I. W. K. Ting, and C. Ren. 2023. How does stakeholder engagement through environmental, social, and governance affect eco‐efficiency and profitability efficiency? Zooming into Apple Inc.‘s counterparts. Business Strategy and the Environment 32 (1):587–601. doi:10.1002/bse.3162.
- Makni, M. S. 2023. Analyzing the impact of COVID-19 on the performance of listed firms in Saudi market. Technological Forecasting and Social Change 187:122171. doi:10.1016/j.techfore.2022.122171.
- Maritz, A., and C.-J. Shieh. 2013. Performance analysis of automobile industry in Taiwan with data envelopment analysis. International Journal of Applied Mathematics and Statistics 38 (8):84–95.
- Mohammadian, I., and M. J. Rezaee. 2020. A new decomposition and interpretation of hicks-moorsteen productivity index for analysis of Stock Exchange companies: Case study on pharmaceutical industry. Socio-Economic Planning Sciences 69:100674. doi:10.1016/j.seps.2018.12.001.
- Mohtashami, A., and B. M. Ghiasvand. 2020. Z-ERM DEA integrated approach for evaluation of banks & financial institutes in stock exchange. Expert Systems with Applications 147:113218. doi:10.1016/j.eswa.2020.113218.
- Naeem, N., S. Cankaya, and R. Bildik. 2022. Does ESG performance affect the financial performance of environmentally sensitive industries? A comparison between emerging and developed markets. Borsa Istanbul Review 22:S128–S40. doi:10.1016/j.bir.2022.11.014.
- Puertas, R., P. Carracedo, M. Garcia, and V. Vega. 2022. Analysis of the determinants of market capitalisation: Innovation, climate change policies and business context. Technological Forecasting and Social Change 179:121644. doi:10.1016/j.techfore.2022.121644.
- Quan, C., S. Yu, X. Cheng, and F. Liu. 2022. Comprehensive efficiency evaluation of social responsibility of Chinese listed logistics enterprises based on DEA-Malmquist model. Operations Management Research 15 (3–4):1–16. doi:10.1007/s12063-022-00258-8.
- Rahi, A. F., R. Akter, and J. Johansson. 2021. Do sustainability practices influence financial performance? Evidence from the Nordic financial industry. Accounting Research Journal 35 (2):292–314. doi:10.1108/ARJ-12-2020-0373.
- Rahman, M. A., S. S. H. Chowdhury, and M. S. Sadique. 2015. Herding where retail investors dominate trading: The case of Saudi Arabia. The Quarterly Review of Economics & Finance 57:46–60. doi:10.1016/j.qref.2015.01.002.
- Refinitiv. 2023. Refinitiv ESG company scores. Accessed June 14, 2023. https://www.refinitiv.com/en/sustainable-finance/esg-scores.
- Saudi Exchange. 2022a. ESG disclosure guidelines. https://www.saudiexchange.sa/wps/wcm/connect/d0922cd6-e0bf-4554-ad4d-03f0c2eea5ad/ESG+Guidelines+EN+FINAL+221021.pdf?MOD=AJPERES&CVID=nOYd-01.
- Saudi Exchange. 2022b. Weekly stock market ownership and trading activity report. Reportno.
- Saudi vision 2030. The institution name is the National Transformation Program, Kingdom of Saudi Arabia, Riyadh. Accessed May 22, 2022. https://www.vision2030.gov.sa/media/rc0b5oy1/saudi_vision203.pdf.
- Siddiqui, F., K. YuSheng, and K. Tajeddini. 2023. The role of corporate governance and reputation in the disclosure of corporate social responsibility and firm performance. Heliyon 9 (5):e16055. doi:10.1016/j.heliyon.2023.e16055.
- Stefanoni, S., and A. Voltes-Dorta. 2021. Technical efficiency of car manufacturers under environmental and sustainability pressures: A data envelopment analysis approach. Journal of Cleaner Production 311:127589. doi:10.1016/j.jclepro.2021.127589.
- Tetteh, J. E., A. Amoah, K. Ofori-Boateng, and G. Hughes. 2022. Stock market response to COVID-19 pandemic: A comparative evidence from two emerging markets. Scientific African 17:e01300. doi:10.1016/j.sciaf.2022.e01300.
- Tissaoui, K., B. Hkiri, M. Talbi, Alghassab, W. and K. I. Alfreahat. 2021. Market volatility and illiquidity during the COVID-19 outbreak: Evidence from the Saudi stock exchange through the wavelet coherence approaches. The North American Journal of Economics & Finance 58:101521. doi:10.1016/j.najef.2021.101521.
- Vinodkumar, N., and G. Alarifi. 2020. Environmental social governance: A core value to responsible stakeholders and stock market sustainability in the Kingdom of Saudi Arabia. Journal of Sustainable Finance & Investment 12 (4):1–17. doi:10.1080/20430795.2020.1827602.
- Wang, D., S. Li, and T. Sueyoshi. 2014. DEA environmental assessment on US industrial sectors: Investment for improvement in operational and environmental performance to attain corporate sustainability. Energy Economics 45:254–67. doi:10.1016/j.eneco.2014.07.009.
- Wanke, P., and C. Barros. 2014. Two-stage DEA: An application to major Brazilian banks. Expert Systems with Applications 41 (5):2337–44. doi:10.1016/j.eswa.2013.09.031.
- Wong, W. C., J. A. Batten, S. B. Mohamed-Arshad, S. B. Mohamed-Arshad, S. Nordin, and A. A. Adzis. 2021. Does ESG certification add firm value? Finance Research Letters 39:101593. doi:10.1016/j.frl.2020.101593.
- Wu, D. D., Z. Yang, and L. Liang. 2006. Using DEA-neural network approach to evaluate branch efficiency of a large Canadian bank. Expert Systems with Applications 31 (1):108–15. doi:10.1016/j.eswa.2005.09.034.
- Xie, J., W. Nozawa, M. Yagi, H. Fujii, and S. Managi. 2019. Do environmental, social, and governance activities improve corporate financial performance? Business Strategy and the Environment 28 (2):286–300. doi:10.1002/bse.2224.
- Zhang, Q., D. Koutmos, K. Chen, and J. Zhu. 2021. Using operational and stock analytics to measure airline performance: A network DEA approach. Decision Sciences 52 (3):720–48. doi:10.1111/deci.12363.