Abstract
Mucous metaplasia is an important determinant of small airway obstruction in COPD. Its relationship to small airway inflammation is poorly defined. We analyzed 4 to 6 small airways in 19 COPD patients, GOLD stages 0–4, from lobectomy or lung volume reduction surgery tissue samples. To identify intracellular mucin, periodic acid fluorescent Schiff's (PAFS) stained slides were imaged by fluorescence microscopy. PAFS+ staining area, basement membrane length (LBM), epithelial height and area were measured. Mucin was expressed as a percentage of epithelial area. Mucin volume density (MVD) was calculated as PAFS+ area divided by the product of LBM and 4/π. Airways were Giemsa stained for eosinophils and immunostained with antibodies against CD3, CD4, CD8, CD68, and neutrophil elastase (NE), and the number of positively stained cells/mm2 was quantified in the airway wall. Mucin percent correlated with CD3+ cell density (r = 0.553, P < 0.0001), and MVD correlated with CD3+ (r = 0.570, P < 0.0001) and CD8+ cell density (r = 0.279, P = 0.016). There were weak negative correlations between mucin percent as well as MVD and CD68+ cell density (r = −0.270, P = 0.02 and r = −0.245, P = 0.036). There was no relationship between epithelial mucin content and CD4+, NE+, or eosinophil cell density. CD3+ and CD8+ lymphocytic inflammation is related to small airway mucous metaplasia in COPD and may play a causative role in its development.
INTRODUCTION
The small airways, defined as less than 2 millimeters in internal diameter, are a primary site of airflow obstruction in COPD. It is also an area ongoing inflammation and remodeling. Mucus is overproduced in response to inflammatory signals in a process called mucous metaplasia. In COPD, mucous metaplasia and mucus hypersecretion have been found in the small airways, which significantly contributes to airflow obstruction (Citation[1],Citation[2],Citation[3]). This is not a uniform phenomenon in all COPD patients; previously, we found great variability in small airway mucous metaplasia in advanced emphysema patients who underwent lung volume reduction surgery (LVRS) (Citation[4]).
There is a great need to uncover the pathophysiologic mechanisms behind mucous metaplasia in COPD. It has been associated with a more rapid decline in lung function (Citation[5]), increased risk of hospitalization and infection (Citation[6],Citation[7]), and survival (Citation[8]). Despite these data highlighting the contribution of mucus hypersecretion to COPD disease progression, morbidity, and mortality, few studies have investigated the pathogenesis of mucous metaplasia in COPD.
It has been assumed that mucus is overproduced as a result of heightened inflammation, but the identity of the responsible inflammatory cells and signals remain unknown in COPD. Herein, we describe the extent of mucous metaplasia in the COPD small airway epithelium and assess its relationship with the magnitude and cell type of inflammatory infiltrate in the small airways. Furthermore, we test the hypothesis that lymphocyte, neutrophil, and macrophage cell density of the small airways rises as the degree of mucous metaplasia worsens. Most notably, our results show that significant correlations exist between the degree of lymphocytic inflammation and mucous metaplasia.
Some of these data were presented as an abstract at the 2007 American Thoracic Society International Conference (Citation[9]).
MATERIALS AND METHODS
Patient selection
Patients with COPD or who were at risk for COPD and underwent lung resectional surgery were included. COPD was defined as the presence of airflow obstruction based on FEV1/FVC ratio < 70 and a > 10 pack-year history of smoking. The patients were subdivided according to disease severity, based on the Global Initiative for Chronic Obstructive Lung Disease (GOLD) Guidelines (Citation[10]). Seven patients underwent lung volume reduction surgery (LVRS) at Temple University in Philadelphia, Pennsylvania, and 12 patients underwent lobectomy for a primary lung malignancy at the Veterans Affairs Medical Center in Houston, Texas. All surgical biopsies were reviewed by the investigators in a blinded fashion.
Tissue preparation
All tissue analysis was approved by the Institutional Review Boards of Temple University and the Baylor College of Medicine, and done with an experienced lung pathologist. For specimens obtained from lung cancer resection, the sections chosen for review were distant from the malignancy to avoid the confounding influence of malignancy on inflammation and mucous metaplasia. All specimens were formalin fixed and paraffin embedded, sectioned at 5 μ m, deparaffinized in xylene, and rehydrated with graded ethanol solutions.
Identification of intracellular mucin
Dewaxed tissue sections were stained using a periodic acid fluorescent Schiff (PAFS) staining procedure previously described by Evans et al. (Citation[11]). Sections were oxidized in 1% periodic acid (10 min), rinsed, treated with acriflavine fluorescent Schiff's reagent (0.5% acriflavine HCl wt/vol, 1% sodium metabisulfite wt/vol, 0.01 N HCl) for 20 min, rinsed in double deionized H2O, and rinsed 2–5 min in acid alcohol (0.1 N HCl in 70% ethanol). Slides were dehydrated in graded ethanol solutions and allowed to air dry in the dark. Once dry, cover slips were placed on the slides using Canada balsam mounting medium (50% Canada balsam resin, 50% methyl salicylate; Fisher Chemicals). Using a Nikon Eclipse E8000 fluorescent microscope, mucin granules were isolated with a G2A filter (excitation wavelength 510–550 nm). For each field, an image was generated using only the red acquisition channel (approximately 600 ms exposure). The remainder of the epithelium and small airway was visualized with a B-2E/C FITC filter (excitation wavelength 465-495 nm) using the green channel alone.
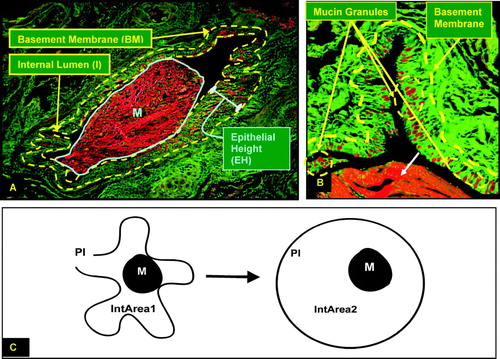
When excited at 510–550 nm, mucin granules fluoresce red. In addition, nuclei and cytoplasm (but not mucin granules) fluoresce green when excited at lower wavelengths. Normal lung sections were used as a negative control. Digital images were acquired of the entire airway at 4× or 10×, and images of airway quadrants were obtained at 20× utilizing Qcapture Suite version 2.90.1. The red and green images were taken separately to obtain the best contrast of the mucin granules compared to the remainder of the epithelium and were superimposed using Adobe Photoshop cs2 version 9.0. Typical results are presented in .
Figure 1 (A) Representative PAFS stained small airway, with borders of the epithelium outlined in yellow, and the large mucus plug in the airway lumen (M), outlined in blue. Morphometric measurements taken are the areas of the Internal Lumen (AI), Basement Membrane (ABM), and luminal mucus (AM), and Epithelial Height (EH). (B) Periodic Acid Fluorescent Schiff stain of a small airway from a patient with advanced emphysema. The red channel and green channel images were superimposed upon each other to generate this image. When excited at 510-550 nm, mucin granules fluoresce red. Note the red mucin containing granules in the epithelial layer, and the large plug of mucous exudation in the lumen of the airway (white arrow). (C) Calculation of area of small airway lumen via expansion technique. Ratio of luminal mucus area (M) to expanded internal area (IntArea2), or Mucus Occupying Ratio (MOR), expressed as M / (PI/2)2/π, where PI = lumen perimeter.
Immunoperoxidase and Giemsa staining
Prior to primary antibody application, the sections to be stained for lymphocytes and macrophages were pretreated with sodium citrate pH 6.0 antigen unmasking solution. Endogenous peroxidase activity was blocked with 1.5% hydrogen peroxide and non-specific sites were blocked with 5% normal serum. For primary antibody binding, mouse antibodies were used to identify CD4+ lymphocytes (anti CD4, ab846, Abcam, USA), macrophages (anti CD68, ab955, Abcam, USA) and neutrophils (anti neutrophil elastase, NP57, Dako, USA). Rabbit antibodies were used to identify CD3+ and CD8+ lymphocytes (anti CD3, ab16669, and anti CD8, ab4055, Abcam, USA).
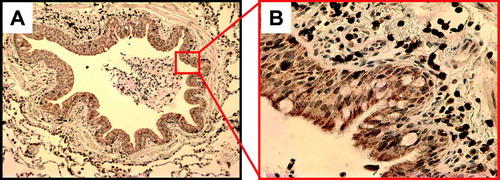
Sections were incubated with primary antibody for 1hr at room temperature, then incubated with the appropriate biotinylated secondary antibody(1:200) followed by avidin-biotin-peroxidase complex in theVectastain Elite kit (both from Vector Laboratories, Burlingame, California). Staining was visualized with the chromogenic substrate diaminobenzidine (DAB), (Vector Labs) which produces a brown color. The sections were counterstained withhematoxylin (blue nuclei). Sections were washed in between each step with phosphate-buffered saline (PBS). Human tonsil was used as a positive control and biotinylated mouse anti-IgG antibody on lung tissue as a negative control. depicts an example.
Figure 2 (A) Representative small airway stained for CD3, at 100x. (B) Quadrant of small airway, seen at 400x.
For identification of eosinophils, dewaxed sections were rehydrated to water and then stained with Wright-Giemsa (Thermo Electron Corporation) for 1 hour, rinsed briefly in a pH 6.5 buffered solution, dehydrated with 3 serial 100% ethanol rinses, and then mounted with permount.
Morphometry
All airways ≤ 2 mm in greatest internal diameter were examined. Airways were excluded from analysis if the epithelial layer was disrupted. Epithelial morphometry was performed on the PAFS stained slides as previously described by us (Citation[4]), using Image J (Citation[12]). Areas and perimeters of the internal lumen (AI, PI) and basement membrane (ABM,PBM) were measured, as well as epithelial height (EH) at 15 random locations along the airway perimeter. Four to six airways per patient were measured in a blinded fashion. Epithelial Area (EA) was calculated as the difference between ABM and AI. EA was divided by ABM, and the EH was divided by PBM to adjust for differences in airway size; see .
Mucin quantification
Mucin staining was measured using a modified model described by Evans et al. (Citation[11]) using Image J. Four to 6 airways per patient were measured. Each airway was divided into quadrants, and each quadrant was analyzed at 20×. Length of the basement membrane (LBM) and area of observed epithelium (EA) was measured. Using images captured in the red channel alone, the total area of mucin granules (Mucin Area; MA) was measured. Volume density of epithelial mucin was calculated stereologically, as described previously (Citation[13],Citation[14]). Mucin volume density (MVD) was calculated as (MA) / (LBM)(4/π). As a result, data are presented as the volume of intracellular mucin per unit surface area of the basement membrane.
Intralumenal mucin area (M) was quantified and expressed as the Mucus Occupying Ratio (MOR), as described by Aikawa et al. (Citation[15]) as M / (PI/2)2/π. demonstrates the “expansion” technique, where the internal area of a fully inflated airway is calculated based on the internal perimeter (PI), using the formula A = (PI/2)2/π. Therefore, the area of intralumenal mucin is expressed as a ratio to the “expanded” airway lumen.
Inflammatory cell quantification
Four to six airways per patient were analyzed. The airways were divided into quadrants and images were captured at 40×. Digital photographs were taken through a Nikon Optiphot microscope, utilizing the SPOT Advanced software, version 3.4.5. The number of positively stained cells from the apical epithelial border through the adventitia of each airway was manually quantified in each quadrant using Image J. The quadrant area was measured and cell density was expressed as number of cells per square millimeter.
Statistics
Descriptive statistics are expressed as mean ± SD, except when otherwise noted. A P-value of < 0.05 was considered statistically significant. Standard deviation measurements reflect overall standard deviations, not residual standard deviations after accounting for subject in the model. A one-way ANOVA was used to compare baseline demographic and pulmonary function data between the groups. For the quantitative assessments of intracellular mucin and inflammatory cells, statistical analysis was performed on the multiple measurements per airway variable, and on the multiple airways per patient. A two-way ANOVA (group, sample) was used to analyze the multi-sample histopathologic measurements (on normalized ranks if data failed the test for normality).
The model used in the analysis was a linear mixed model modified to allow for modeling of the “within subject” covariance structure. Different covariance structures were attempted with the final choice dictated by the goodness of fit. PROC MIXED (SAS V.9, SAS Institute, Cary, NC) was used with the treatment group as the fixed effect and the multiple samples (within subject) as the random effect using a compound symmetry covariance structure. All data was transformed to normalized ranks prior to analysis to accommodate non-normality of the data set. Pearson correlations were used to calculate correlation coefficients of small airway inflammation and morphometry with epithelial mucin content.
RESULTS
Patient characteristics
Patient characteristics are summarized in . All patients were clinically stable at the time of surgery. There were a total of 19 patients; 4 patients in the GOLD 0 group, 4 in GOLD 1, 4 in GOLD 2, 4 in GOLD 3, and 3 in GOLD 4. All GOLD 3 and 4 patients had bilateral upper lobe LVRS; the remainder had lobectomy for lung malignancy. All patients were similar in age. All GOLD 3 and 4 patients were ex-smokers, whereas there were 3 active smokers in GOLD stages 0-2. No patients in GOLD 0 and 1 were treated with systemic or inhaled steroids; 1 out of 4 patients in GOLD 2 and 3 were treated with systemic steroids within 6 months prior to surgery; all 3 patients in GOLD 4 were treated with systemic steroids. One and 3 patients in GOLD 2 and 3, respectively, were on chronic inhaled steroids. No patient in GOLD 4 was on chronic inhaled steroids. Overall, there was a linear decline in FEV1, FVC, and FEV1/FVC ratio as disease severity worsened across GOLD stages 0 to 4.
Table 1 Patient demographics
Inflammation, mucous metaplasia, and morphometry
The results are shown in . There were no significant differences in CD4+, CD8+, CD68+, NE+, or eosinophil cell density among groups (). CD3+ cell density was greater in GOLD 4 compared to GOLD 0 and 2 ( and ); CD3+ cell density trended to be greater in GOLD 4 compared to GOLD 1, though this did not achieve statistical significance (P = 0.07). Total mucin area (MA), mucin percent, and mucin volume density (MVD) were significantly greater in GOLD 4 compared to all other groups ( and ). Mucin % was also greater in GOLD 3 compared to GOLD 0 and 2 (). MVD inversely correlated with %FEV1 (r = −0.674, P = 0.002; ). Unadjusted epithelial area (EA) was not different among groups; however, epithelial area adjusted for basement membrane area (EA/BMA) was greater in GOLD 4 compared to GOLD 1 and 2. Similarly, unadjusted epithelial height (EH) and EH adjusted for basement membrane perimeter (EH/BMP) was greater in GOLD 4 compared to all other groups ().
Figure 3 All inflammatory cell populations in each GOLD stage. Values expressed as mean ± SD. *P < 0.05 compared to GOLD 0 and 2.
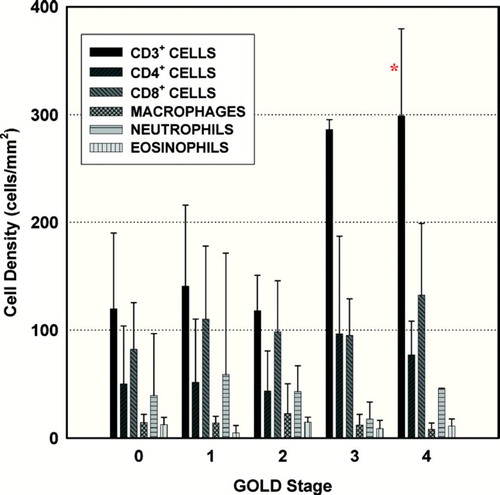
Figure 4 Small airway epithelial mucin area, mucin percent, and mucin volume density by GOLD stage. Values expressed as mean ± SD. *P < 0.05 compared to GOLD 0. † P < 0.05 compared to GOLD 1. ‡ P < 0.05 compared to GOLD 2. § P < 0.05 compared to GOLD 3. ¶ P < 0.05 compared to GOLD 4.
Figure 5 (A) CD3+ cell density by GOLD stage. (B) Mucin volume density by GOLD stage. (C) Epithelial height by GOLD stage. (D) Mucin volume density inversely correlated with %FEV1. *P < 0.05 compared to GOLD 0. † P < 0.05 compared to GOLD 1. ‡ P < 0.05 compared to GOLD 2. § P < 0.05 compared to GOLD 3.
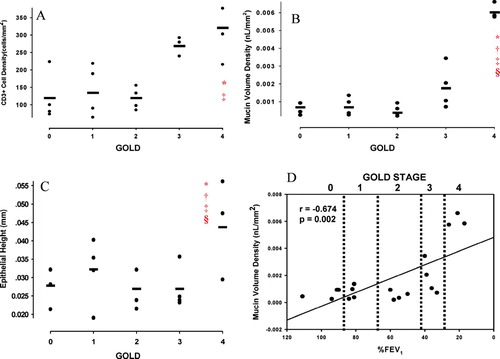
Table 2 Airway inflammation, epithelial morphometry, and mucus content
Correlations between small airway inflammatory cell density, epithelial mucin content, and morphometry are summarized in . Moderately strong correlations were found between CD3+ cell density and MA (r = 0.341, P = 0.003), mucin % (r = 0.553, P < 0.0001), and MVD (r = 0.570, P < 0.0001; ). More modest correlations existed between CD8+ cell density and MVD (r = 0.279, P = 0.016; ) and MOR (r = 0.248, P = 0.034), and modest inverse correlations existed between CD68+ cell density and mucin % (r = −0.270, P = 0.020) and MVD (r = −0.245, P = 0.036). No significant relationships were found between CD4+, NE+, or eosinophil cell density with epithelial mucin content or MOR. A strong correlation existed between EA and MA (r = 0.618, P < 0.0001), and a correlation was also found between EH and MA (r = 0.359, P < 0.0001). EA/BMA, EH, and EH/BMP weakly correlated with mucin % (r = 0.249, P = 0.022 for EA/BMA; r = 0.258, P < 0.001 for EH; r = 0.311, P = 0.004 for EH/BMP) and MVD (0.400, P = 0.0002 for EA/BMA, ; r = 0.398, P < 0.0001 for EH, ; r = 0.377, P = 0.0004 for EH/BMP). There were weak inverse correlations between MOR and EA/BMA (r = −0.215, P = 0.048) and EH (r = −0.145, P < 0.0001).
Figure 6 Correlations between (A) CD3+ cell density and mucin volume density; (B) CD8+ cell density and mucin volume density; (C) Mucin volume density and adjusted epithelial area; and (D) Mucin volume density and epithelial height.
Table 3 Correlations between small airway epithelial mucus content, morphometry, and inflammatory cell density
DISCUSSION
Mucus hypersecretion has long been observed as a pathologic feature in many obstructive lung diseases, most notably asthma and cystic fibrosis. The airways of healthy individuals contain few mucous cells, but the airways of asthmatics display dramatically increased numbers of mucin-producing goblet cells, a trait commonly referred to as mucous metaplasia. Etiologies of mucous metaplasia include cigarette smoke (Citation[16]), repeated viral infection (Citation[17]), Th2 type inflammation, particularly through interleukin 13 (Citation[18]), and fungal antigens (Citation[19]). In contradistinction from asthma, the mechanisms behind mucous metaplasia in COPD are poorly understood. Some studies on COPD have reported a Th2 phenotype of lymphocytic cytokine production (Citation[20], Citation[21]), but the majority have shown a Th1 phenotype, which has not been implicated in mucous metaplasia in any study to date (Citation[22], Citation[23]).
Our goal was to correlate the type and extent of airway inflammation with epithelial mucus content in those with varying disease severity to provide a better understanding of the pathogenesis of mucous metaplasia in COPD. To our knowledge, this is the first study to directly relate the characteristics (cell type and extent) of the inflammatory cell infiltrate to small airway mucous metaplasia in COPD. Our study showed that small airway mucous metaplasia increased as COPD severity worsened, corroborating data from prior studies (Citation[1], Citation[2]). Whereas other studies examined either small airway intralumenal mucus content (Citation[2]) or goblet cell hyperplasia in chronic bronchitics (Citation[1]), we quantitated epithelial mucus content in those with emphysema, as well as related mucous metaplasia to lung function along the spectrum of disease severity (%FEV1) in addition to broad disease category (e.g., GOLD stage, COPD or No COPD). In addition, in contrast to a previous study by Hogg et al. (Citation[2]), our assessments of small airway inflammation were more quantitative, which may explain certain differences in our results compared to prior studies. Secondly, the greatest degree of mucous metaplasia was found in those with GOLD 4 disease, a group comprised of patients with advanced upper lobe predominant emphysema. This finding underscores an important concept: despite little radiographic evidence of airway pathology and a lack of chronic mucus hypersecretion, mucous metaplasia is a significant component of small airway pathology in advanced emphysema.
We found significant correlations between CD3+ and CD8+ lymphocytes and mucin volume density, strengthening the association implied but not directly stated by prior studies (Citation[1], Citation[2]). The role of CD8+ lymphocytes in COPD pathogenesis is poorly understood. Their key function is to cause cytolysis or apoptosis of virus infected cells, and it has been hypothesized that collateral tissue damage results from this process (Citation[24]). In addition, latent viral infection may provide a persistent stimulus for CD8+ lymphocyte activation (Citation[25]). Although classically considered a Th1 inflammatory process, CD8+ lymphocytes recovered from COPD patients via bronchoalveolar lavage have demonstrated increased expression of IL-4, IL-10, and IL-13 (Citation[26], Citation[27]).
As these cytokines are crucial to the development of mucous metaplasia in asthma (Citation[28]), this lends credence to the hypothesis that CD3+ and CD8+ cells drive the development of small airway mucous metaplasia in COPD. Alternatively, small airway lymphocytic inflammation and mucous metaplasia have no causal relationship but simply increase independently as disease worsens, perhaps as consequences of persistent viral infection. Indeed, the opposite relationship may be true; the development of mucus metaplasia may have resulted in lymphocyte accumulation. Nonetheless, our study demonstrates that CD3+ and CD8+ lymphocytic inflammation is associated with mucous metaplasia even though their exact relationship remains to be defined.
Unexpectedly, there were inverse correlations between macrophage cell density and epithelial mucin content. In contrast to prior studies showing increased macrophage airway inflammation as COPD disease severity worsens (Citation[29], Citation[30]), we found no relationship between the two. In our samples, the majority of macrophages were located in the alveoli or airway lumen with less airway wall infiltration, which most likely contributed to our results. There were also more active smokers as well as a trend toward greater macrophage airway inflammation in the GOLD 0, 1, and 2 groups compared to GOLD 3 and 4, suggesting either a reduction of macrophage inflammation with worsening disease severity or heightened macrophage inflammation in the current smokers. There were also several people recently treated with systemic or inhaled steroids, which may have modified the magnitude of airway inflammation and epithelial mucus. Regardless, we propose validation in a larger cohort of patients before a more definitive conclusion can be made.
We found no relationship between either neutrophil or eosinophil cell density or epithelial mucin content. Although neutrophils are crucial to COPD pathogenesis (Citation[29], Citation[31]), few studies have related neutrophilic airway inflammation to mucous metaplasia. This lack of association may be due to difficulty capturing neutrophils located in the airway wall because of their rapid transit through the lung (Citation[32]). We analyzed eosinophils because of their significant presence in asthma, a disease characterized by mucous metaplasia and mucus hypersecretion. We did not find significant eosinophilia in our samples, which is in line with prior studies showing a lack of eosinophilic inflammation in COPD (Citation[33]).
Another novel aspect of our study is the correlation of mucous metaplasia of the small airways with epithelial layer thickness. While this relationship is modest, it should be noted that this relationship relies only on intraepithelial mucin content and does not take into account the balance between rate of production and secretion of mucus. To account for this, we quantified the amount of luminal mucus and expressed it as the MOR. We found an inverse correlation between MOR and epithelial morphometry, suggesting that as more mucus is secreted into the lumen, the thinner the epithelial layer becomes. This finding is compatible with our hypothesis that as mucus secretion increases, the degree of histochemically detectable mucous metaplasia decreases due to release of intracellular mucin stores.
We recognize that several limitations exist. First, the number of samples, although providing preliminary data, is prohibitively small to draw definitive conclusions. Second, multiple uncontrolled variables may have caused inconsistency in the results. For example, flushing the specimens with formalin prior to fixation may have dislodged intralumenal mucus. The historical use of systemic or inhaled steroids may have modified the magnitude of airway inflammation and epithelial mucus. In addition, 25% of patients with GOLD 0 through 2 disease actively smoked at the time of surgery, which may have altered both epithelial mucin content and inflammation of the small airways. Third, the clinical data regarding the presence of chronic bronchitic symptoms are unfortunately incomplete for this patient cohort. Finally, it is assumed that the airway pathology in the surgical lung specimen represents the entire lung. This remains an assumption that needs to be further explored.
In conclusion, this pilot study is the first to directly relate inflammation to small airway mucous metaplasia in COPD. We show that CD3+/CD8+ lymphocytic small airway inflammation correlates with mucous metaplasia, whereas macrophages, neutrophils, and eosinophils do not. This directly contrasts with asthma pathogenesis, where a Th2-type inflammatory process, but not lymphocytic inflammation per se, plays a key role in the development of mucous metaplasia. Epithelial mucin content correlates with thickness of the epithelial layer and likely worsens small airway obstruction by increasing epithelial thickness, leading to fixed airflow obstruction, heightened elastic recoil, and encroachment on airway lumen. Further study of the precise role of CD3+/CD8+ lymphocytes in the generation of mucous metaplasia should be performed to improve our understanding of their relationship.
This study was partially supported by the 2006 Richard L. Evans Foundation Faculty Development Research Award. We are indebted to Lihua Li and Ping Wang for their contributions to this study.
REFERENCES
- Saetta M, Turato G, Baraldo S, Zanin A, Braccioni F, Mapp C E, Maestrelli P, Cavallesco G, Papi A, Fabbri L M. Goblet cell hyperplasia and epithelial inflammation in peripheral airways of smokers with both symptoms of chronic bronchitis and chronic airflow limitation. Am J Respir Crit Care Med 2000; 161: 1016–1021
- Hogg J C, Chu F, Utokaparch S, Woods R, Elliott W M, Buzatu L, Cherniack R M, Rogers R M, Sciurba F C, Coxson H O, Pare P D. The nature of small-airway obstruction in chronic obstructive pulmonary disease. N Engl J Med 2004; 350: 2645–2653
- Baraldo S, Saetta M, Cosio M G. Pathophysiology of the small airways. Semin Respir Crit Care Med 2003; 24: 465–472
- Kim V, Criner G J, Abdallah H Y, Gaughan J P, Furukawa S, Solomides C C. Small airway morphometry and improvement in pulmonary function after lung volume reduction surgery. Am J Respir Crit Care Med 2005; 171: 40–47
- Vestbo J, Prescott E, Lange P. Association of chronic mucus hypersecretion with FEV1 decline and chronic obstructive pulmonary disease morbidity. Copenhagen City Heart Study Group. Am J Respir Crit Care Med 1996; 153: 1530–1535
- Lange P, Nyboe J, Appleyard M, Jensen G, Schnohr P. Relation of ventilatory impairment and of chronic mucus hypersecretion to mortality from obstructive lung disease and from all causes. Thorax 1990; 45: 579–585
- Miravitlles M, Guerrero T, Mayordomo C, Sanchez-Agudo L, Nicolau F, Segu J L. Factors associated with increased risk of exacerbation and hospital admission in a cohort of ambulatory COPD patients: a multiple logistic regression analysis. The EOLO Study Group. Respiration 2000; 67: 495–501
- Sciurba F, Martinez F J, Rogers R M, Make B, Criner G J, Cherniak R M, Patel S A, Chu F, Coxson H O, Sharafkhaneh A, Elliott W M, Luketich J D, Sin D D, Hogg J C. The effect of small airway pathology on survival following lung volume reduction surgery (LVRS). [abstract]. Proc Am Thorac Soc 2006; 3: A712
- Kim V, Kelemen S E, Abuel-Haija M, Swift A E, Li L, Vanguru I, Gaughan J P, Sharafkhaneh A, Rogers T J, Criner G J, Dickey B F. Small airway epithelial thickness correlates with mucous metaplasia and lymphocytic inflammation in COPD [abstract]. Am J Respir Crit Care Med 2007; 175: A659
- National Heart Lung and Blood Institute, National Institutes of Health. Global Initiative for Chronic Obstructive Lung Disease (GOLD) Guidelines, Global Strategy for the Diagnosis, Management and Prevention of Chronic Obstructive Lung Disease: NHLMI/WHO Workshop Report, NIH publication 2701 www.goldcopd.com 2001
- Evans C M, Williams O W, Tuvim M J, Nigam R, Mixides G P, Blackburn M R, DeMayo F J, Burns A R, Smith C, Reynolds S D, Stripp B R, Dickey B F. Mucin is produced by clara cells in the proximal airways of antigen-challenged mice. Am J Respir Cell Mol Biol 2004; 31: 382–394
- Rasband W S, Image J. 1997, http://rsb.info.nih.gov/ij/
- Harkema J R, Plopper C G, Hyde D M, St George J A. Regional differences in quantities of histochemically detectable mucosubstances in nasal, paranasal, and nasopharyngeal epithelium of the bonnet monkey. J Histochem Cytochem 1987; 35: 279–286
- Weibel E R. Stereological Methods. Academic Press Inc. Ltd., London 1979
- Aikawa T, Shimura S, Sasaki H, Takishima T, Yaegashi H, Takahashi T. Morphometric analysis of intraluminal mucus in airways in chronic obstructive pulmonary disease. Am Rev Respir Dis 1989; 140: 477–482
- Deshmukh H S, Case L M, Wesselkamper S C, Borchers M T, Martin L D, Shertzer H G, Nadel J A, Leikauf G D. Metalloproteinases mediate mucin 5AC expression by epidermal growth factor receptor activation. Am J Respir Crit Care Med 2005; 171: 305–314
- Holtzman M J, Tyner J W, Kim E Y, Lo M S, Patel A C, Shornick L P, Agapov E, Zhang Y. Acute and chronic airway responses to viral infection: implications for asthma and chronic obstructive pulmonary disease. Proc Am Thorac Soc 2005; 2: 132–140
- Zhen G, Park S W, Nguyenvu L T, Rodriguez M W, Barbeau R, Paquet A C, Erle D J. IL-13 and epidermal growth factor receptor have critical but distinct roles in epithelial cell mucin production. Am J Respir Cell Mol Biol 2007; 36: 244–253
- Kheradmand F, Kiss A, Xu J, Lee S H, Kolattukudy P E, Corry D B. A protease-activated pathway underlying Th cell type 2 activation and allergic lung disease. J Immunol 2002; 169: 5904–5911
- Mattoli S, Kleimberg J, Stacey M A, Bellini A, Sun G, Marini M. The role of CD8+ Th2 lymphocytes in the development of smoking-related lung damage. Biochem Biophys Res Commun 1997; 239: 146–149
- Miotto D, Ruggieri M P, Boschetto P, Cavallesco G, Papi A, Bononi I, Piola C, Murer B, Fabbri L M, Mapp C E. Interleukin-13 and -4 expression in the central airways of smokers with chronic bronchitis. Eur RespirJ 2003; 22: 602–608
- Majori M, Corradi M, Caminati A, Cacciani G, Bertacco S, Pesci A. Predominant TH1 cytokine pattern in peripheral blood from subjects with chronic obstructive pulmonary disease. J Allergy Clin Immunol 1999; 103: 458–462
- Grumelli S, Corry D B, Song L Z, Song L, Green L, Huh J, Hacken J, Espada R, Bag R, Lewis D E, Kheradmand F. An immune basis for lung parenchymal destruction in chronic obstructive pulmonary disease and emphysema. PLoS Med 2004; 1: e8
- O'Donnell R, Breen D, Wilson S, Djukanovic R. Inflammatory cells in the airways in COPD. Thorax 2006; 61: 448–454
- Retamales I, Elliott W M, Meshi B, Coxson H O, Pare P D, Sciurba F C, Rogers R M, Hayashi S, Hogg J C. Amplification of inflammation in emphysema and its association with latent adenoviral infection. Am J Respir Crit Care Med 2001; 164: 469–473
- Barcelo B, Pons J, Fuster A, Sauleda J, Noguera A, Ferrer J M, Agusti A G. Intracellular cytokine profile of T lymphocytes in patients with chronic obstructive pulmonary disease. Clin Exp Immunol 2006; 145: 474–479
- Barczyk A, Pierzchala W, Kon O M, Cosio B, Adcock I M, Barnes P J. Cytokine production by bronchoalveolar lavage T lymphocytes in chronic obstructive pulmonary disease. J Allergy Clin Immunol 2006; 117: 1484–1492
- Williams O W, Sharafkhaneh A, Kim V, Dickey B F, Evans C M. Airway mucus: From production to secretion. Am J Respir Cell Mol Biol 2006; 34: 527–536
- Di Stefano A, Capelli A, Lusuardi M, Balbo P, Vecchio C, Maestrelli P, Mapp C E, Fabbri L M, Donner C F, Saetta M. Severity of airflow limitation is associated with severity of airway inflammation in smokers. Am J Respir Crit Care Med 1998; 158: 1277–1285
- Turato G, Zuin R, Miniati M, Baraldo S, Rea F, Beghe B, Monti S, Formichi B, Boschetto P, Harari S, Papi A, Maestrelli P, Fabbri L M, Saetta M. Airway inflammation in severe chronic obstructive pulmonary disease: relationship with lung function and radiologic emphysema. Am J Respir Crit Care Med 2002; 166: 105–110
- Saetta M, Turato G, Facchini F M, Corbino L, Lucchini R E, Casoni G, Maestrelli P, Mapp C E, Ciaccia A, Fabbri L M. Inflammatory cells in the bronchial glands of smokers with chronic bronchitis. Am J Respir Crit Care Med 1997; 156: 1633–1639
- Selby C, MacNee W. Factors affecting neutrophil transit during acute pulmonary inflammation: minireview. Exp Lung Res 1993; 19: 407–428
- Turato G, Zuin R, Saetta M. Pathogenesis and pathology of COPD. Respiration 2001; 68: 117–128