
Article title: “Grading Severity of Productive Cough Based on Symptoms and Airflow Obstruction”
Authors: R. Vazquez Guillamet, H. Petersen, P. Meek, A. Sood, and Y. Tesfaigzi
Journal: Journal of Chronic Obstructive Pulmonary Disease
Bibliometrics: Volume 15, Number 2, pages 206–213
DOI: 10.1080/15412555.2018.1458218
When the article was first published:
and in the main article have been mistakenly substituted for figures e1 and e2 (STROBE diagrams) from the online supplement
Figure 1a. Transition probability matrix in the Lovelace Smokers Cohort – included in the longitudinal analysis was the ‘Cough only’ and ‘Fixed airflow obstruction only’ states which were not included in the cross-sectional analysis. (n = 1710).
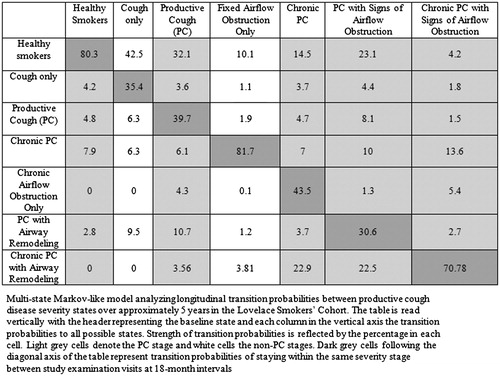
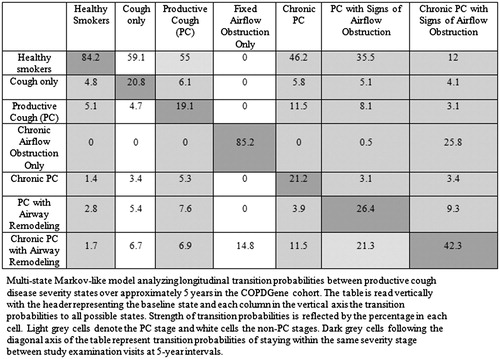
Figure 1b. Transition probabilities in the COPDGene Cohort – included in the longitudinal analysis were the ‘Cough only’ and ‘Fixed airflow obstruction only’ state which were not included in the cross-sectional analysis. (n = 2761).
has been substituted for figure e3 from the online data supplement.
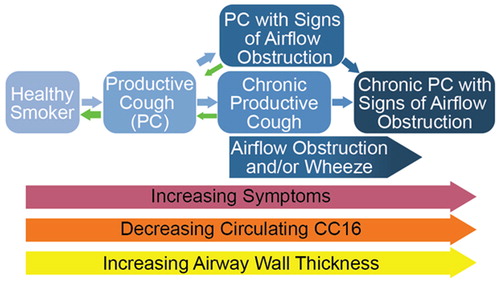
Figure 2. Schematic overview of PC by severity and the associated symptoms, circulating CC16 levels, and airway wall thickness. Note that transition to a healthier state drops once the most severe state is reached.
The correct figures can be found below:
This article is available both online and in print. The online version has been corrected.