
 ?Mathematical formulae have been encoded as MathML and are displayed in this HTML version using MathJax in order to improve their display. Uncheck the box to turn MathJax off. This feature requires Javascript. Click on a formula to zoom.
Abstract
The assessment of the work of breathing (WOB) of patients with acute exacerbations of chronic obstructive pulmonary disease (COPD) is difficult, particularly when the patient first presents with acute hypercapnia and respiratory acidosis. Acute exacerbations of COPD patients are in significant respiratory distress and noninvasive measurements of WOB are easier for the patient to tolerate. Given the interest in using alternative therapies to noninvasive ventilation, such as high flow nasal oxygen therapy or extracorporeal carbon dioxide removal, understanding the physiological changes are key and this includes assessment of WOB. This narrative review considers the role of three different methods of assessing WOB in patients with acute exacerbations of COPD. Esophageal pressure is a very well validated measure of WOB, however the ability of patients with acute exacerbations of COPD to tolerate esophageal tubes is poor. Noninvasive alternative measurements include parasternal electromyography (EMG) and electrical impedance tomography (EIT). EMG is easily applied and is a well validated measure of neural drive but is more likely to be degraded by the electrical environment in intensive care or high dependency. EIT is less well validated as a tool for WOB in COPD but extremely well tolerated by patients. Each of the different methods assess WOB in a different way and have different advantages and disadvantages. For research into therapies treating acute exacerbations of COPD, combinations of EIT, EMG and esophageal pressure are likely to be better than only one of these.
Introduction
Chronic obstructive pulmonary disease (COPD) is a spectrum of lung abnormalities characterized physiologically by persistent (i.e. not fully reversible) airflow obstruction. COPD is a common condition in the UK community and its exacerbations a major cause of hospitalization, often within a critical care environment [Citation1–4], healthcare costs and death. Exacerbations are defined as an acute event characterized by a worsening of the patient’s dyspnea, cough and/or sputum production beyond day-to-day variations [Citation5]. The standard management of COPD exacerbations consists of bronchodilator therapy (short-acting beta-2 agonists in combination with short-acting anticholinergics) [Citation5, Citation6], oral and/or inhaled corticosteroids [Citation7–11], antibiotics [Citation12] and supplemental oxygen [Citation13]. The available evidence supports patients with acute decompensated respiratory acidosis receiving noninvasive ventilation (NIV) [Citation14–17]. NIV reduces the risk of death (RR 0.54; 95% confidence interval (CI) 0.38–0.78; NNT 12), need for intubation (RR 0.36; 95% CI 0.28–0.46; NNT 5). However, approximately 15–30% of patients fail therapy with NIV and may be considered for intubation and mechanical ventilation [Citation18–20]. NIV failures can be immediate (usually secondary to device intolerance, secretions, coma), or late (commonly due to inability to correct acidosis, or disease severity, functional limitations or high work of breathing (WOB) [Citation20–24]. NIV failures Recent data suggest a possible benefit using extra-corporeal CO2 removal (ECCO2R), in relieving WOB and preventing intubation. Although this benefit is yet to be confirmed with prospective work [Citation25, Citation26]. The focus of this review will be on WOB in AECOPD and its assessment for both clinical and research applications.
Lung mechanics and exacerbations of COPD
Expiratory flow limitation occurs when expiratory flow at any given lung volume cannot be further increased by increasing expiratory muscles effort (i.e. by increasing pleural and alveolar pressure). In this case, expiratory flow rates may be increased only at greater operating lung volumes, (i.e. the end-expiratory lung volume (EELV) increases towards total lung capacity) [Citation27]. During an exacerbation of COPD, in addition to the airway collapsibility, there is a further increase in airway resistance due to the presence of secretions, airway edema and bronchospasm. An increase in resistance for a given elastance of the lung, increases the time constant for lung emptying (the product of compliance and resistance in each individual lung units). As the expiratory time-constant increases, the time necessary for the lung to reach the relaxation volume increases and therefore the EELV increases (i.e. dynamic hyperinflation) for the same respiratory rate and tidal volume. Although increased lung volumes can improve expiratory flow, dynamic hyperinflation is a costly compensatory mechanism as it leads to a reduction in inspiratory capacity, worsening energetics of the inspiratory and expiratory muscles and overall increases WOB. The additional effects of WOB in turn results in increased anxiety and tachypnea further exacerbating dynamic hyperinflation [Citation27–30]. More specifically, dynamic hyperinflation and expiratory flow limitation causes a progressive rise in EELV resulting in increasing intrinsic positive end-expiratory pressure (PEEP) ( and ), descent of the diaphragm and outward expansion of the chest leading to a significant mechanical disadvantage by shortening the muscles of respiration [Citation31, Citation32]. This leads to a significant increase in inspiratory muscle load, which can exceed the functional capacity of the muscles of respiration leading to respiratory failure and hypercapnia [Citation33, Citation34]. At this point, a vicious cycle of increasing respiratory drive develops with progressive neuromechanical dissociation, subjective dyspnea, increasing tachypnea and anxiety further increasing the mechanical load [Citation35–39]. Finally, the effects of dynamic hyperinflation on the right ventricle and right ventricular afterload (function of pulmonary artery pressure and changes in pleural pressure). This can cause a reduction in cardiac output and therefore oxygen delivery, which further affects arterial oxygenation (increase in venous admixture) and worsen muscle energetics and fatigue.
Figure 1. Patient with chronic obstructive airway disease (COPD) and airflow limitation. The flow and capnography waveform show persistent flow at the end of expiration.
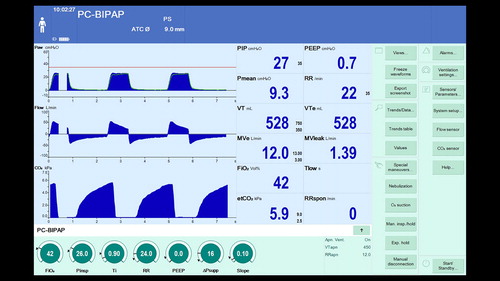
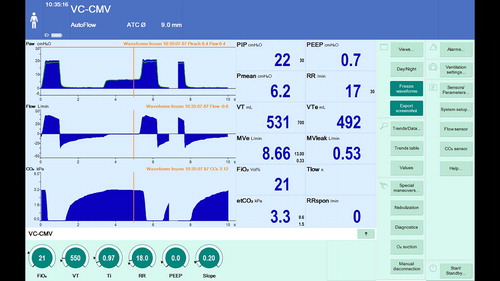
Figure 2. Measurement of intrinsic PEEP using an expiratory hold maneuver. It is possible to see that at set PEEP of zero the airway pressure at zero flow is 6.4 cm H2O indicating intrinsic PEEP.
Noninvasive ventilation (NIV) provides both an inspiratory pressure that unloads respiratory muscles and increases alveolar ventilation; end-expiratory pressure, which by opposing intrinsic PEEP, prevents airway collapse airways and relieves airflow limitation. This enables an improved ventilation:perfusion relationship and gas exchange and simultaneously reduces oxygen consumption and carbon dioxide production because of the reduction in work of the respiratory muscles [Citation17, Citation40]. Key to understanding the benefits of NIV, as well as some of the novel approaches to AECOPD, including ECCO2R are understanding methods to assess WOB.
Tools to assess WOB
Esophageal pressure measurement
Background
The compliance of the lung is defined as the change in volume for a change in transmural pressure (transmural pressure is alveolar minus pleural pressure) [Citation41, Citation42]. Compliance varies with lung volume, pulmonary blood volume, bronchial smooth muscle tone, age and disease. Respiratory system elastance is the reciprocal of compliance and is the sum of the elastic recoil in the chest wall and in the lung parenchyma [Citation41, Citation42]. Key contributors to the elastic recoil of the lung are the elastic tissue and the surface tension within the alveoli. Elastance of the respiratory system is not constant through the respiratory cycle leading to hysteresis between inspiration and expiration. Causes of hysteresis include changes in surface tension due to surfactant, stress relaxation, closure of alveoli at low lung volumes and redistribution of gas between alveoli of different time constants [Citation41, Citation42]. Resistance is the impediment to flow through the airways due to friction [Citation41, Citation42]. Within the airways diameter and laminar flow are the key elements which determine resistance.
Esophageal pressure (PES) may be measured using an inflated balloon placed in the lower esophagus and attached to an air-filled pressure transducer. The changes in PES with respiration are concordant with the changes in pleural pressure (PPL) [Citation43–45]. The absolute value of PES, reflects the mean pressure in the mid-dorsal regions of the lung, but does not reflect the regional elastic recoil of the lung, as it is impacted by lung volume, position, body habitus, esophageal muscle tone, chest wall distortion and intrathoracic pathology [Citation44–49]. However, the difference between PES and PAW is a reasonable estimate of transpulmonary pressure (PL) in the region surrounding the balloon [Citation44, Citation45, Citation47].
In patients receiving invasive mechanical ventilation, it is clear from the equation of motion that part of the pressure change in the lung is from the ventilator (PAW) and part from the patient’s respiratory muscles (PMUS) [Citation44, Citation45]. In spontaneously breathing patients with COPD receiving noninvasive mechanical ventilation however, the pressure exerted by the muscles is such that WOB will affect the pleural pressure more due to the low elastance of the lung. The work performed by the respiratory muscles can be measured calculating WOB [Citation43, Citation47, Citation50]. Work can be described by integrating the change in volume multiplied by the change in pressure over time and measured in Joules per minute (J/minutes) if the respiratory rate is known [Citation47, Citation50]. The relationship between pressure due to the respiratory muscles and volume is also described by Campbell’s diagram [Citation50, Citation51]. Campbell’s diagram is a graphical analysis of the esophageal pressure against tidal volume over the respiratory cycle. It separates work into inspiratory, expiratory, resistive and elastic components [Citation50, Citation51]. Respiratory muscle work can also be estimated using the pressure time product of the esophageal pressure (PTPES) [Citation43–45, Citation47, Citation52]. PTPES measures the activity related to all muscles of respiration (diaphragm and intercostal muscles). If gastric pressure is also measured, then a pressure time product of the gastric pressure can be calculated which relates to diaphragmatic activity [Citation52]. PTPES is the integral of pressure over time and is the product of the change in pressure multiplied by the duration of the contraction [Citation43–45, Citation47, Citation52]. The particular advantage of PTPES is that it provides an estimate of activity regardless of whether or not a volume is generated. PTPES is measured in cm H2O.s [Citation52].
One of the key problems in COPD exacerbations is the development of dynamic hyperinflation and intrinsic PEEP. Esophageal pressure monitoring demonstrates the onset of respiratory muscle contraction prior to airflow commencing as intrinsic PEEP must be overcome first [Citation44, Citation46, Citation47, Citation53–56]. The use of PTPES allows estimation of the work undertaken during this isometric phase of contraction. Application of extrinsic PEEP can then be titrated to minimize WOB [Citation47, Citation56–58]. Active expiration is also able to be identified and its work quantified by an increase in the gastric pressure during the expiratory phase [Citation47, Citation56]. Measurement of PES is also useful to demonstrate the physiological changes to a wide variety of therapies in acute exacerbations of COPD [Citation59], when assessing the response to the application of high flow nasal cannulae [Citation60, Citation61], during the weaning phase [Citation62] and in optimization of mechanical ventilation for patients with chronic COPD [Citation63–66].
Measurement of PES allows identification of ventilator-patient dyssynchrony which may not be clinically apparent. It is possible using PES to identify when the patient is making ineffective efforts to trigger the ventilator by demonstration of negative PES without an associated breath, or to measure any delay between the onset of respiratory effort and ventilator triggering [Citation46]. PES also allows titration of the ventilator to reduce WOB and to assess the response to therapies [Citation46, Citation67]. It is also possible to demonstrate reverse triggering, where inflation by the mechanical ventilator results in triggering of the muscles of respiration causing an increase in oxygen consumption without patient benefit [Citation68].
It must also be appreciated that although PES is considered a valid measure of intrinsic PEEP, it is influenced by mediastinal weight, posture and reactivity of the esophageal smooth muscle as well as the material from which the balloon is made [Citation47, Citation48]. These factors are difficult to control for in the acute setting and posture in particular can be difficult to maintain between different measurements in the course of an acute exacerbation, this is particularly important as it is known that in the supine position the esophageal pressure exceeds the pleural pressure by approximately 3 cm H2O [Citation69]. One particular concern in exacerbations of COPD is the activation of expiratory muscles, especially abdominal muscles leading to an increase in pleural pressure transmitted across the diaphragm [Citation40, Citation47, Citation48, Citation53, Citation70–72].
Method
Esophageal pressure measurements require the passage of a catheter with a balloon trans-nasally into the lower esophagus [Citation43, Citation46, Citation47, Citation73]. Key contraindications include nasal or esophageal pathology which preclude esophageal intubation. Once in place, the balloon has 0.5–1.5 mL of air-based on the compliance characteristics of each balloon – instilled to allow optimal transmission of the pressure waveform. It is important to validate the position of the balloon using a dynamic occlusion test in the spontaneously breathing patient [Citation43, Citation46, Citation47, Citation73, Citation74]. In this test, the patient breathes in against a closed inspiratory valve resulting in no airflow, and the ratio of the change in esophageal pressure to change in airway pressure is assessed. A ratio approaching 1 (0.8–1.2) is considered to indicate appropriate placement [Citation74]. The catheter is then attached to a pressure transducer to obtain the measurements and simultaneous pneumotachograph recordings are made. All signals are collected using an analog-to-digital converter and then analyzed using commercially available software to calculate WOB, PTPES and Campbell’s diagrams [Citation75].
Parasternal EMG
Background
COPD is characterized by expiratory flow limitation [Citation27] resulting in increased EELV and dynamic hyperinflation. During an exacerbation there is an increase in airways resistance, worsening expiratory flow limitation, increase in EELV and reduction in diaphragmatic function [Citation31, Citation32]. Together these result in a progressive increase in the subjective WOB, anxiety and tachypnea further exacerbating dynamic hyperinflation [Citation27–30]. It has been demonstrated that patients with COPD have a high neural respiratory drive, which is worsened during an exacerbation [Citation76–78].
The medulla co-ordinates both the voluntary and involuntary demands upon the respiratory system to generate of the respiratory pattern with separate groups of neurones controlling inspiratory and expiratory muscle function [Citation41]. The medulla is subject to influences from the pons, from chemoreceptors sensitive to arterial partial pressures of oxygen, carbon dioxide and pH. It is also sensitive to input from the frontal cortex where anxiety causes a marked change in respiratory pattern [Citation79–82]. Neural feedback loops include slowly and rapidly adapting stretch receptors within the airways smooth muscle and mucosa, respectively, as well as peripheral afferent feedback from muscle receptors [Citation83, Citation84]. The outflow from the medulla results in the neural respiratory drive and as the load on the respiratory system increases, neural respiratory drive also increases [Citation39, Citation76, Citation85–89].
In humans, the brainstem respiratory center cannot be directly measured (i.e. central neural drive), however the neural signal to the muscles of respiration can be measured either at the level of the diaphragm or at the level of the parasternal intercostal muscles [Citation39, Citation77, Citation90, Citation91]. The diaphragmatic electromyogram (EMG) can be recorded using a multipair electrode catheter placed via the esophagus and is a well-validated measure of neural respiratory drive in COPD [Citation38, Citation39, Citation87, Citation92–95]. However, diaphragmatic measurements are invasive [Citation86, Citation95, Citation96]. The parasternal intercostal muscles have a much smaller bulk than the diaphragm but are activated simultaneously [Citation97–99]. Surface electrodes measuring EMG over the parasternal muscles is thus an alternative [Citation100, Citation101]. Parasternal EMG has been demonstrated to be a reproducible and well tolerated technique to assess neural respiratory drive [Citation88, Citation102–107], particularly for patients with an exacerbation of COPD [Citation77, Citation78]}.
The raw EMG signal depends on the size, type, depth of the muscle as well as the quality of the signal measured. The signal requires processing in order to allow physiologically meaningful comparisons. The root mean square quantifies the intensity and duration of the contraction and has been shown to be linearly associated with increasing load on the muscle [Citation108, Citation109]. The root mean square of the parasternal EMG has been shown to have a high degree of correlation with the trans-esophageal diaphragmatic EMG [Citation110]. Additional measures to quantify the neural respiratory drive are the percentage of the EMG signal of the maximum EMG signal obtained (EMGpara%max) and the neural respiratory drive index (NRDI) [Citation77]. The NRDI is the product of EMGpara%max and the respiratory rate [Citation77]. NRDI is a validated measure of WOB during an acute exacerbation and allows changes in WOB over time to be documented [Citation77, Citation78].
Method
The acquisition of surface EMG can be problematic. The signal quality will depend upon quality of electrode contact with the skin, interference from other physiological electrical activity and from external electrical sources. The frequencies of the ECG and EMG overlap and consequently the ECG signal cannot be completely removed, however high-pass filtering at 20 Hz does reduce ECG artifact [Citation95]. Other voluntary and involuntary muscle activity from adjacent muscles can also cause interference [Citation111]. It is important to have the subject at rest with head, torso and arms appropriately supported. Electrical artifacts are common within critical care, although many of the actively transmitting devices have frequencies in the MHz-GHz range [Citation112], however power line artifact occurs at 50 Hz and can cause significant noise if cables are not shielded [Citation95].
Wet gel electrodes are placed in the second intercostal space on either side of the sternum and connected via standard ECG leads to a high differential amplifier with band pass filters set at 10 Hz and 2,000 Hz with an analog 50 Hz notch filter and then converted to digital signals. It is important that the patient is relaxed and using minimal non-respiratory muscle effort aiming for a baseline signal of approximately 10microvolts. It is important to ensure that subjects take a maximal inspiratory breath to calibrate the inspiratory effort. Data analysis is ideally described as a root mean square of the EMG signal (RMS EMGpara) [Citation77, Citation78]. The maximum RMS EMGpara value can be determined to measure RMS EMGpara peak and a mean RMS EMGpara per breath over 1 minute can then then calculated. The NRDI is then is calculated by multiplying the RMS EMGpara%max by respiratory rate.
Electrical impedance tomography
Background
Electrical impedance tomography (EIT) is a noninvasive, bedside monitoring technique that provides semi-continuous, real-time information about the regional distribution of the changes in electrical resistivity of the lung tissue due to variations in ventilation [Citation113–115]. EIT is obtained by repeatedly injecting small alternating electric currents (usually 5 mA) at high frequency of 50–80 kHz through a system of 16 skin electrodes applied circumferentially around the thorax in a single plane between the fourth and sixth intercostal space [Citation116, Citation117]. While an adjacent pair of electrodes ‘injects’ the current, the remaining passive electrode pairs measure the differences in electric potential. An impedance image is then reconstructed from this data by a mathematical algorithm using a two-dimensional model and a simplified shape to represent the thoracic cross-section [113–115]. The resulting image possesses a high temporal and functional resolution making it possible to monitor changes in regional inflation or on a breath by breath basis, thus providing quantitative data on changes in lung volume as well as its regional distribution of these changes. Several studies have validated EIT against other methods that measure global lung volume (e.g. nitrogen wash-out/wash-in) or regional lung volume (e.g. PET, SPECT, CT) [Citation118–123] and changes in end-expiratory lung impedance correlate with changes in EELV [Citation124–126]. EIT can also be used to demonstrate regional differences during the inflation or deflation of lung units. This allows the measurement and comparison of the level of inhomogeneity between the different regions. This in turn can be used to calculate the ‘global inhomogeneity index’ – the normalized sum of differences between the median value of regional impedance changes from the tidal image and the value of every pixel [Citation127, Citation128] and also to construct maps of regional delays in ventilation that correlate with lung inhomogeneity [Citation129, Citation130]. Given that COPD is known to have significant spatial and temporal heterogeneity of ventilation and EIT is noninvasive, simple to apply and portable, it is particularly suitable for the analysis of AECOPD to assess response to therapy, especially given the ability to measure dynamic changes in EELV.
Information derived from EIT indices correlates well with traditional pulmonary function tests of COPD patients (e.g. FEV1 or FVC) [Citation131]. The EIT signal can be converted to lung volumes in COPD, using a correction factor (EquationEquation 1(1)
(1) ) derived from the transfer of carbon monoxide. The global inhomogeneity index is also significantly increased in patients with COPD compared with those without underlying respiratory disease and can differentiate those with COPD who do and who do not respond to bronchodilator therapy [Citation132–134].
(1)
(1)
Correction factor for the association of carbon monoxide transfer and EIT to convert EIT signals into volume in males. KCO is the carbon monoxide transfer coefficient [Citation131].
The prolongation of the expiratory phase in COPD results in the development of dynamic hyperinflation and auto-PEEP. For patients who require noninvasive or invasive mechanical ventilation, the application of extrinsic PEEP may either improve or worsen dynamic hyperinflation depending on how well extrinsic and intrinsic PEEP are matched [Citation135, Citation136]. The consequences of increasing dynamic hyperinflation for patients is significant leading to hemodynamic compromise, increased WOB and ventilator asynchrony [Citation135, Citation136]. In patients with COPD, EIT can be used to match extrinsic and intrinsic PEEP to reduce dynamic hyperinflation and optimize mechanical ventilation [Citation137, Citation138]. One potential research tool to optimize ventilation and hyperinflation using EIT is the development of expiratory time constants [Citation139, Citation140]. Lung regions may be modeled as compartments with variations in compliance and resistance [Citation141]. If there is a change in PEEP during expiration (without spontaneous respiration) the changing volume of air within regions can be calculated. Given that it is known that some of the benefit of NIV in acute exacerbations of COPD is reduce respiratory muscle work due to the matching of extrinsic with intrinsic PEEP thereby improving dynamic hyperinflation and ventilation inhomogeneity [Citation17, Citation40], this approach may allow the development of regional expiratory time constant maps which in turn may allow optimization of therapies directed towards improved homogeneity.
Method
There are very few absolute contraindications to EIT, other than the presence of a pacemaker/implantable cardiac defibrillator. EIT is performed using one of several proprietary devices available on the market. An electrode band is placed around the chest and contact is optimized with saline or an electrode gel. Real time analog waveform outputs from the electrodes is then fed to a data acquisition system. Data is analyzed after processing using custom-made software in accordance with the method described by the “Translational EIT development (TREND) study group” [Citation116]. Five key stages of analysis are undertaken: (1) acquisition of EIT measurements, (2) generation of raw EIT images, (3) EIT waveforms and regions of interest (ROI), (4) functional EIT images and (5) EIT measures [Citation116].
Each EIT image shows the electrical tissue conductivity in a vertical slice roughly half the chest width [Citation142]. The conductivity changes as the volume of air, blood or tissue within the field of view of the device changes. The raw data consists of voltage differences measured over time and this needs to be reconstructed into a two-dimensional image through the plane of the electrodes [Citation143]. Images are generated through by comparing tissue properties in the current frame with the baseline frame using the GREIT image reconstruction algorithm, giving a time-difference EIT image [Citation116, Citation144]. The scale ranges from black (no change) through blue then white with increasing impedance and to purple with decrease in impedance [Citation116].
EIT waveforms are the changes of impedance over time and are generated from raw EIT images [Citation145]. EIT images of the chest demonstrate changes in impedance in all the tissue under the electrodes, consequently there are a number of potential sources of changes in impedance which do not relate to the lungs, including artifact from cardiac movement and changes in pulmonary perfusion. Although these physiological events cause a significantly smaller change in impedance than that due to ventilation, they do reduce signal quality and as they occur at a frequency significantly different to respiration and can be filtered out using digital frequency filtering [Citation116]. Additional sources of noise include movement, loss of signal quality and interference from other electrical devices, particularly in the intensive care [Citation146]. To improve the analysis of the impedance changes within the lung, smaller ROI are usually identified [Citation116, Citation147, Citation148]. The use of ROIs allows exclusion of non-pulmonary tissue and to allow comparison of different lung regions to demonstrate spatial heterogeneity [Citation145, Citation149]. ROIs in the four quadrants of the lung between left dorsal and ventral, and right dorsal and ventral will be used to allow comparison between left and right dorsal and ventral lung regions to identify spatial heterogeneity and differences in expiratory time constants.
Functional EIT images are generated from the raw images and the waveforms using mathematical algorithms to generate physiologically relevant data. Data can then be displayed to visually demonstrate changes in tidal volume, EELV, spatial distribution of gas and respiratory time constants [Citation150–153]. The data can also be combined with other measurements for example airway pressure to generate system compliance [Citation154–156].
There are several useful functional EIT images in COPD. The first is the spatial distribution of ventilation within the lung. This can be shown through the use of normalized tidal variation images where each pixel is displayed as a fraction of the overall tidal volume [Citation116]. Volume difference function EIT images can demonstrate changes in EELV if measured at the end of expiration [Citation157]. This allows within patient differences in EELV to be measured over time. Ventilation delay can be demonstrated by measuring the impedance of different pixels at different time points during inspiration and an image created [Citation130]. Similarly expiratory delay and expiratory time constants () can be demonstrated by measuring regional impedance at different time-points during expiration [Citation133, Citation134, Citation139, Citation158].
Figure 3. Analysis of distribution of time constants in patient with severe COPD. Distribution of time constants is seen in a 2-D image (A) and distribution of pixels with different time constants at different PEEP levels (B). Adapted from [Citation158]. Reproduced with permission under the Creative Commons license (http://creativecommons.org/publicdomain/zero/1.0/).
![Figure 3. Analysis of distribution of time constants in patient with severe COPD. Distribution of time constants is seen in a 2-D image (A) and distribution of pixels with different time constants at different PEEP levels (B). Adapted from [Citation158]. Reproduced with permission under the Creative Commons license (http://creativecommons.org/publicdomain/zero/1.0/).](/cms/asset/ad5625e0-eca9-436a-b474-8a248dfc0b9b/icop_a_1681390_f0003_c.jpg)
Functional EIT images display the changes within the lung regions, while EIT measures provide numerical descriptions of impedance changes over time. There are several groups of EIT measures. The first are the average of the ROI examined in the functional image to quantify elements such as EELV. The second are descriptors of the spatial distribution of ventilation including the global inhomogeneity index [Citation127, Citation147, Citation159, Citation160] and the coefficient of variation [Citation133, Citation147, Citation161]. The impedance changes in different ROIs can also be compared. Additionally the heterogeneity of ventilation can be quantified measuring regional respiratory time constants [Citation152, Citation153], phase shifts in regional ventilation [Citation162], the ventilation delay index [Citation129] and heterogeneity of expiratory times [Citation133, Citation134, Citation163].
Summary
These three methods can be used to give a measurement of WOB in 3 separate ways. Acute exacerbations of COPD patients are in significant respiratory distress and noninvasive measurements of WOB are easier for the patient to tolerate. Both EMG and EIT are noninvasive and can usually be managed by any patient regardless of the level of respiratory failure. EMG however is more likely to be degraded by the electrical environment in intensive care or high dependency. Esophageal pressure is a very well validated measure of WOB, however the ability of patients with exacerbations of COPD to tolerate esophageal tubes is poor. Consequently for research into therapies treating acute exacerbations of COPD, combinations of EIT, EMG and esophageal pressure are likely to be better than only one of these, although this requires prospective validation.
Declaration of interest
The authors declare no competing personal financial interest.
Author’s contributions
All authors reviewed and edited the final manuscript.
Acknowledgments
The authors are very grateful for the assistance of the clinical team within the ICU at Guy’s and St Thomas’ NHS Foundation Trust.
References
- Spencer S, Calverley PM, Burge PS. Impact of preventing exacerbations on deterioration of health status in COPD. Eur Respir J. 2004;23(5):698–702. doi:10.1183/09031936.04.00121404.
- Kessler R, Stahl E, Vogelmeier C, et al. Patient understanding, detection, and experience of COPD exacerbations: an observational, interview-based study. Chest. 2006;130(1):133–142. doi:10.1378/chest.130.1.133.
- Garcia-Aymerich J, Farrero E, Felez MA, et al. Risk factors of readmission to hospital for a COPD exacerbation: a prospective study. Thorax. 2003; 58(2):100–105. doi:10.1136/thorax.58.2.100.
- Anzueto A. Impact of exacerbations on COPD. Eur Respir Rev. 2010;19(116):113–118. doi:10.1183/09059180.00002610.
- Vestbo J, Hurd SS, Agusti AG, et al. Global strategy for the diagnosis, management, and prevention of chronic obstructive pulmonary disease: GOLD executive summary. Am J Respir Crit Care Med. 2013;187(4):347–365. 15doi:10.1164/rccm.201204-0596PP.
- Celli BR, MacNee W, Agusti A, et al. Standards for the diagnosis and treatment of patients with COPD: a summary of the ATS/ERS position paper. Eur Respir J. 2004; 23(6):932–946. doi:10.1183/09031936.04.00014304.
- Davies L, Angus RM, Calverley PM. Oral corticosteroids in patients admitted to hospital with exacerbations of chronic obstructive pulmonary disease: a prospective randomised controlled trial. Lancet (London, England). 1999; 7354(9177):456–460. doi:10.1016/S0140-6736(98)11326-0.
- Maltais F, Ostinelli J, Bourbeau J, et al. Comparison of nebulized budesonide and oral prednisolone with placebo in the treatment of acute exacerbations of chronic obstructive pulmonary disease: a randomized controlled trial. Am J Respir Crit Care Med. 2002;165(5):698–703. doi:10.1164/ajrccm.165.5.2109093.
- Niewoehner DE. Oral prednisolone was not inferior to intravenous prednisolone for treatment failure in chronic obstructive pulmonary disease exacerbation. Evid Based Med. 2008; 13(5):145. doi:10.1136/ebm.13.5.145.
- Niewoehner DE, Erbland ML, Deupree RH, et al. Effect of systemic glucocorticoids on exacerbations of chronic obstructive pulmonary disease. Department of Veterans Affairs Cooperative Study Group. N Engl J Med. 1999;340(25):1941–1947. 24doi:10.1056/NEJM199906243402502.
- Thompson WH, Nielson CP, Carvalho P, et al. Controlled trial of oral prednisone in outpatients with acute COPD exacerbation. Am J Respir Crit Care Med. 1996; 154(2):407–412. doi:10.1164/ajrccm.154.2.8756814.
- Quon BS, Gan WQ, Sin DD. Contemporary management of acute exacerbations of COPD: a systematic review and metaanalysis. Chest. 2008; 133(3):756–766. doi:10.1378/chest.07-1207.
- Austin MA, Wills KE, Blizzard L, et al. Effect of high flow oxygen on mortality in chronic obstructive pulmonary disease patients in prehospital setting: randomised controlled trial. BMJ (Clinical Research ed). 2010;341(oct18 2):c5462. doi:10.1136/bmj.c5462.
- Brochard L, Mancebo J, Wysocki M, et al. Noninvasive ventilation for acute exacerbations of chronic obstructive pulmonary disease. N Engl J Med. 1995; 333(13):817–822. doi:10.1056/NEJM199509283331301.
- Lightowler JV, Wedzicha JA, Elliott MW, et al. Non-invasive positive pressure ventilation to treat respiratory failure resulting from exacerbations of chronic obstructive pulmonary disease: Cochrane systematic review and meta-analysis. BMJ (Clinical Research ed). 2003;326(7382):185. doi:10.1136/bmj.326.7382.185.
- Rochwerg B, Brochard L, Elliott MW, et al. Official ERS/ATS clinical practice guidelines: noninvasive ventilation for acute respiratory failure. Eur Respir J. 2017;50(2):1602426. doi:10.1183/13993003.02426-2016.
- Osadnik CR, Tee VS, Carson-Chahhoud KV, et al. Non-invasive ventilation for the management of acute hypercapnic respiratory failure due to exacerbation of chronic obstructive pulmonary disease. Cochrane Database Syst Rev. 2017;7(7):Cd004104.
- Demoule A, Girou E, Richard JC, et al. Increased use of noninvasive ventilation in French intensive care units. Intensive Care Med. 2006; 32(11):1747–1755. doi:10.1007/s00134-006-0229-z.
- Abroug F, Ouanes-Besbes L, Hammouda Z, et al. Noninvasive ventilation with helium-oxygen mixture in hypercapnic COPD exacerbation: aggregate meta-analysis of randomized controlled trials. Ann Intensive Care. 2017; 7(1):59.
- Ozsancak Ugurlu A, Habesoglu MA. Epidemiology of NIV for acute respiratory failure in COPD patients: results from the international surveys vs. the “real world”. COPD. 2017;14(4):429–438. doi:10.1080/15412555.2017.1336527.
- Contou D, Fragnoli C, Cordoba-Izquierdo A, et al. Noninvasive ventilation for acute hypercapnic respiratory failure: intubation rate in an experienced unit. Am J Respir Crit Care Med. 2013;58(12):2045–2052. doi:10.4187/respcare.02456.
- Carratu P, Bonfitto P, Dragonieri S, et al. Early and late failure of noninvasive ventilation in chronic obstructive pulmonary disease with acute exacerbation. Eur J Clin Invest. 2005;35(6):404–409. doi:10.1111/j.1365-2362.2005.01509.x.
- Kumar S, Khilnani GC, Banga A, et al. Predictors of requirement of mechanical ventilation in patients with chronic obstructive pulmonary disease with acute respiratory failure. Lung India. 2013; 30(3):178–182. doi:10.4103/0970-2113.116238.
- Confalonieri M, Garuti G, Cattaruzza MS, et al. A chart of failure risk for noninvasive ventilation in patients with COPD exacerbation. Eur Respir J. 2005; 25(2):348–355. doi:10.1183/09031936.05.00085304.
- Barrett NA, Camporota L. The evolving role and practical application of extracorporeal carbon dioxide removal in critical care. Critical care Resusc. 2017;19(Suppl 1):62–67.
- Moss CE, Galtrey EJ, Camporota L, et al. A retrospective observational case series of low-flow venovenous extracorporeal carbon dioxide removal use in patients with respiratory failure. ASAIO J (American Society for Artificial Internal Organs: 1992). 2016;62(4):458–462. doi:10.1097/MAT.0000000000000386.
- O'Donnell DE, Neder JA, Elbehairy AF. Physiological impairment in mild COPD. Respirology (Carlton, Vic). 2016;21(2):211–223. doi:10.1111/resp.12619.
- O’Donnell D, Webb K, et al. Chronic obstructive pulmonary disease In: Calverley P, MacNee W, Pride N, editors. Exercise. 2nd ed. London: Arnold; 2003. p. 243–269.
- Calverley P. Respiratory failure in chronic obstructive pulmonary disease. Eur Respir J. 2003;22(Supplement 47):26s–30S. doi:10.1183/09031936.03.00030103.
- O'Donnell D, Parker C. COPD exacerbations: pathophysiology. Thorax. 2006;61:354–361. doi:10.1136/thx.2005.041830.
- Orozco-Levi M, Lloreta J, Minguella J, et al. Injury of the human diaphragm associated with exertion and chronic obstructive pulmonary disease. Am J Respir Crit Care Med. 2001;164(9):1734–1739., doi:10.1164/ajrccm.164.9.2011150.
- Polkey MI, Kyroussis D, Hamnegard CH, et al. Diaphragm strength in chronic obstructive pulmonary disease. Am J Respir Crit Care Med. 1996;154(5):1310–1317., doi:10.1164/ajrccm.154.5.8912741.
- Haluszka J, Chartrand DA, Grassino AE, et al. Intrinsic PEEP and arterial PCO2 in stable patients with chronic obstructive pulmonary disease. Am Rev Respir Dis. 1990;141(5_pt_1):1194–1197. doi:10.1164/ajrccm/141.5_Pt_1.1194.
- Pare PD, Brooks LA, Bates J, et al. Exponential analysis of the lung pressure-volume curve as a predictor of pulmonary emphysema. Am Rev Respir Dis. 1982;126(1):54–61.,
- O’Donnell D, Revill S, Webb K. Dynamic hyperinflation and exercise intolerance in COPD. Am J Respir Crit Care Med. 2001;164:770–777. doi:10.1164/ajrccm.164.5.2012122.
- Chen Z, Eldridge F, Wagner P. Respiratory-associated thalamic activity is related to level of respiratory drive. Respir Physiol. 1992;90(1):99–113. doi:10.1016/0034-5687(92)90137-L.
- O’Donnell D, Chau L, Bertley J. Qualitative aspects of exertional breathlessness in chronic airflow limitation: pathophysiologic mechanisms. Am J Respir Crit Care Med. 1997;155:109–115. doi:10.1164/ajrccm.155.1.9001298.
- De Troyer A, Leeper JB, McKenzie DK, et al. Neural drive to the diaphragm in patients with severe COPD. Am J Respir Crit Care Med. 1997;155(4):1335–1340., doi:10.1164/ajrccm.155.4.9105076.
- Sinderby C, Spahija J, Beck J, et al. Diaphragm activation during exercise in chronic obstructive pulmonary disease. Am J Respir Crit Care Med. 2001;163(7):1637–1641., doi:10.1164/ajrccm.163.7.2007033.
- Appendini L, Patessio A, Zanaboni S, et al. Physiologic effects of positive end expiratory pressure and mask pressure support during exacerbations of chronic obstructive pulmonary disease. Am J Respir Crit Care Med. 1994;149(5):1069–1076. doi:10.1164/ajrccm.149.5.8173743.
- Lumb A. Nunn's Applied Respiratory Physiology. 8th ed. London: Elsevier; 2017.
- Lu Q, Rouby JJ. Measurement of pressure-volume curves in patients on mechanical ventilation: methods and significance. Crit Care. 2000;4(2):91–100.
- Benditt JO. Esophageal and gastric pressure measurements. Respir Care. 2005; 50(1):68–75. discussion 75–77.
- Bellani G, Pesenti A. Assessing effort and work of breathing. Curr Opin Crit Care. 2014; 20(3):352–358. doi:10.1097/MCC.0000000000000089.
- Hedenstierna G. Esophageal pressure: benefit and limitations. Minerva Anestesiol. 2012;78(8):959–966.
- Brochard L. Measurement of esophageal pressure at bedside: pros and cons. Curr Opin Crit Care. 2014; 20(1):39–46. doi:10.1097/MCC.0000000000000050.
- Akoumianaki E, Maggiore SM, Valenza F, et al. The application of esophageal pressure measurement in patients with respiratory failure. Am J Respir Crit Care Med. 2014; 1189(5):520–531. doi:10.1164/rccm.201312-2193CI.
- Pecchiari M, Loring SH, D’Angelo E. Esophageal pressure as an estimate of average pleural pressure with lung or chest distortion in rats. Respir Physiol Neurobiol. 2013;186(2):229–235. 1doi:10.1016/j.resp.2013.02.006.
- Krell WS, Rodarte JR. Effects of acute pleural effusion on respiratory system mechanics in dogs. J Appl Physiol. 1985; 59(5):1458–1463. doi:10.1152/jappl.1985.59.5.1458.
- Cabello B, Mancebo J. Work of breathing. Intensive Care Med. 2006; 32(9):1311–1314. doi:10.1007/s00134-006-0278-3.
- Campbell E. The respiratory muscles and the mechanics of breathing. Vol. 43. London: Lloyd-Luke; 1957. (2).
- Collett PW, Perry C, Engel LA. Pressure-time product, flow, and oxygen cost of resistive breathing in humans. J Appl Physiol. 1985; 58(4):1263–1272. doi:10.1152/jappl.1985.58.4.1263.
- Blanch L, Bernabe F, Lucangelo U. Measurement of air trapping, intrinsic positive end-expiratory pressure, and dynamic hyperinflation in mechanically ventilated patients. Respir Care. 2005;50(1):110–123. discussion 123–4.
- Purro A, Appendini L, Patessio A, et al. Static intrinsic PEEP in COPD patients during spontaneous breathing. Am J Respir Crit Care Med. 1998; 157(4):1044–1050. doi:10.1164/ajrccm.157.4.9702007.
- Ranieri VM, Mascia L, Petruzzelli V, et al. Inspiratory effort and measurement of dynamic intrinsic PEEP in COPD patients: effects of ventilator triggering systems. Intensive Care Med. 1995; 21(11):896–903. doi:10.1007/BF01712330.
- Brochard L. Intrinsic (or auto-) positive end-expiratory pressure during spontaneous or assisted ventilation. Intensive Care Med. 2002;28(11):1552–1554. doi:10.1007/s00134-002-1515-z.
- Goldberg P, Reissmann H, Maltais F, et al. Efficacy of noninvasive CPAP in COPD with acute respiratory failure. Eur Respir J. 1995;8(11):1894–1900. doi:10.1183/09031936.95.08111894.
- Annat GJ, Viale JP, Dereymez CP, et al. Oxygen cost of breathing and diaphragmatic pressure-time index. Measurement in patients with COPD during weaning with pressure support ventilation. Chest. 1990;98(2):411–414. doi:10.1378/chest.98.2.411.
- Ceriana P, Vitacca M, Carlucci A, et al. Changes of respiratory mechanics in COPD patients from stable state to acute exacerbations with respiratory failure. COPD. 2017; 14(2):150–155. doi:10.1080/15412555.2016.1254173.
- Mauri T, Alban L, Turrini C, et al. Optimum support by high-flow nasal cannula in acute hypoxemic respiratory failure: effects of increasing flow rates. Intensive Care Med. 2017;43(10):1453–1463. doi:10.1007/s00134-017-4890-1.
- Pisani L, Fasano L, Corcione N, et al. Change in pulmonary mechanics and the effect on breathing pattern of high flow oxygen therapy in stable hypercapnic COPD. Thorax. 2017;72(4):373–375. doi:10.1136/thoraxjnl-2016-209673.
- Ceriana P, Nava S, Vitacca M, et al. Noninvasive ventilation during weaning from prolonged mechanical ventilation. Pulmonology. 2019. doi:10.1016/j.pulmoe.2019.07.006.
- Vitacca M, Barbano L, D'Anna S, et al. Comparison of five bilevel pressure ventilators in patients with chronic ventilatory failure: a physiologic study. Chest. 2002; 22(6):2105–2114. doi:10.1378/chest.122.6.2105.
- Vitacca M, Bianchi L, Zanotti E, et al. Assessment of physiologic variables and subjective comfort under different levels of pressure support ventilation. Chest. 2004;126(3):851–859. doi:10.1378/chest.126.3.851.
- Vitacca M, Lanini B, Nava S, et al. Inspiratory muscle workload due to dynamic intrinsic PEEP in stable COPD patients: effects of two different settings of non-invasive pressure-support ventilation. Monaldi Arch Chest Dis. 2004;61(2):81–85. doi:10.4081/monaldi.2004.704.
- Vitacca M, Nava S, Confalonieri M, et al. The appropriate setting of noninvasive pressure support ventilation in stable COPD patients. Chest. 2000; 118(5):1286–1293. doi:10.1378/chest.118.5.1286.
- Mancebo J, Amaro P, Lorino H, et al. Effects of albuterol inhalation on the work of breathing during weaning from mechanical ventilation. Am Rev Respir Dis. 1991;144(1):95–100. doi:10.1164/ajrccm/144.1.95.
- Akoumianaki E, Lyazidi A, Rey N, et al. Mechanical ventilation-induced reverse-triggered breaths: a frequently unrecognized form of neuromechanical coupling. Chest. 2013;143(4):927–938. doi:10.1378/chest.12-1817.
- Washko GR, O'Donnell CR, Loring SH. Volume-related and volume-independent effects of posture on esophageal and transpulmonary pressures in healthy subjects. J Appl Physiol. 2006; 100(3):753–758. doi:10.1152/japplphysiol.00697.2005.
- Lessard MR, Lofaso F, Brochard L. Expiratory muscle activity increases intrinsic positive end-expiratory pressure independently of dynamic hyperinflation in mechanically ventilated patients. Am J Respir Crit Care Med. 1995;151(2):562–569. doi:10.1164/ajrccm.151.2.7842221.
- Ninane V. “Intrinsic” PEEP (PEEPi): role of expiratory muscles. Eur Respir J. 1997; 10(3):516–518.
- O'Donoghue FJ, Catcheside PG, Jordan AS, et al. Effect of CPAP on intrinsic PEEP, inspiratory effort, and lung volume in severe stable COPD. Thorax. 2002;57(6):533–539. doi:10.1136/thorax.57.6.533.
- Sahetya SK, Brower RG. The promises and problems of transpulmonary pressure measurements in acute respiratory distress syndrome. Curr Opin Crit Care. 2016; 22(1):7–13. doi:10.1097/MCC.0000000000000268.
- Baydur A, Behrakis PK, Zin WA, et al. A simple method for assessing the validity of the esophageal balloon technique. Am Rev Respir Dis. 1982; 126(5):788–791. doi:10.1164/arrd.1982.126.5.788.
- ATS/ERS. ATS/ERS Statement on respiratory muscle testing. Am J Respir Crit Care Med. 2002; 15166(4):518–624.
- Jolley CJ, Luo YM, Steier J, et al. Neural respiratory drive and breathlessness in COPD. Eur Respir J. 2015; 45(2):355–364. doi:10.1183/09031936.00063014.
- Murphy PB, Kumar A, Reilly C, et al. Neural respiratory drive as a physiological biomarker to monitor change during acute exacerbations of COPD. Thorax. 2011;66(7):602–608. doi:10.1136/thx.2010.151332.
- Suh ES, Mandal S, Harding R, et al. Neural respiratory drive predicts clinical deterioration and safe discharge in exacerbations of COPD. Thorax. 2015; 70(12):1123–1130. doi:10.1136/thoraxjnl-2015-207188.
- Lopez-Barneo J, Ortega-Saenz P, Pardal R, et al. Carotid body oxygen sensing. Eur Respir J. 2008; 32(5):1386–1398. doi:10.1183/09031936.00056408.
- Horn EM, Waldrop TG. Suprapontine control of respiration. Respir Physiol. 1998; 114(3):201–211. doi:10.1016/S0034-5687(98)00087-5.
- Masaoka Y, Homma I. The effect of anticipatory anxiety on breathing and metabolism in humans. Respir Physiol. 2001;128(2):171–177. doi:10.1016/S0034-5687(01)00278-X.
- Kinkead R, Tenorio L, Drolet G, et al. Respiratory manifestations of panic disorder in animals and humans: a unique opportunity to understand how supramedullary structures regulate breathing. Respir Physiol Neurobiol. 2014;204:3–13. 1doi:10.1016/j.resp.2014.06.013.
- Casaburi R. The mechanism of the exercise hyperpnea: the ultrasecret revisited. Am J Respir Crit Care Med. 2012;186(7):578–579. 1doi:10.1164/rccm.201207-1278ED.
- Tatar M, Hanacek J, Widdicombe J. The expiration reflex from the trachea and bronchi. Eur Respir J. 2008;31(2):385–390. doi:10.1183/09031936.00063507.
- Faisal A, Alghamdi BJ, Ciavaglia CE, et al. Common mechanisms of dyspnea in chronic interstitial and obstructive lung disorders. Am J Respir Crit Care Med. 2016;193(3):299–309. doi:10.1164/rccm.201504-0841OC.
- Jolley CJ, Luo YM, Steier J, et al. Neural respiratory drive in healthy subjects and in COPD. Eur Respir J. 2008; 33(2):289–297. doi:10.1183/09031936.00093408.
- Druz WS, Sharp JT. Electrical and mechanical activity of the diaphragm accompanying body position in severe chronic obstructive pulmonary disease. Am Rev Respir Dis. 1982;125(3):275–280. doi:10.1164/arrd.1982.125.3.275.
- Reilly CC, Jolley CJ, Ward K, et al. Neural respiratory drive measured during inspiratory threshold loading and acute hypercapnia in healthy individuals. Exp Physiol. 2013; 98(7):1190–1198. doi:10.1113/expphysiol.2012.071415.
- Luo YM, Li R, Jolley C, et al. Neural respiratory drive in patients with COPD during exercise tests. Respiration. 2011;81(4):294–301. doi:10.1159/000317136.
- Petit JM, Milic-Emili G, Delhez L. Role of the diaphragm in breathing in conscious normal man: an electromyographic study. J Appl Physiol. 1960;15(6):1101–1106. Novdoi:10.1152/jappl.1960.15.6.1101.
- Jolley CJ, Moxham J. A physiological model of patient-reported breathlessness during daily activities in COPD. Eur Respir Rev. 2009;18(112):66–79. doi:10.1183/09059180.00000809.
- Luo YM, Moxham J. Measurement of neural respiratory drive in patients with COPD. Respir Physiol Neurobiol. 2005;146(2-3):165–174. doi:10.1016/j.resp.2004.12.014.
- Gorini M, Spinelli A, Ginanni R, et al. Neural respiratory drive and neuromuscular coupling in patients with chronic obstructive pulmonary disease (COPD). Chest. 1990;98(5):1179–1186. doi:10.1378/chest.98.5.1179.
- Luo YM, Hart N, Mustfa N, et al. Effect of diaphragm fatigue on neural respiratory drive. J Appl Physiol (Bethesda, Md: 1985). 2001;90(5):1691–1699. doi:10.1152/jappl.2001.90.5.1691.
- Luo YM, Moxham J, Polkey MI. Diaphragm electromyography using an oesophageal catheter: current concepts. Clin Sci. 2008;115(8):233–244. doi:10.1042/CS20070348.
- Steier J, Jolley CJ, Seymour J, et al. Increased load on the respiratory muscles in obstructive sleep apnea. Respir Physiol Neurobiol. 2010;171(1):54–60. 15doi:10.1016/j.resp.2010.01.012.
- De Troyer A. Actions of the respiratory muscles or how the chest wall moves in upright man. Bull Eur Physiopathol Respir. 1984;20(5):409–413.
- De Troyer A, Estenne M. Coordination between rib cage muscles and diaphragm during quiet breathing in humans. J Appl Physiol Respir Environ Exer Physiol. 1984;57(3):899–906. doi:10.1152/jappl.1984.57.3.899.
- De Troyer A, Sampson MG. Activation of the parasternal intercostals during breathing efforts in human subjects. J Appl Physiol Respir Environ Exer Physiol. 1982;52(3):524–529. doi:10.1152/jappl.1982.52.3.524.
- Hudson AL, Butler JE, Gandevia SC, et al. Interplay between the inspiratory and postural functions of the human parasternal intercostal muscles. J Neurophysiol. 2010;103(3):1622–1629. doi:10.1152/jn.00887.2009.
- Maarsingh EJ, van Eykern LA, Sprikkelman AB, et al. Respiratory muscle activity measured with a noninvasive EMG technique: technical aspects and reproducibility. J Appl Physiol (Bethesda, Md: 1985). 2000;88(6):1955–1961. doi:10.1152/jappl.2000.88.6.1955.
- Duiverman ML, van Eykern LA, Vennik PW, et al. Reproducibility and responsiveness of a noninvasive EMG technique of the respiratory muscles in COPD patients and in healthy subjects. J Appl Physiol (Bethesda, Md: 1985). 2004;96(5):1723–1729. doi:10.1152/japplphysiol.00914.2003.
- Maarsingh EJ, Oud M, van Eykern LA, et al. Electromyographic monitoring of respiratory muscle activity in dyspneic infants and toddlers. Respir Physiol Neurobiol. 2006;150(2-3):191–199. 28doi:10.1016/j.resp.2005.05.029.
- Maarsingh EJ, van Eykern LA, de Haan RJ, et al. Airflow limitation in asthmatic children assessed with a non-invasive EMG technique. Respir Physiol Neurobiol. 2002;133(1-2):89–97. 23doi:10.1016/S1569-9048(02)00130-1.
- Reilly CC, Jolley CJ, Elston C, et al. Measurement of parasternal intercostal electromyogram during an infective exacerbation in patients with cystic fibrosis. Eur Respir J. 2012; 40(4):977–981. doi:10.1183/09031936.00163111.
- Reilly CC, Ward K, Jolley CJ, et al. Neural respiratory drive, pulmonary mechanics and breathlessness in patients with cystic fibrosis. Thorax. 2011;66(3):240–246. doi:10.1136/thx.2010.142646.
- Steier J, Jolley CJ, Polkey MI, et al. Nocturnal asthma monitoring by chest wall electromyography. Thorax. 2011;66(7):609–614. doi:10.1136/thx.2010.152462.
- Fukuda T, Echeimberg J, Pompeu J, et al. Root mean square value of the electromyographic signal in the isometric torque of the quadriceps, hamstrings and brachial biceps muscles in female subjects. J Appl Res. 2010;10(1):32–39.
- Fridlund AJ, Cacioppo JT. Guidelines for human electromyographic research. Psychophysiology. 1986;23(5):567–589. doi:10.1111/j.1469-8986.1986.tb00676.x.
- Wu W, Guan L, Li X, et al. Correlation and compatibility between surface respiratory electromyography and transesophageal diaphragmatic electromyography measurements during treadmill exercise in stable patients with COPD. COPD. 2017;12:3273–3280. doi:10.2147/COPD.S148980.
- Ramsook AH, Mitchell RA, Bell T, et al. Is parasternal intercostal EMG an accurate surrogate of respiratory neural drive and biomarker of dyspnea during cycle exercise testing? Respir Physiol Neurobiol. 2017;242:40–44. doi:10.1016/j.resp.2017.03.003.
- Lapinsky SE, Easty AC. Electromagnetic interference in critical care. J Crit Care. 2006;21(3):267–270. doi:10.1016/j.jcrc.2006.03.010.
- Bayford R. Bioimpedance tomography (electrical impedance tomography). Annu Rev Biomed Eng. 2006;8(1):63–91. doi:10.1146/annurev.bioeng.8.061505.095716.
- Brown BH. Electrical impedance tomography (EIT): a review. J Med Eng Technol. 2003;27(3):97–108. doi:10.1080/0309190021000059687.
- Bodenstein M, David M, Markstaller K. Principles of electrical impedance tomography and its clinical application. Crit Care Med. 2009;37(2):713–724. doi:10.1097/CCM.0b013e3181958d2f.
- Frerichs I, Amato MB, van Kaam AH, et al. Chest electrical impedance tomography examination, data analysis, terminology, clinical use and recommendations: consensus statement of the TRanslational EIT developmeNt stuDy group. Thorax. 2017;72(1):83–93. doi:10.1136/thoraxjnl-2016-208357.
- Frerichs I, Becher T, Weiler N. Methodology of electrical impedance tomography-derived measures of regional lung ventilation. Crit Care. 2014;18:Art. 635.
- Costa EL, Lima RG, Amato MB. Electrical impedance tomography. Curr Opin Crit Care. 2009;15(1):18–24. doi:10.1097/MCC.0b013e3283220e8c.
- Leonhardt S, Lachmann B. Electrical impedance tomography: the holy grail of ventilation and perfusion monitoring? Intensive Care Med. 2012;38(12):1917–1929. doi:10.1007/s00134-012-2684-z.
- Luecke T, Corradi F, Pelosi P. Lung imaging for titration of mechanical ventilation. Curr Opin Anaesthesiol. 2012;25(2):131–140. doi:10.1097/ACO.0b013e32835003fb.
- Lundin S, Stenqvist O. Electrical impedance tomography: potentials and pitfalls. Curr Opin Crit Care. 2012; 18(1):35–41. doi:10.1097/MCC.0b013e32834eb462.
- Moerer O, Hahn G, Quintel M. Lung impedance measurements to monitor alveolar ventilation. Curr Opin Crit Care. 2011; 17(3):260–267. doi:10.1097/MCC.0b013e3283463c9c.
- Muders T, Luepschen H, Putensen C. Impedance tomography as a new monitoring technique. Curr Opin Crit Care. 2010; 16(3):269–275. doi:10.1097/MCC.0b013e3283390cbf.
- Adler A, Amyot R, Guardo R, et al. Monitoring changes in lung air and liquid volumes with electrical impedance tomography. J Appl Physiol. 1997; 83(5):1762–1767. doi:10.1152/jappl.1997.83.5.1762.
- Hinz J, Hahn G, Neumann P, et al. End-expiratory lung impedance change enables bedside monitoring of end-expiratory lung volume change. Intensive Care Med. 2003; 29(1):37–43. doi:10.1007/s00134-002-1555-4.
- Marquis F, Coulombe N, Costa R, et al. Electrical impedance tomography's correlation to lung volume is not influenced by anthropometric parameters. J Clin Monit Comput. 2006; 20(3):201–207. doi:10.1007/s10877-006-9021-4.
- Zhao Z, Moller K, Steinmann D, et al. Evaluation of an electrical impedance tomography-based Global Inhomogeneity Index for pulmonary ventilation distribution. Intensive Care Med. 2009; 35(11):1900–1906. doi:10.1007/s00134-009-1589-y.
- Zhao Z, Steinmann D, Frerichs I, et al. PEEP titration guided by ventilation homogeneity: a feasibility study using electrical impedance tomography. Crit Care. 2010;14(1):R8. doi:10.1186/cc8860.
- Wrigge H, Zinserling J, Muders T, et al. Electrical impedance tomography compared with thoracic computed tomography during a slow inflation maneuver in experimental models of lung injury. Crit Care Med. 2008; 36(3):903–909. doi:10.1097/CCM.0B013E3181652EDD.
- Muders T, Luepschen H, Zinserling J, et al. Tidal recruitment assessed by electrical impedance tomography and computed tomography in a porcine model of lung injury. Crit Care Med. 2012; 40(3):903–911. doi:10.1097/CCM.0b013e318236f452.
- Balleza M, Calaf N, Feixas T, et al. [Measuring breathing pattern in patients with chronic obstructive pulmonary disease by electrical impedance tomography]. Archivos De Bronconeumologia. 2009;45(7):320–324. doi:10.1016/S1579-2129(09)72431-0.
- Trenk F, Mendes L, Carvalho P, et al. Evaluation of lung ventilation distribution in chronic obstructive pulmonary disease patients using the global inhomogeneity index. Conference Proceedings: Annual International Conference of the IEEE Engineering in Medicine and Biology Society IEEE Engineering in Medicine and Biology Society Annual Conference; August 2016. p. 5286–5289.
- Vogt B, Pulletz S, Elke G, et al. Spatial and temporal heterogeneity of regional lung ventilation determined by electrical impedance tomography during pulmonary function testing. J Appl Physiol (1985). 2012; 113(7):1154–1161. doi:10.1152/japplphysiol.01630.2011.
- Vogt B, Zhao Z, Zabel P, et al. Regional lung response to bronchodilator reversibility testing determined by electrical impedance tomography in chronic obstructive pulmonary disease. Am J Physiol Lung Cell Mol Physiol. 2016;311(1):L8–l19. 1doi:10.1152/ajplung.00463.2015.
- Laghi F, Goyal A. Auto-PEEP in respiratory failure. Minerva Anestesiol. 2012;78(2):201–221.
- Brandolese R, Broseghini C, Polese G, et al. Effects of intrinsic PEEP on pulmonary gas exchange in mechanically-ventilated patients. Eur Respir J. 1993;6(3):358–363.
- Mauri T, Bellani G, Salerno D, et al. Regional distribution of air trapping in chronic obstructive pulmonary disease. Am J Respir Crit Care Med. 2013;188(12):1466–1467. doi:10.1164/rccm.201303-0463IM.
- Kostakou E, Barrett N, Camporota L. Electrical impedance tomography to determine optimal positive end-expiratory pressure in severe chronic obstructive pulmonary disease. Crit Care. 2016;20:295. doi:10.1186/s13054-016-1475-2.
- Crabb M, Grychtol B, Lionheart W, et al. editors. EIT regional time constants. Proceedings of the 17th International Conference on Biomedical Applications of Electrical Impedance Tomography, personal communication; 2016.
- R´Oka P, Waldmann A, Ender F, et al. Expiratory time constants by electrical impedance tomography in hypoxemic and hypercapnic acute lung failure – a feasibility study. Int Care Med Exp. 2015;3(Supp 1):495.
- Mead J, Takishima T, Leith D. Stress distribution in lungs: a model of pulmonary elasticity. Appl Physiol. 1970;28(5):596–608. doi:10.1152/jappl.1970.28.5.596.
- Rabbani K, Kabir A. Studies on the effect of the third dimension on a two-dimensional electrical impedance tomography system. Clin Phys Physiol Meas. 1991;12(4):393. (293-402). doi:10.1088/0143-0815/12/4/009.
- Lionheart W. EIT reconstruction algorithms: pitfalls, challenges and recent developments. Physiol Meas. 2004;25(1):125–142. doi:10.1088/0967-3334/25/1/021.
- Adler A, Arnold JH, Bayford R, et al. GREIT: a unified approach to 2D linear EIT reconstruction of lung images. Physiol Meas. 2009; 30(6):S35–S55. doi:10.1088/0967-3334/30/6/S03.
- Frerichs I, Dargaville PA, van Genderingen H, et al. Lung volume recruitment after surfactant administration modifies spatial distribution of ventilation. Am J Respir Crit Care Med. 2006;1174(7):772–779. doi:10.1164/rccm.200512-1942OC.
- Frerichs I, Pulletz S, Elke G, et al. Patient examinations using electrical impedance tomography–sources of interference in the intensive care unit. Physiol Meas. 2011; 32(12):L1–10. doi:10.1088/0967-3334/32/12/F01.
- Becher T, Vogt B, Kott M, et al. Functional regions of interest in electrical impedance tomography: a secondary analysis of two clinical studies. PLoS ONE. 2016;2411(3):e0152267–16. doi:10.1371/journal.pone.0152267.
- Pulletz S, van Genderingen HR, Schmitz G, et al. Comparison of different methods to define regions of interest for evaluation of regional lung ventilation by EIT. Physiol Meas. 2006; 27(5):S115–S27. doi:10.1088/0967-3334/27/5/S10.
- Lowhagen K, Lundin S, Stenqvist O. Regional intratidal gas distribution in acute lung injury and acute respiratory distress syndrome – assessed by electric impedance tomography. Minerva Anestesiol. 2010; 76(12):1024–1035.
- Mauri T, Bellani G, Confalonieri A, et al. Topographic distribution of tidal ventilation in acute respiratory distress syndrome: effects of positive end-expiratory pressure and pressure support. Crit Care Med. 2013; 41(7):1664–1673. doi:10.1097/CCM.0b013e318287f6e7.
- Frerichs I, Dargaville PA, Dudykevych T, et al. Electrical impedance tomography: a method for monitoring regional lung aeration and tidal volume distribution?. Intensive Care Med. 2003;29(12):2312–2316. doi:10.1007/s00134-003-2029-z.
- Pulletz S, Kott M, Elke G, et al. Dynamics of regional lung aeration determined by electrical impedance tomography in patients with acute respiratory distress syndrome. J Crit Care. 2012;157(1):1–1.
- Miedema M, de Jongh FH, Frerichs I, et al. Regional respiratory time constants during lung recruitment in high-frequency oscillatory ventilated preterm infants. Intensive Care Med. 2012; 38(2):294–299. doi:10.1007/s00134-011-2410-2.
- Frerichs I, Dargaville PA, Rimensberger PC. Regional respiratory inflation and deflation pressure-volume curves determined by electrical impedance tomography. Physiol Meas. 2013; 34(6):567–577. doi:10.1088/0967-3334/34/6/567.
- Miedema M, de Jongh FH, Frerichs I, et al. Changes in lung volume and ventilation during surfactant treatment in ventilated preterm infants. Am J Respir Crit Care Med. 2011;184(1):100–105. 1doi:10.1164/rccm.201103-0375OC.
- Miedema M, de Jongh FH, Frerichs I, et al. Changes in lung volume and ventilation during lung recruitment in high-frequency ventilated preterm infants with respiratory distress syndrome. J Pediatr. 2011;159(2):199–205.e2. doi:10.1016/j.jpeds.2011.01.066.
- März A, Ukere A, Wodack K, et al. Perioperative assessment of regional ventilation during changing body positions and ventilation conditions by electrical impedance tomography with increased spatial resolution and signal quality. Crit Care. 2015;19(Suppl 1):P249. doi:10.1186/cc14329.
- Karagiannidis C, Waldmann AD, Roka PL, et al. Regional expiratory time constants in severe respiratory failure estimated by electrical impedance tomography: a feasibility study. Crit Care. 2018;22(1):221. 21doi:10.1186/s13054-018-2137-3.
- Becher T, Kott M, Schadler D, et al. Influence of tidal volume on ventilation inhomogeneity assessed by electrical impedance tomography during controlled mechanical ventilation. Physiol Meas. 2015; 36(6):1137–1146. doi:10.1088/0967-3334/36/6/1137.
- Zhao Z, Pulletz S, Frerichs I, et al. The EIT-based global inhomogeneity index is highly correlated with regional lung opening in patients with acute respiratory distress syndrome. BMC Res Notes. 2014;7(1):82. doi:10.1186/1756-0500-7-82.
- Frerichs I, Achtzehn U, Pechmann A, et al. High-frequency oscillatory ventilation in patients with acute exacerbation of chronic obstructive pulmonary disease. J Crit Care. 2012; 27(2):172–181. doi:10.1016/j.jcrc.2011.04.008.
- Riedel T, Kyburz M, Latzin P, et al. Regional and overall ventilation inhomogeneities in preterm and term-born infants. Intensive Care Med. 2009; 35(1):144–151. doi:10.1007/s00134-008-1299-x.
- Frerichs I, Zhao Z, Becher T, et al. Regional lung function determined by electrical impedance tomography during bronchodilator reversibility testing in patients with asthma. Physiol Meas. 2016; 37(6):698–712. doi:10.1088/0967-3334/37/6/698.