
 ?Mathematical formulae have been encoded as MathML and are displayed in this HTML version using MathJax in order to improve their display. Uncheck the box to turn MathJax off. This feature requires Javascript. Click on a formula to zoom.
Abstract
A healthy respiratory system has variability from breath-to-breath and patients with COPD (PwCOPD) have abnormal variability in breath cycles. The aim of this study was to determine if interbreath-interval and tidal-volume variability, and airflow regularity change as metabolic demands increase (seated, standing, and walking) in PwCOPD as compared to controls. Sixteen PwCOPD (64.3 ± 7.9 yr, 61.3 ± 44.1% FEV1%predicted) and 21 controls (60.2 ± 6.8 yr, 97.5 ± 16.8% FEV1%predicted) sat, stood, and walked at their preferred-pace for five-minutes each while breathing patterns were recorded. The mean, standard deviation, and coefficient of variation of interbreath-intervals and tidal-volume, and the regularity (sample entropy) of airflow were quantified. Results were subjected to ANOVA analysis. Interbreath-interval means were shorter in PwCOPD compared to controls (p = 0.04) and as metabolic demand increased (p < 0.0001), standard deviation was decreased in PwCOPD compared to controls during each condition (p’s < 0.002). Mean tidal-volume did decrease as metabolic demand increased across groups (p < 0.0001). Coefficient of variation findings (p = 0.002) indicated PwCOPD decline in tidal-volume variability from sitting to standing to walking; whereas, controls do not. There was an interaction for airflow (p = 0.02) indicating that although, PwCOPD had a more regular airflow across all conditions, control’s airflow became more irregular as metabolic demand increased. PwCOPD’s airflow was always more regular compared to controls (p = 0.006); although, airflow became more irregular as metabolic demand increased (p < 0.0001). Healthy respiratory systems have variability and irregularity from breath-to-breath decreases with adaptation to demand. PwCOPD have more regular and restricted breathing pattern that may affect their ability to adjust in demanding situations.
Keywords:
Introduction
In 2015, chronic obstructive pulmonary disease (COPD) accounted for 5% of deaths worldwide with more than 90% of these deaths occurring in low- to middle-income countries [Citation1]. COPD is characterized by expiratory airflow limitation and associated changes such as increased respiratory rate.
A healthy respiratory system has variability from breath-to-breath [Citation2, Citation3] that has been studied in a variety of ways [Citation4–6], including entropy analysis [Citation7]. This approach has been used extensively in patients with asthma [Citation8–10]. Entropy analysis has also been used to describe heart rate variability [Citation11, Citation12], gait [Citation13], hormone secretion [Citation14], airway pressure [Citation15], respiratory sound [Citation16], and mechanomyogram signals [Citation17]. Changes in normal breath-to-breath fluctuation are present in several conditions such as aging [Citation4, Citation18], preterm birth [Citation19], asthma [Citation8, Citation9, Citation20], panic attacks [Citation21], and, as recently described, in COPD [Citation10, Citation22]. A differential diagnosis between asthma and COPD was possible through analysis of breath-to-breath fluctuations, (i.e. distance-based time series analysis of respiratory impedance) [Citation10]. Dames et al. [Citation22] reported that breath-to-breath fluctuations, while seated, were more regular in patients with COPD compared to controls and that this increased regularity is associated with disease severity. What is not known is how the regularity of airflow fluctuations change with posture and metabolic demand.
The aim of this study was to determine airflow pattern changes with posture as metabolic demands increased (seated, standing, and walking). Both interbreath intervals (breath-to-breath intervals), tidal volume, and airflow were evaluated. Interbreath interval and tidal volume variability (i.e. standard deviation and coefficient of variation) and the regularity of flow (i.e. sample entropy) were used to quantify airflow pattern changes. Based on existing literature, it was expected that patients with COPD would have a shorter interbreath interval [Citation23] with decreased variability [Citation24] compared to controls. Tidal volume was expected to be smaller with greater variability in patients with COPD compared to controls. In addition, it was anticipated that patients with COPD would have airflow that would become more regular as posture moved from seated to standing to walking as compared to controls, and after walking was initiated, patients with COPD would have a more regular airflow before and during steady-state oxygen consumption when demand increases compared to controls.
Materials and methods
Nineteen patients with COPD and 25 healthy controls were recruited from the general population by advertisement and from the pulmonary clinical studies unit. Sample size was determined using approximate entropy of airflow from healthy controls and persons with severe airway obstruction [Citation25]; using an alpha of 0.05 and desired power of 0.8, a total of 16 subjects per group were needed. Sample size was confirmed using percent change data from Dames (2014) [Citation22]. All subjects underwent spirometry testing (MicroLoop, Vyaire Medical, Mettawa, IL) using the ratio of forced expiratory volume in one second to forced vital capacity (FEV1/FVC) of less than 0.7 [Citation26] to document COPD status. Subjects were excluded from the study if they reported a history of musculoskeletal, cardiovascular, neurological disease, and/or impairment which affected walking ability. Subjects were excluded if they reported another respiratory diagnosis other than COPD and/or were taking medication that would affect metabolism (e.g. cellular respiration). Due to three screen failures and three subjects where equipment failed, 16 patients with COPD and 21 healthy controls participated (). All subjects were consented under University of Nebraska Medical Center Institutional Review Board approved procedures and the study adhered to the guidelines of the Declaration of Helsinki.
Table 1. Subject demographics reported as mean (standard deviation).
Subjects were equipped with a portable metabolic unit to record airflow and volume of oxygen consumed (VO2) (K4b2, Cosmed USA Inc., Concord, California, USA), which was captured at a frequency of 25 Hz. First, airflow, heart rate and oxygen consumption were recorded for five minutes while subjects sat quietly. Next, they were asked to complete the same assessments while standing quietly. Subjects were then asked to determine their preferred walking speed on a treadmill [Citation13]. Once selected, subjects were asked to rest comfortably until heart rate returned to baseline levels. After this, subjects completed a six-minute walking trial at their preferred walking speed on a treadmill. Airflow was recorded for the last five minutes of walking. Airflow data from the three conditions (seated, standing, walking) were subjected to three different analyses.
First, the time intervals for each interbreath interval (peak exhalation to peak exhalation) was calculated using timing of exhalation recorded by the metabolic unit. Tidal volume was also recorded on a breath-by-breath basis through the unit. The mean, standard deviation (SD), and coefficient of variation were calculated for interbreath intervals and tidal volume from the last four minutes of each condition.
Second, to determine the regularity of airflow patterns, sample entropy [Citation7] was calculated. First, unfiltered data were trimmed to include only the final four minutes of walking. This was done to ensure that entropy findings were reflective of steady state VO2. Data were then down sampled by 5, leading to time series length of 1200 data points. Parameters for sample entropy were selected based on confirmation of relative consistency across several combinations of m and r (m = 2, r = 0.2*SD; Supplementary material, Figure 1) [Citation27]. Sample entropy ranges from zero to converging toward infinity; however, the upper bound is typically 3. A lower sample entropy indicates greater regularity and therefore, a more predictable pattern within the data. As sample entropy values increase, this indicates less predictability, less regularity, and increased randomness of the patterns within the data.
Third, to determine the regularity of airflow patterns of the three postures during the rise to steady state and while at steady state, steady state was calculated for each subject by plotting VO2 over the entire five minute trial and assigning a sliding best fit line over a two-minute window. The average VO2 of the 2-minute window that had a slope closest to zero was determined to be steady state (Supplementary material, Figure 2). The transition from increasing VO2 to steady state was manually selected. The time at the transition point was recorded. Airflow was then divided into before and after the transition point to steady state. The first 1500 data points immediately before and after the transition point were then down sampled by 5. Sample entropy (m = 2; r = 0.2*SD, N = 300) was calculated on these time series.
Dependent variables were checked for normality using Shapiro-Wilk and sphericity using Mauchly’s test. Variables that were not normally distributed (standard deviation and coefficient of variation of interbreath intervals and all tidal volume variables) were transformed using a reciprocal approach. After transformation, all residuals were normally distributed. To determine differences in mean, standard deviation, and coefficient of variation of interbreath intervals, tidal volume, overall airflow regularity, and the onset of steady state, 2 × 3 repeated measures ANOVAs were used to determine differences between groups (Control v. COPD) and postures (seated v. standing v. walking), as well as interactions. Airflow regularity at the transition of steady state VO2 was compared using a 2 × 2×3 repeated measures ANOVA to determine differences between groups (Control v. COPD), timing (rise to v. while at steady state VO2), postures (seated v. standing v. walking), and all possible interactions. Greenhouse-Geiser corrections were used if sphericity failed. Post-hoc analyses were conducted using Fisher’s LSD or students t-tests. 95% confidence intervals (CI) were also reported. Statistics were performed in SPSS (24.0, IBM Corp., Armonk, New York, USA) and Prism (7.0, GraphPad Software, La Jolla, CA, USA) with significance set at α = 0.05.
Results
Interbreath intervals
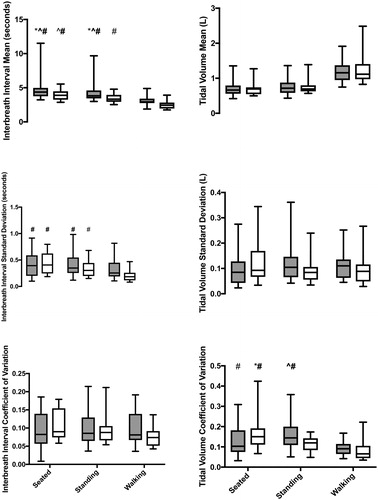
Patients with COPD had significantly shorter interbreath intervals compared to controls across all postures (F1,34=4.4; p = 0.043; CI: −0.88 to −0.02). The mean interbreath interval was significantly different between postures (F1.5,52.5=140.2; p < 0.0001). The mean interbreath interval was longer when seated compared to standing (p < 0.0001; CI: 0.29 to 0.55) and walking (p < 0.0001; CI: 1.16 to 1.58), and longer during standing compared to walking (p < 0.0001; CI: 0.79 to 1.11), across both groups. No interaction was found for mean interbreath intervals.
A significant interaction was found for the standard deviation of the inter-breath intervals (F1.7,60.0=5.6, p = 0.008; ). When seated and standing, patients with COPD had no difference in standard deviation compared to controls; however, in the walking condition, their standard deviation was significantly decreased compared to controls. The standard deviation was significantly decreased in patients with COPD when walking compared to themselves when seated (p < 0.0001; CI: −4.94 to −2.05) and standing (p < 0.0001; CI: −4.21 to −1.32). Controls did not differ across postures. Standard deviation in COPD patients while walking was also significantly decreased when compared to controls when seated (p < 0.0001; CI −4.3 to −1.59), standing (p < 0.0001; CI: −4.58 to −1.87), and walking (p = 0.002; CI: −3.54 to −0.83). No differences were found for coefficient of variation of the interbreath intervals.
Figure 1. Mean (top), standard deviation (middle), and coefficient of variation (bottom) of interbreath intervals (left) and tidal volume (right) during all three postures for controls (gray) and patients with COPD (white). Significant post-hoc comparisons are identified by symbols: asterisk (*) indicates difference from COPD standing; carrot (∧) indicates difference from control walking; and hashtag (#) indicates difference from COPD walking. All pairwise comparisons were significant at p 0.03. Bolded symbols indicate significance at p
0.001. Note: Plotted data are original values and not transformed.
Tidal volume
Mean tidal volume did not differ by group but was affected by posture (F2,70=173.4; p < 0.0001). Both sitting (p < 0.0001; CI: −0.75 to −0.58) and standing (p < 0.0001; CI: −0.66 to −0.48) had a smaller tidal volume compared to walking, and sitting also had a smaller tidal volume compared to standing (p = 0.004; CI: −0.16 to −0.03). No significant interaction for the mean tidal volume was found.
The standard deviation of tidal volume had a significant interaction between group and posture (F2,70=5.6; p = 0.005). However, no significant pairwise comparisons were found. Similarly, there was a significant interaction between group and posture for the coefficient of variation of tidal volume (F2.70=6.7; p = 0.002). Patients with COPD had a significantly lower coefficient of variation while walking compared to controls when seated (p = 0.01; CI: 0.01 to 0.10) and standing (p = 0.0003; CI: 0.04 to 0.12) and with themselves when seated (p < 0.0001; CI: CI: 0.05 to 0.14). Controls also had decreased coefficient of variation while walking when compared to themselves standing (p = 0.002; CI: 0.02 to 0.10). Patients with COPD had an increased coefficient of variation while sitting when compared to themselves standing (p = 0.01; CI: 0.01 to 0.10) and when compared to controls walking (p = 0.0003; CI: 0.04 to 0.12).
Overall airflow
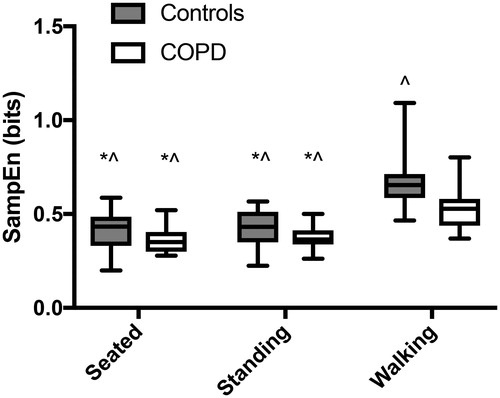
There was a significant interaction in overall airflow between groups and conditions (F1.1,40.2=5.44; p = 0.02). Controls had a steeper increase in irregularity from standing to walking compared to patients with COPD. Overall airflow sample entropy differed between groups (F1,35=8.5; p = 0.006) and postures (F1.1,40.2=79.9; p < 0.0001; ). Patients with COPD had more regularity of airflow across all three postures compared to controls (CI: 0.025 to 0.141). Airflow while walking was significantly more irregular compared to seated (p < 0.001; CI: 0.174 to 0.263) and standing (p < 0.001; CI: 0.154 to 0.252), and standing was more irregular compared to sitting (p = 0.04; CI: 0.001 to 0.031), across both groups.
Figure 2. Overall airflow regularity during each posture for controls (gray) and patients with COPD (white). Significant pairwise comparisons to walking by controls and by patients with COPD are shown by an asterisk (*) and carrot (∧), respectively. All pairwise comparisons were significant at p 0.001.
Airflow differences between the rise vs while at steady state
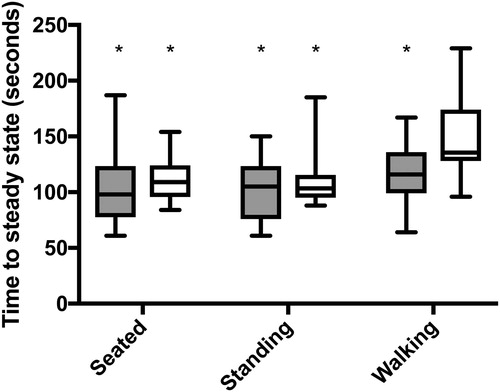
The timing onset of steady state differed between groups (F1,35=6.3; p = 0.017) and postures (F2,70=11.9; p < 0.0001; ). Patients with COPD took longer to reach steady state across all conditions compared to controls (CI: 3.04 to 28.46). The time to reach steady state was significantly longer when walking compared to sitting (p < 0.0001; CI: 11.89 to 37.97) and standing (p < 0.0001; CI: 14.76 to 40.30) in both groups.
Figure 3. Length of time to reach steady state VO2 for both controls (gray) and patients with COPD (white) for all three postures. Significant pairwise comparisons to the time of steady state onset in patients with COPD while walking, are indicated by an asterisk (*). All pairwise comparisons were significant at p 0.001.
A significant 3-way interaction was found between group, posture (seated v. standing v. walking), and steady state (rise to steady state v. while at steady state) (F2,70=6.5; p = 0.003; ). And a significant two-way interaction between posture and group (F2,70=7.2; p = 0.001). Significant post-hoc analyses are outlined in . Controls had a greater decrease in regularity of airflow from sitting to standing to walking compared to COPD across both rise to steady state and while at steady state. In particular, while walking, controls had a greater increase in regularity of airflow from rise to steady state to steady state (p = 0.0003); whereas, patients with COPD did not change the regularity of their airflow after transitioning to steady state while walking (p = 0.90).
Figure 4. Regularity of airflow during the rise to (solid) and after (pattern) the onset of steady state VO2. All three postures are shown for controls (gray) and patients with COPD (white). Significant post-hoc comparisons are identified by symbols: dot (•) indicates difference from COPD standing at steady state; asterisk (*) indicates difference from COPD walking rise to steady state; carrot (∧) indicates difference from COPD walking at steady state; and hashtag (#) indicates difference from control walking at steady state. All pairwise comparisons were significant at p 0.01 with the exception of the standing comparison (p = 0.04).
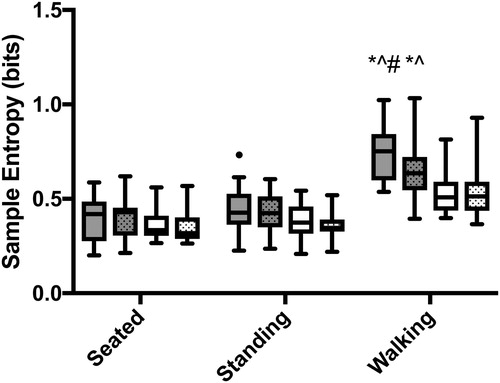
Table 2. ANOVA results for regularity of airflow between groups, postures, and timing. Timing was divided into prior to and just after the onset of steady state VO2. Bold values are significant. Partial eta2 (η2) are also shown.
The regularity of airflow was significantly different between groups, based on the timing (rise to steady state v. while at steady state) (p = 0.049; CI: −0.01 to 0.03; ). Airflow was significantly more irregular during the rise to steady state compared to while at steady state (p = 0.002; ; CI: −0.01 to −0.002). Controls had a greater irregularity in airflow during the rise to steady state compared to while at steady state (p = 0.001; CI: −0.02 to −0.004). Whereas, patients with COPD did not alter the regularity of airflow between timing (p = 0.64; CI: −0.006 to 0.004). In addition, regularity of airflow was significantly different between all postures across groups (F1.2,43.4=28.7; p < 0.0001). Airflow became more irregular as the postures became metabolically more demanding (sitting v. standing: p = 0.018; CI: 0.001 to 0.012; sitting v. walking: p < 0.0001; CI: 0.03 to 0.07; standing v. walking: p < 0.0001; CI: 0.03 to 0.06) (Supplementary material, Figure 3).
Discussion
This study aimed at determining airflow pattern changes with different postures as metabolic demands increased from seated to standing to walking and between controls and patients with COPD. It was determined that mean interbreath intervals were shorter in patients with COPD compared to controls and as metabolic demand increased, indicating an increased respiratory rate in both controls and COPD patients, but more so in COPD. Variability (i.e. standard deviation) was decreased during walking in patients with COPD compared to controls. Patients with COPD had a more regular airflow compared to controls in all three postures. The time to onset of steady state was longer in patients with COPD for all conditions compared to controls. Patients with COPD did not alter the regularity of airflow during the rise versus during steady state; yet, controls had greater airflow irregularity prior to steady state compared to steady state. Lastly, in both groups and in contrast to variability, regularity decreased with increasing metabolic demand.
Respiratory rate increases with the presence of COPD [Citation23]. There is some indication that breath-to-breath variation is decreased in those with COPD [Citation24, Citation28]. In general, as metabolic demand increases so do respiratory rates. It was hypothesized that patients with COPD would demonstrate shorter, less variable interbreath intervals with increased metabolic demand. The findings partially supported our hypotheses. As breathing is constrained by the metabolic requirement for exchange, it is adjusted to maintain constant arterial partial pressure of carbon dioxide, and depends on effective alveolar ventilation. To do this, individuals may increase ventilatory rate or breath volume. The current findings show that patients with COPD did breathe faster than controls even more so as rate increased with demand. This was done even though patients with COPD selected a slower walking speed (), possibly to keep their increased respiratory rate low enough to avoid breathlessness.
Furthermore, it was hypothesized that patients with COPD would have decreased variability in interbreath intervals compared to controls. Variability of respiratory rates in patients with COPD was decreased while walking compared to controls. Patients with COPD have demonstrated decreased variability of ventilation [Citation24, Citation28, Citation29]. Wrigge et al. [Citation29] indicated that a decreased variability of tidal volume while breathing with proportional assist ventilation as an inability of the patients to control tidal volume due to shifts in respiratory demand. Using a computational model, decreased variability in both breath timing and amplitude was found to mostly likely be due to increased lung resistance and ineffective gas exchange, as well as contributions from chemical and neural noise in the respiratory feedback loop [Citation30]. The current findings demonstrate that the variation in interbreath intervals that characterizes normal is reduced in COPD and is further sensitive to metabolic demand.
While breathing may appear regular, like most biological rhythms, fluctuations and partial irregularity often reflects health [Citation3, Citation31]. Breath-to-breath fluctuations while seated were more regular in patients with COPD compared to those without COPD, and the increased regularity was associated with disease severity [Citation22]. The current results extend these findings demonstrating that increased regularity of airflow while standing and walking is present in patients with COPD compared to controls. These findings align with the theory that increased regularity is associated with disease states [Citation32], as well as with aging [Citation33]; thus, limiting flexibility and adaptability to alter breathing patterns in ever-changing, daily situations. Furthermore, as the respiratory and cardiovascular systems are coupled, lung function impairments [Citation12] and impaired respiratory muscle strength [Citation11, Citation34] may affect heart rate variability.
Combining the findings regarding variability and regularity, it appears that as the system approaches a limit, variability decreases and becomes progressively more regular. This increase in regularity could be interpreted in one of two ways. One is that the system is increasing in stability, not deviating from previous patterns. This rigidity may indicate that the system is actually less stable. If the system is too regular, any perturbation to the system may cause a catastrophic change as the system lacks any flexibility or adaptability [Citation3]. For example, a rigid system may be unable to adapt to a change in the environment or increase in metabolic demands. This could lead to insufficient gas exchange and oxygen supply to the working muscles, eventually leading to muscle fatigue and subsequent respiratory failure which occurs in patients with COPD but not in healthy subjects.
In the current study, a comparison of airflow regularity prior to and at steady state was completed. To our knowledge, this is the first comparison of regularity of airflow prior to and after the onset of steady state VO2. A delay in time to steady state, as well as mean response time, in patients with COPD was expected [Citation35], and was confirmed as increased time to steady state was found in patients with COPD at all postures compared to controls. Across both groups, airflow was significantly more irregular during the rise to steady state. This is likely due to the physiological adaptations that must occur due to increased metabolic demands. These include, but are not limited to, increased muscle activation, increased recruitment of Type I fibers, and increased muscle temperature. Breathing must adapt to ensure adequate oxygen delivery to the working muscles. It is feasible that this provides a mechanism for the cardiorespiratory system to determine an economical combination of all physiological components. This could lead to the increased irregularity during the rise to steady state.
Furthermore, patients with COPD demonstrated a lack of flexibility to adapt to the change between the rise to and while at steady state. Once controls reached steady state, their breathing patterns became more regular; whereas, patients with COPD did not change their regularity of breathing. If the decreased irregularity is a mechanism to optimize the system, alterations in energy metabolism in COPD patients may constrain the system making it ineffective. COPD is associated with a decrease in Type I fibers with an increase in Type IIb [Citation36], which are less efficient. Metabolic capacity of patients with COPD is similar to controls, but they have a decreased mechanical efficiency compared to controls [Citation37]. Patients with COPD have weak respiratory muscles and a decreased inspiratory muscle strength is associated with decreased lower extremity function [Citation38]. Further, they have a decreased mechanical activation efficiency of the inspiratory muscles [Citation39]. These alterations in energy utilization and mechanical efficiency may constrain the system preventing from adopting an ‘efficient’ and regular pattern when reaching steady state.
It is known that airflow becomes more regular as COPD disease severity increases [Citation22]. Our results demonstrated that increased regularity of airflow while standing and walking is present in patients with COPD compared to controls; and may be related to disease severity (Supplementary material, ). Breath-to-breath variability changes with age [Citation4], presence of lung disease [Citation40], and may be a prognostic marker prior to admission to the intensive care unit [Citation41] or asthma exacerbation [Citation20]. It is plausible that the variability of interbreath intervals may be predictive of an exacerbation. These measures may also change in response to treatment. For example, interbreath interval variability is higher during short acting versus long acting bronchodilator treatment in patients with asthma [Citation20]. A moderate correlation between FEV1 and entropy (Supplementary material, ) may indicate that improvements in lung function would change airflow regularity.
Healthy patterns are marked by variability and irregularity [Citation33], or homeokinesis [Citation42]. Homeokinesis is defined as the ability to maintain an ordered system that fluctuates within an acceptable range [Citation3, Citation42]. This provides an underlying physiologic capability, e.g. fluctuations, to make flexible adaptations to everyday stresses placed on the human body [Citation3]. The presence of disease is associated with changes in variability and regularity, either too much or too little. This study aligns with this approach as patients with COPD demonstrated altered variability and regularity of breathing patterns. Importantly, decreases in variability and regularity may not have the same implications for health as they show different relationships between disease, i.e. COPD v. control, and metabolic demand. Therefore, future work should investigate variability and regularity of breathing patterns in patients with COPD due to treatment, rehabilitation, exacerbations, and disease severity.
Results presented in this manuscript do not come without limitations. It is possible that drift in the mean or standard deviation of airflow happened over the four minutes of testing (i.e. nonstationarity). Sample entropy is affected by drifts in data. The means from the first and last 300 data points of each time series were examined for changes in mean. It was determined that the data did not have a significant change in mean from the beginning to the end of the trials. However, this does not exclude the possibility of changes throughout the trial. In addition, there is a large periodic component to airflow and this periodicity may affect the sample entropy [Citation43, Citation44]. Additionally, although the mask is less intrusive than tubes in the mouth, it is possible it had an impact on airflow patterns. The mask was removed after every condition while the participant rested. No participant complained about the mask and no participant stopped a trial for any reason. Prior to wearing the mask, each participant was informed about wearing the mask. Anecdotally, many of the patients with COPD said they were hesitant at first but after the five minutes of sitting, did not have any apprehension in using the mask. Finally, COPD eligibility was based on spirometry using FEV1</FVC <0.7 [Citation45,Citation46]. Neither the lower limit of normal nor the fixed ratio of 0.7 are ideal for determining COPD diagnosis. More individuals of older age will meet the 0.7 cutoff than the lower limit of normal [Citation45, Citation47].
Declaration of Interest
SIR was employed by AstraZeneca, Cambridge, UK (2105-2019) during which he retained his Professorship and a part-time appointment at the University of Nebraska Medical Center, Omaha, Nebraska, USA, where he is currently employed. SIR reports personal fees from the Japanese Respiratory Society. No other author reports a conflict of interest.
Supplemental Material
Download PDF (305.5 KB)Acknowledgements
We would like to thank Patrick Meng-Frecker and Casey Wiens for their assistance in data collection and processing.
Additional information
Funding
References
- Global Burden of Disease Study 2016 [Internet]. Seattle, WA: IHME, University of Washington. 2016. [cited 2018 May 9]. Available from: http://ghdx.healthdata.org/gbd-2016.
- Priban IP. An analysis of some short-term patterns of breathing in man at rest. J Physiol. 1963;166(3):425–434. doi:10.1113/jphysiol.1963.sp007114.
- Macklem PT. Complexity and respiration: a matter of life and death. In: Hamid Q, Shannon J, Martin J, editors. Physiologic basis of respiratory disease. Hamilton, Ontario: BC Decker Inc.; 2005. p. 605–609.
- Peng CK, Mietus JE, Liu Y, et al. Quantifying fractal dynamics of human respiration: age and gender effects. Ann Biomed Eng. 2002;30(5):683–692. doi:10.1114/1.1481053.
- Bolton DP, Marsh J. Analysis and interpretation of turning points and run lengths in breath-by-breath ventilatory variables. J Physiol. 1984;351(1):451–459. doi:10.1113/jphysiol.1984.sp015255.
- Wysocki M, Fiamma MN, Straus C, et al. Chaotic dynamics of ventilatory flow in humans. Conf Proc IEEE Eng Med Biol Soc. 2005;1:759–762.
- Lake DE, Richman JS, Griffin MP, et al. Sample entropy analysis of neonatal heart rate variability. Am J Physiol Regul Integr Comp Physiol. 2002;283(3):R789–97. doi:10.1152/ajpregu.00069.2002.
- Gonem S, Umar I, Burke D, et al. Airway impedance entropy and exacerbations in severe asthma. Eur Respir J. 2012;40(5):1156–1163. doi:10.1183/09031936.00228611.
- Veiga J, Lopes AJ, Jansen JM, et al. Fluctuation analysis of respiratory impedance waveform in asthmatic patients: effect of airway obstruction. Med Biol Eng Comput. 2012;50(12):1249–1259. doi:10.1007/s11517-012-0957-x.
- Muskulus M, Slats AM, Sterk PJ, et al. Fluctuations and determinism of respiratory impedance in asthma and chronic obstructive pulmonary disease. J Appl Physiol (1985). 2010;109(6):1582–1591. doi:10.1152/japplphysiol.01414.2009.
- Goulart C. d l, Cristiano Simon J, De Borba Schneiders P, et al. Respiratory muscle strength effect on linear and nonlinear heart rate variability parameters in COPD patients. COPD. 2016;Volume 11:1671–1677. doi:10.2147/COPD.S108860.
- Mazzuco A, Medeiros WM, Sperling MP, et al. Relationship between linear and nonlinear dynamics of heart rate and impairment of lung function in COPD patients. Int J Chron Obstruct Pulmon Dis. 2015;10:1651–1661.
- Yentes JM, Rennard SI, Schmid KK, et al. Patients with chronic obstructive pulmonary disease walk with altered step time and step width variability as compared with healthy control subjects. Annals Ats. 2017;14(6):858–866. doi:10.1513/AnnalsATS.201607-547OC.
- Iranmanesh A, Rochester DF, Liu J, et al. Impaired adrenergic- and corticotropic-axis outflow during exercise in chronic obstructive pulmonary disease. Metabolism. 2011;60(11):1521–1529. doi:10.1016/j.metabol.2011.03.018.
- Letellier C, Rabarimanantsoa H, Achour L, et al. Recurrence plots for dynamical analysis of non-invasive mechanical ventilation. Philos Trans A Math Phys Eng Sci. 2008;366(1865):621–634. doi:10.1098/rsta.2007.2114.
- Aydore S, Sen I, Kahya YP, et al. Classification of respiratory signals by linear analysis. Conf Proc IEEE Eng Med Biol Soc. 2009;2009:2617–2620.
- Torres A, Sarlabous L, Fiz JA, et al. Noninvasive measurement of inspiratory muscle performance by means of diaphragm muscle mechanomyographic signals in COPD patients during an incremental load respiratory test. Conf Proc IEEE Eng Med Biol Soc. 2010;2010:2493–2496.
- Goldberger AL, Amaral LA, Hausdorff JM, et al. Fractal dynamics in physiology: alterations with disease and aging. Proc Natl Acad Sci USA. 2002;99(Supplement 1):2466–2472. doi:10.1073/pnas.012579499.
- Frey U, Silverman M, Barabasi AL, et al. Irregularities and power law distributions in the breathing pattern in preterm and term infants. J Appl Physiol (1985). 1998;85(3):789–797. doi:10.1152/jappl.1998.85.3.789.
- Frey U, Brodbeck T, Majumdar A, et al. Risk of severe asthma episodes predicted from fluctuation analysis of airway function. Nature. 2005;438(7068):667–670. doi:10.1038/nature04176.
- Caldirola D, Bellodi L, Caumo A, et al. Approximate entropy of respiratory patterns in panic disorder. AJP. 2004;161(1):79–87. doi:10.1176/appi.ajp.161.1.79.
- Dames KK, Lopes AJ, de Melo PL. Airflow pattern complexity during resting breathing in patients with COPD: effect of airway obstruction. Respir Physiol Neurobiol. 2014;192:39–47. doi:10.1016/j.resp.2013.12.004.
- Javaheri S, Blum J, Kazemi H. Pattern of breathing and carbon dioxide retention in chronic obstructive lung disease. Am J Med. 1981;71(2):228–234. doi:10.1016/0002-9343(81)90116-9.
- Patel H, Yang KL. Variability of intrinsic positive end-expiratory pressure in patients receiving mechanical ventilation. Crit Care Med. 1995;23(6):1074–1079.
- Veiga J, Lopes AJ, Jansen JM, et al. Airflow pattern complexity and airway obstruction in asthma. J Appl Physiol (1985). 2011;111(2):412–419. doi:10.1152/japplphysiol.00267.2011.
- Global Initiative for Chronic Obstructive Lung D. Global strategy for the diagnosis, management and prevention of COPD. 2015.
- Yentes JM, Hunt N, Schmid KK, et al. The appropriate use of approximate entropy and sample entropy with short data sets. Ann Biomed Eng. 2013;41(2):349–365. doi:10.1007/s10439-012-0668-3.
- Iles R, Motamedi-Fakhr S, Khalid A, et al. Characteristics of COPD tidal breathing patterns measured by structured light plethysmography (SLP): an age, gender, BMI matched study. Eur Respir J. 2015;46:PA2283. doi:10.1183/13993003.congress-2015.PA2283.
- Wrigge H, Golisch W, Zinserling J, et al. Proportional assist versus pressure support ventilation: effects on breathing pattern and respiratory work of patients with chronic obstructive pulmonary disease. Intensive Care Med. 1999;25(8):790–798. doi:10.1007/s001340050954.
- Jaworski J, Bates J. Sources of breathing pattern variability in the respiratory feedback control loop. J Theor Biol. 2019;469:148–162. doi:10.1016/j.jtbi.2019.03.001.
- Lipsitz LA. Dynamics of stability: the physiologic basis of functional health and frailty. J Gerontol A Biol Sci Med Sci. 2002;57(3):B115–25. Mardoi:10.1093/gerona/57.3.B115.
- Goldberger AL. Fractal variability versus pathologic periodicity: complexity loss and stereotypy in disease. Perspect Biol Med. 1997;40(4):543–561. doi:10.1353/pbm.1997.0063.
- Lipsitz LA, Goldberger AL. Loss of complexity and aging - potential applications of fractals and chaos theory to senescence. Jama-J Am Med Assoc. 1992;267(13):1806–1809. 1doi:10.1001/jama.1992.03480130122036.
- Reis MS, Arena R, Deus AP, et al. Deep breathing heart rate variability is associated with respiratory muscle weakness in patients with chronic obstructive pulmonary disease. Clinics (Sao Paulo). 2010;65(4):369–375. doi:10.1590/S1807-59322010000400004.
- Borghi-Silva A, Beltrame T, Reis MS, et al. Relationship between oxygen consumption kinetics and BODE Index in COPD patients. Int J Chron Obstruct Pulmon Dis. 2012;7:711–718.
- Whittom F, Jobin J, Simard PM, et al. Histochemical and morphological characteristics of the vastus lateralis muscle in patients with chronic obstructive pulmonary disease. Med Sci Sports Exerc. 1998;30(10):1467–1474.
- Richardson RS, Leek BT, Gavin TP, et al. Reduced mechanical efficiency in chronic obstructive pulmonary disease but normal peak VO2 with small muscle mass exercise. Am J Respir Crit Care Med. 2004;169(1):89–96. doi:10.1164/rccm.200305-627OC.
- Singer J, Yelin EH, Katz PP, et al. Respiratory and skeletal muscle strength in chronic obstructive pulmonary disease: impact on exercise capacity and lower extremity function. J Cardiopulm Rehabil Prev. 2011;31(2):111–119. doi:10.1097/HCR.0b013e3182033663.
- Sarlabous L, Torres A, Fiz JA, et al. Efficiency of mechanical activation of inspiratory muscles in COPD using sample entropy. Eur Respir J. 2015;46(6):1808–1811. doi:10.1183/13993003.00434-2015.
- Brack T, Jubran A, Tobin MJ. Dyspnea and decreased variability of breathing in patients with restrictive lung disease. Am J Respir Crit Care Med. 2002;165(9):1260–1264. doi:10.1164/rccm.2201018.
- Garrido D, Assioun JJ, Keshishyan A, et al. Respiratory rate variability as a prognostic factor in hospitalized patients transferred to the intensive care unit. Cureus. 2018;10(1):e2100.
- Macklem PT. Emergent phenomena and the secrets of life. J Appl Physiol (1985). 2008;104(6):1844–1846. doi:10.1152/japplphysiol.00942.2007.
- McCamley J, Denton W, Arnold A, et al. On the calculation of sample entropy using continuous and discrete human gait data. Entropy. 2018;20(10):764. doi:10.3390/e20100764.
- Raffalt PC, McCamley J, Denton W, et al. Sampling frequency influences sample entropy of kinematics during walking. Med Biol Eng Comput. 2019;57(4):759–764. doi:10.1007/s11517-018-1920-2.
- Mannino DM, Sonia Buist A, Vollmer WM. Chronic obstructive pulmonary disease in the older adult: what defines abnormal lung function? Thorax. 2007;62(3):237–241. doi:10.1136/thx.2006.068379.
- López-Campos J)L, Soler-Cataluña JJ), Miravitlles M. Global strategy for the diagnosis, management, and prevention of chronic obstructive lung disease 2019 report: future challenges. Arch Bronconeumol. 2020;56(2):65–67. doi:10.1016/j.arbr.2019.06.014.
- Bhatt SP, Balte PP, Schwartz JE, et al. Discriminative accuracy of FEV1:FVC thresholds for COPD-related hospitalization and mortality. JAMA. 2019;321(24):2438–2447. doi:10.1001/jama.2019.7233.