
Abstract
People with chronic obstructive pulmonary disease (COPD) tend to have abnormally low levels of fat-free mass (FFM), which includes skeletal muscle mass as a central component. The purpose of this systematic review was to synthesise available evidence on the association between FFM and exercise test outcomes in COPD. MEDLINE, Cochrane Library, EMBASE, Web of Science, and Scopus were searched. Studies that evaluated exercise-related outcomes in relation to measures of FFM in COPD were included. Eighty-three studies, containing 18,770 (39% female) COPD participants, were included. Considerable heterogeneity was identified in the ways that FFM and exercise test outcomes were assessed; however, higher levels of FFM were generally associated with greater peak exercise capacity. This association was stronger for some exercise test outcomes (e.g. peak rate of oxygen consumption during incremental cycle exercise testing) than others (e.g. six-minute walking distance). This review identified heterogeneity in the methods used for measuring FFM and exercise capacity. There was, in general, a positive association between FFM and exercise capacity in COPD. There was also an identified lack of studies investigating associations between FFM and temporal physiological and perceptual responses to exercise. This review highlights the significance of FFM as a determinant of exercise capacity in COPD.
Supplemental data for this article is available online at https://doi.org/10.1080/15412555.2022.2049737 .
Introduction
Chronic obstructive pulmonary disease (COPD) is a prevalent and disabling chronic health condition associated with abnormally high morbidity and mortality [Citation1,Citation2]. Beyond its established adverse effects on pulmonary structure and function, COPD is now recognised as a systemic disease affecting many extra-pulmonary tissues and organs [Citation3,Citation4]. Skeletal muscle dysfunction is a common and particularly important systemic consequence (or extra-pulmonary manifestation) of COPD because of its adverse effect on clinical and patient-reported outcomes [Citation5].
The aetiology of muscle dysfunction in COPD is complex and multifactorial [Citation5]. The rate of age-related decline in skeletal muscle function is accelerated in people with COPD compared to that of otherwise healthy adults [Citation6]. Additionally, loss of muscle function begins early in the disease course, with ostensible muscle dysfunction observed in people with mild COPD [Citation7]. A joint statement by the American Thoracic Society and European Respiratory Society identified several structural and morphological alterations that combine to contribute to skeletal (limb) muscle dysfunction in people with COPD, including: abnormally low muscle strength and endurance; mitochondrial dysfunction; poor oxidative capacity; shift in muscle fibre-type (i.e. abnormally low and high percentage of type I and type II fibres, respectively); and muscle atrophy or loss of fat-free mass (FFM) [Citation5]. Exaggerated age-related loss of FFM, which includes skeletal muscle mass as a central component, is prevalent in COPD [Citation3, Citation5, Citation8,Citation9]. Prevalence estimates of muscle atrophy (or abnormally low FFM) in the COPD population have been reported to be as high as 35% [Citation5] − 40% [Citation8], with muscle atrophy observed in as many as 50% of people with very severe COPD [Citation5].
Not only is abnormally low FFM prevalent in COPD, but it is associated with a host of negative health outcomes, including abnormally low levels of physical activity [Citation10,Citation11] and quality of life [Citation12], and greater risk of premature death [Citation13,Citation14]. Exercise intolerance is another adverse health consequence of COPD-related loss of FFM, with multiple studies reporting positive correlations between indices of FFM and established measures of exercise capacity, including the distance walked during the six-minute walk test (6MWD) and peak rate of oxygen consumption (V’O2,peak) on symptom-limited incremental exercise testing [Citation15,Citation16]. This is significant considering that both 6MWD and V’O2,peak are established independent predictors of multiple adverse health outcomes for people living with COPD, most notably premature death [Citation17–19].
Considering the reported associations and potential interplay between FFM, exercise capacity, and mortality in COPD, it is imperative that researchers and healthcare providers are provided with the most up-to-date pooled scientific information on the association between FFM and exercise test outcomes in COPD. To this end, the aim of this systematic review was to summarise the extant literature reporting on the association between estimates of FFM and (1) peak exercise capacity and (2) temporal physiological and perceptual responses from rest to peak exercise in people with COPD.
Methods
Terminology
For the purposes of this review, FFM was considered as a term that encompassed any measure of muscle, such as fat-free mass index (FFMI) or appendicular muscle mass (refer to for the full list of accepted evaluations of FFM). Therefore, any study that reported an association between any measure of muscle (i.e. a measure of FFM) and exercise responses in people with COPD were eligible for inclusion in this review.
Table 1. Study characteristics.
Protocol and registration
The protocol for this systematic review was registered on PROSPERO: International prospective register of systematic review database (ID: CRD42019141947). Due to the extent of relevant literature, this review deviated from the protocol and focussed solely on exercise test outcomes – as opposed to exercise test, clinical, and patient-reported outcomes.
Eligibility criteria
Observational studies, including research letters presenting primary data, were eligible for inclusion in this review if: 1) participants were humans aged ≥18 years with a diagnosis of COPD (physician or met spirometric criteria[Citation1]); and 2) associations were reported between FFM and outcomes from exercise tests, including but not limited to: incremental (INCR) or constant work rate (CWR) cardiopulmonary exercise test (CPET); six-minute walk test (6MWT); incremental shuttle walk test (ISWT); endurance shuttle walk test (ESWT); or 12-minute walk test (12MWT).
Studies were excluded if: 1) they were of interventional design, a secondary data analysis (e.g. systematic review), an editorial, an opinion piece, a case study, or a conference abstract; and 2) study participants had a primary condition other than COPD or if data from COPD participants was not reported independently.
Search strategy
Five electronic databases – MEDLINE, EMBASE, Scopus, Web of Science, and Cochrane Library – were initially searched from inception to June 2020 by two independent researchers and updated in August 2021. Search terms were structured around population (e.g. COPD) and FFM (e.g. fat-free mass, muscle mass, cachexia). No search terms were developed specific to the exercise test outcomes, as the current review was conducted concurrently with another registered review (PROSPERO: CRD42020202052). Therefore, searches were performed to capture all possible outcomes. Studies were limited to the English language. The complete search strategy used for MEDLINE is shown in the supplementary material (Table S1).
Study selection
Search results were collated using Rayyan (Rayyan Systems Inc, Cambridge, MA, USA). Following removal of duplicate references, two reviewers screened titles and abstracts independently. Full-text papers were requested for studies not excluded based on title/abstract and independently assessed by two reviewers for eligibility. If consensus on eligibility could not be reached, a third reviewer was consulted to resolve the discrepancy.
Data extraction
A data extraction template was prospectively developed and pilot tested on 10 randomly selected eligible studies by two independent reviewers. Following refinement of the template, two independent reviewers extracted data on all eligible studies. Discrepancies were reviewed and discussed until consensus was reached. The list of characteristics extracted from eligible studies can be found in the supplementary materials (Table S2).
Table 2. Differences in rate of O2 consumption (V’O2) during cardiopulmonary exercise testing (CPET) according to fat-free mass (FFM) status in people with COPD.
Risk of bias assessment
Risk of bias assessment was undertaken using the Quality in Prognosis Studies (QUIPS) [Citation100] tool, which consists of six subdomains: study participation; study attrition; prognostic factor measurement; outcome measurement; study confounding; statistical analysis and reporting. Due to the cross-sectional nature of this systematic review, the study attrition subdomain was not recorded or scored. Two independent reviewers conducted the risk of bias assessment for all eligible studies. A study was classified as having a ‘high’ risk of bias if it had ≥1 ‘high’ subdomains or ≥3 ‘moderate’ subdomains. Additionally, a study was classified as ‘moderate’ if it had 1-2 ‘moderate’ subdomains and no ‘high’ subdomains. Finally, a study was classified as having a ‘low’ risk of bias when all subdomains were classified as ‘low’. This rating system was adapted and modified from a previous review that used the QUIPS tool [Citation100].
Data analysis
Due to the considerable heterogeneity in the ways that FFM and exercise responses were assessed across the studies, the pre-planned meta-analysis was not possible. A narrative description of the data extracted was undertaken. Narrative descriptions included: participant characteristics; measures of body composition; study outcomes; and results. Reported associations between FFM measures and exercise test outcomes were recorded and tabulated for comparison across studies.
Results
Study breakdown
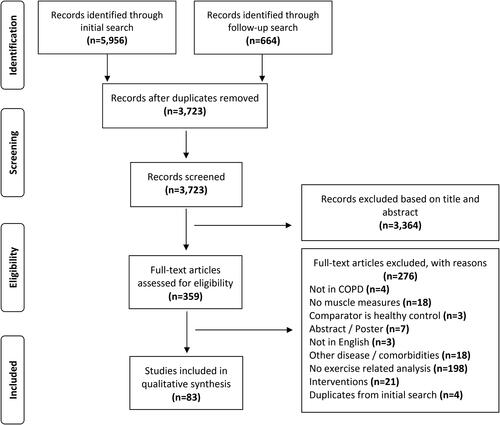
A total of 6,620 references (5,956 and 644 from the initial and follow-up searches, respectively) were identified from the electronic database searches. Of these, 6,537 studies did not meet our inclusion criteria and were subsequently excluded. Thus, a total of 83 studies were included in this review () [Citation10, Citation15,Citation16, Citation20–79, Citation81–99, Citation102].
Figure 1. PRISMA flow diagram of included and excluded studies for initial and second search.
Characteristics of included studies and participants
Studies included in this review are described in . There were 18 770 participants with COPD (61% male, 39% female) included across the 83 studies, which were published between 1989 and 2021. Sixty-five of the 83 studies (78%)[Citation10, Citation16, Citation20–31, Citation33–39, Citation42–49, Citation51–55, Citation57–60, Citation62–65, Citation67, Citation72–75, Citation77–79, Citation81,Citation82, Citation84,Citation85, Citation88–90, Citation92–94, Citation96–99, Citation102] employed a cross-sectional design, whereas 15 (18%)[Citation15, Citation32, Citation41, Citation50, Citation56, Citation66, Citation68, Citation70,Citation71, Citation76, Citation83, Citation86,Citation87, Citation91, Citation95] and three (4%)[Citation40, Citation61, Citation69] studies utilised a longitudinal or combined cross-sectional and longitudinal design, respectively ().
FFM was most commonly assessed by bioelectrical impedance analysis (BIA) (n = 53, 64%)[Citation10, Citation15,Citation16, Citation21, Citation25,Citation26, Citation28–30, Citation33, Citation35–37, Citation39–44, Citation46, Citation50–56, Citation58, Citation61, Citation63–67, Citation69,Citation70, Citation73, Citation76–79, Citation81–86, Citation90, Citation92, Citation96,Citation97, Citation99, Citation102] or dual energy x-ray absorptiometry (DEXA) (n = 15, 18%) [Citation22, Citation24, Citation27, Citation31, Citation34, Citation45, Citation48,Citation49, Citation60, Citation62, Citation66, Citation72, Citation75, Citation93,Citation94]. Fewer studies used computed tomography (CT) (n = 8, 10%) [Citation57, Citation68, Citation74, Citation87, Citation89, Citation91, Citation95, Citation98], magnetic resonance imaging (MRI) (n = 2, 2%) [Citation38, Citation59], ultrasound (n = 2, 2%)[Citation71, Citation77] or other assessment methods (n = 5, 6%) [Citation20, Citation23, Citation32, Citation76, Citation88]. Three (4%) studies[Citation66, Citation76,Citation77] used more than one body composition assessment technique, whereas a single (1%) study[Citation47] did not specify the method of assessment used ().
A range of exercise tests were used, including: 6MWT (n = 52, 63%) [Citation16, Citation22, Citation33–35, Citation38–42, Citation46, Citation48–52, Citation56,Citation57, Citation59,Citation60, Citation62, Citation64–74, Citation76, Citation78,Citation79, Citation81, Citation84–88, Citation90–99, Citation102]; CPET (n = 26, 31%) [Citation15, Citation23–25, Citation27–30, Citation36–38, Citation41, Citation43–45, Citation47, Citation52–55, Citation58, Citation60, Citation70, Citation75, Citation89, Citation94]; ISWT (n = 7, 8%) [Citation31, Citation44, Citation61, Citation63, Citation77, Citation82,Citation83]; 12MWT (n = 6, 7%) [Citation10, Citation20,Citation21, Citation26, Citation32, Citation44]; ESWT (n = 1, 1%) [Citation31]; and 3-minute constant rate step test (3MST) (n = 1, 1%) () [Citation92].
Risk of bias
Sixty-nine of the 83 studies (83%) were classified as having a ‘high’ risk of bias. Of the remaining 14 studies, nine (11%) and five (6%) were classified as having a ‘moderate’ and ‘low’ risk of bias, respectively. Table S3 in the supplementary material outlines the risk of bias classification for each study.
Table 3. Differences in the distance walked during the six-minute walk test (6MWD) according to fat-free mass (FFM) status in people with COPD.
Association between measures of FFM and exercise-related outcomes
Cardiopulmonary exercise testing – rate of oxygen consumption
Four studies reported associations between whole-body FFM (kg) and V’O2,peak (ml/min) [Citation15, Citation25, Citation28, Citation55]. All four found significant correlations between FFM and V’O2,peak ranging from r = 0.52 to 0.71[Citation25, Citation28, Citation55] for bivariate analyses and r = 0.55[Citation15] for a multivariate regression analysis (all p < 0.01). Kobayashi et al.[Citation25] also reported an association between FFM expressed as a percentage of ideal body weight (FFM%IBW) and V’O2,peak (r = 0.65, p < 0.01). Moreover, multivariate regression analyses performed by Kobayashi et al.[Citation25] and Aiello et al.[Citation55] identified FFM as a statistically significant determinant of V’O2,peak. A single study found that people with COPD who had a FFM above versus below the median value of 42 kg for females and 54 kg for males achieved a significantly higher mean V’O2,peak (ml/min) on a symptom-limited INCR cycle CPET () [Citation55].
Nine studies investigated potential associations between FFMI (kg/m2) and a measure of V’O2 either at peak exercise (n = 8)[Citation23, Citation30, Citation36, Citation41, Citation47, Citation52, Citation54, Citation94] or the anaerobic threshold (n = 1) [Citation58]. All three studies that explored bivariate correlations reported statistically significant positive associations between FFMI and each of: V’O2 (ml/min) at the anaerobic threshold (r = 0.51, p < 0.01) [Citation58]; V’O2,peak (ml/min) (r = 0.57, p < 0.01) [Citation23]; and percent predicted normal V’O2,peak (r = 0.68, p < 0.05) () [Citation36]. Nine studies compared V’O2,peak between groups defined by varied FFMI thresholds, alone or in combination with body mass index (BMI) () [Citation23, Citation30, Citation36, Citation41, Citation47, Citation52, Citation54, Citation58, Citation94]. Three reported that V’O2,peak was higher in the FFMI non-depleted participants versus the FFMI depleted participants [Citation47, Citation54, Citation58]. Two studies reported significant and non-significant between-group differences [Citation23, Citation94]. Specifically, significant between-group differences in V’O2,peak were reported between FFMI depleted versus FFMI non-depleted participants when assessed in ml/min [Citation23]; and between normal weight and obese FFMI depleted versus FFMI non-depleted participants when assessed in ml/min and as a percentage of predicted normal V’O2,peak for normal weight participants, and as a percentage of predicted normal V’O2,peak for obese participants () [Citation94]. However, these same studies also reported non-significant between-group differences in V’O2,peak when it was assessed as a percentage of predicted normal V’O2,peak [Citation23]; and between overweight and obese FFMI depleted versus FFMI non-depleted participants when assessed in ml/min and as a percentage of predicted normal V’O2,peak for overweight participants, and ml/min for obese participants () [Citation94]. Three[Citation30, Citation41, Citation52] of the four[Citation30, Citation36, Citation41, Citation52] studies that reported non-significant findings between groups of higher compared to lower FFMI, assessed V’O2,peak in either ml/kg/min or ml/kg-FFM/min ().
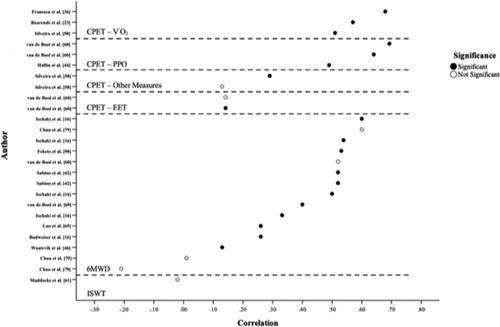
Figure 2. Reported correlations (r values) between fat-free mass index (FFMI) and exercise-related outcomes. Definitions of abbreviations: 6MWD, distance walked in six-minutes; CPET, cardiopulmonary exercise test; CPET-Other, peak-CPET inspiratory capacity related measures; EET, exercise endurance time; ISWD, distance walked during the incremental shuttle walk test; PPO, peak power output; V’O2, rate of oxygen consumption. Visual representation of all reported correlational values between FFMI and exercise-related outcomes. With closed circles representing statistically significant (p < 0.05) associations and open circles indicating statistically non-significant associations (p > 0.05). If correlation coefficients were not reported, they were not included in the graph.
Significant positive associations were reported in three[Citation24, Citation27, Citation53] of four[Citation24, Citation27, Citation45, Citation53] studies that investigated the relationship between measures of lean-body mass (LBM) and V’O2,peak. Positive associations were observed between V’O2,peak (ml/min) and each of LBM (kg) (r = 0.73, p < 0.001) [Citation27], leg-LBM (kg) (r = 0.69, p < 0.001) [Citation27], LBM expressed as a percentage of IBW (LBM%IBW) (r = 0.66, p < 0.001[Citation24] and r = 0.67, p < 0.001[Citation27]), and leg-LBM expressed as a percentage of IBW (r = 0.66, p < 0.001) [Citation27]. LBM%IBW was a significant predictor of V’O2,peak (ml/min) in participants with COPD (β = 0.32, p = 0.009) [Citation24]. Genc et al.[Citation53] reported that LBM (kg) was associated with V’O2,peak when measured in ml/min (r = 0.48, p < 0.001), but not ml/kg/min (p > 0.05). Malaguti et al.[Citation45] reported no significant associations between total leg-LBM (kg) and V’O2,peak.
A single study reported on group differences in V’O2,peak between participants with higher versus lower lean body mass index (LBMI, kg/m2) [Citation45]. People with COPD with LBMI values above versus below sex-specific threshold values achieved a significantly higher V’O2,peak expressed in both ml/min and as a percentage of predicted normal V’O2,peak [Citation45]. However, these differences did not persist when V’O2,peak was referenced to whole-body mass (ml/kg/min) () [Citation45].
Two studies compared V’O2,peak between groups defined by thresholds of appendicular skeletal muscle mass index (ASMI, kg/m2) and either BMI or android to gynoid fat ratios [Citation60, Citation94]. Both studies reported significant and non-significant results depending on the specific groups compared and/or the specific measurement of V’O2,peak used. Significant between-group differences in V’O2,peak were reported between ASMI depleted versus ASMI non-depleted participants when assessed in ml/min [Citation60]; and between normal weight, overweight, and obese ASMI depleted versus ASMI non-depleted participants when assessed in ml/min and as a percentage of predicted normal V’O2,peak for normal weight participants, as a percentage of predicted normal V’O2,peak for obese participants, and ml/min for obese participants () [Citation94]. However, these same studies also reported non-significant between-group differences in V’O2,peak when assessed as a percentage of predicted normal V’O2,peak [Citation60]; and between overweight and obese ASMI depleted versus ASMI non-depleted participants when assessed in ml/min for overweight participants, and as a percentage of predicted normal V’O2,peak for obese participants () [Citation94].
Two studies investigated the association between CT-derived measures of muscle area/density and V’O2,peak [Citation89, Citation98]. In unadjusted analyses, Donovan et al.[Citation89] reported that for each one standard deviation decrease in pectoralis muscle density (Hounsfield units [HU]), pectoralis muscle area (cm2), paraspinal muscle density (HU), and paraspinal muscle area (cm2), there was a statistically significant decline in V’O2,peak on symptom-limited INCR cycle CPET: −2.76 ml/kg/min [95%CI −3.85, −1.67]; −2.35 ml/kg/min [95%CI −3.50, −1.20]; −1.32 ml/kg/min [95%CI −2.56, −0.07]; and −2.04 ml/kg/min [95%CI −3.22, −0.85], respectively (p < 0.05). Associations between V’O2,peak and pectoralis muscle density (HU), pectoralis muscle area (cm2), and paraspinal muscle area (cm2) remained statistically significant after adjusting for age, sex, height, BMI, and smoking status: −2.86 ml/kg/min [95%CI −4.34, −1.37], −2.60 ml/kg/min [95%CI −3.95, −1.25], and −1.77 ml/kg/min [95%CI −3.25, −0.29], respectively (p < 0.05) [Citation89]. During a symptom-limited INCR cycle CPET, Tashiro et al.[Citation98] found that erector spinae muscle cross-sectional area (CSA) (r = 0.39, p = 0.003) and pectoralis muscle CSA (r = 0.36, p = 0.007) were positively associated with V’O2,peak (ml/kg/min). In multivariate analysis, the authors found that pectoralis muscle CSA was a significant predictor of V’O2,peak (β = 0.175 [95%CI 0.03, 0.319], p = 0.02), whereas erector spinae muscle CSA was not (β = 0.192 [95%CI −0.001, 0.385], p = 0.052) [Citation98].
Two studies reported associations between various other measures of FFM (kg) and V’O2,peak assessed during a symptom-limited INCR cycle CPET [Citation29, Citation38]. One study reported significant positive associations between measures of FFM and V’O2,peak (ml/min) [Citation29]. The other study reported a significantly lower V’O2,peak (L/min) in people with COPD with a lower compared to higher measure FFM () [Citation38]. Further details on the specific measures and associations can be found in the supplementary materials (refer specifically to S2.2i Cardiopulmonary exercise testing – Rate of oxygen consumption).
Cardiopulmonary exercise testing – power output
Three studies reported associations between FFM (kg) and peak power output (PPO, watts) [Citation15, Citation37, Citation55]. Statistically significant associations between FFM and PPO were reported in two studies; bivariate linear regression (r = 0.55, p = 0.001)[Citation55] and multiple stepwise regression (r = 0.22, p < 0.001) [Citation15]. Additionally, FFM was identified as a statistically significant predictor of PPO in a multiple regression analysis (p < 0.05) [Citation55]. The third study did not find a statistically significant relationship between FFM and PPO (p > 0.05) [Citation37]. One study reported that PPO (watts) was significantly higher in people with COPD with FFM values above versus below the group median value (Table S4) [Citation55].
Three studies reported relationships between FFMI (kg/m2) and PPO (watts) [Citation37, Citation44, Citation60]. Two found statistically significant positive associations and one reported mixed findings (significant associations in bivariate analyses and non-significant associations in multivariate analyses): r2=0.41, β = 1.92, p = 0.01 for females and r2=0.48, β = 2.90, p < 0.01 for males [Citation60]; r = 0.49, p < 0.001 (bivariate linear regression) and β = 3.0, p = 0.02 (multiple linear regression) [Citation44]; data not reported (p < 0.05) (bivariate linear regression) and data not shown (p > 0.05) (multiple linear regression) () [Citation37]. Three[Citation41, Citation47, Citation75] of 10[Citation23, Citation30, Citation36, Citation41, Citation44, Citation47, Citation54, Citation70, Citation75, Citation94] studies reported statistically significant differences and one[Citation94] reported both significant and non-significant results in PPO (watts) according to groups defined by their FFMI status (Table S4).
Three studies explored associations between other measures of FFM and PPO [Citation24, Citation38, Citation60]. Yoshikawa et al.[Citation24] found that LBM%IBW was both a correlate (r = 0.70, p < 0.001) and predictor (β = 0.34, p = 0.006) of PPO (watts). Van de Bool et al.[Citation60] reported lower PPO (watts) in people with COPD classified as sarcopenic or sarcopenic and abdominally obese compared to non-sarcopenic (p < 0.01 for all). Moreover, predictive models identified ASMI (kg/m2) as a significant predictor of PPO (watts) in both men (r2=0.56, β = 8.06, p < 0.01) and women with COPD (r2=0.47, β = 10.68, p < 0.01) [Citation60]. One study, using an alternative measure of FFM, reported no statistically significant difference in PPO (watts) between people with COPD with low compared to normal thigh muscle mass index (Table S4) [Citation38].
Cardiopulmonary exercise testing – exercise endurance time
Only one study assessed the relationship between FFMI (kg/m2) and exercise endurance time (EET, seconds) [Citation60]. They reported that FFMI was a significant predictor of constant-load cycle EET for males with COPD (r2=0.02, β = 17.53, p = 0.01), but not females with COPD (r2=0.02, p > 0.05) ().
Two studies compared constant-load cycle EET (seconds) between groups defined by varied thresholds of FFMI in combination with BMI [Citation70, Citation94]. One study reported no statistically significant difference in EET among obese, non-obese, or FFMI depleted participants [Citation70]. The other study reported significantly lower EET in the FFMI depleted normal weight group compared to the FFMI non-depleted normal weight group, but reported no significant differences when comparing within the overweight or obese subgroups (Table S5) [Citation94].
Two studies compared constant-load cycle EET (seconds) between groups defined by varied thresholds of ASMI in combination with either BMI or android/gynoid fat ratio [Citation60, Citation94]. Both studies reported significant and non-significant findings, with results varying based on the specific sex or BMI category assessed (refer to Table S5 for detailed summary of results).
Further measures assessing the relationship between measures of FFM and other CPET-related outcomes are reported in the supplementary material (refer specifically to S2.2.iv Cardiopulmonary exercise testing – Other measures).
Six-minute walk test (6MWT)
Four studies reported correlative associations between FFM (kg) and the 6MWD (metres) [Citation34, Citation37, Citation40, Citation84]. One study reported a significant positive association (r = 0.47, p < 0.05) [Citation40], one reported a significant negative association (Coefficient (SE)=-5.1 (1.2), p < 0.001) [Citation37], one reported mixed findings based on FFM status [non-depleted (BMI ≥ 21 kg/m2 and FFMI ≥ 15 kg/m2 for females or ≥16 kg/m2 for males), r = 0.48, p < 0.05; depleted (BMI < 21 kg/m2 and/or FFMI < 15 kg/m2 for females or <16 kg/m2 for males), r = 0.02, p > 0.05] [Citation34], and one reported no significant association between FFM and 6MWD (mild-moderate COPD, r = 0.10, p = 0.533; severe-very severe COPD, r = 0.15, p = 0.437) [Citation84].
Twenty three studies investigated the association between FFMI and 6MWD [Citation16, Citation34,Citation35, Citation37, Citation41,Citation42, Citation46, Citation51,Citation52, Citation56, Citation60, Citation65, Citation67, Citation69,Citation70, Citation72, Citation78,Citation79, Citation90, Citation94, Citation96,Citation97, Citation102]. Of these 23 studies, 13 assessed correlations between FFMI (kg/m2) and 6MWD [Citation16, Citation35, Citation37, Citation42, Citation46, Citation56, Citation60, Citation65, Citation67, Citation69, Citation72, Citation79, Citation90]. Eight[Citation16, Citation35, Citation42, Citation46, Citation56, Citation65, Citation72, Citation90] of 10[Citation16, Citation35, Citation37, Citation42, Citation46, Citation56, Citation65, Citation72, Citation79, Citation90] studies reporting bivariate regression analyses found significant associations between FFMI and 6MWD (metres and percent predicted normal 6MWD) (r2=0.11–0.36, all p < 0.05[Citation16]; r = 0.13–0.53, all p < 0.05[Citation35, Citation42, Citation46, Citation65, Citation90]; OR = 0.814, p = 0.008[Citation72]; 1.4 metre/year change in 6MWD per kg/m2 increase in baseline FFMI, p = 0.046[Citation56]) (). Two studies reported non-significant bivariate correlations between FFMI (kg/m2) and 6MWD (metres) (r=-0.21–0.09, p > 0.5 [Citation79]; data not reported) [Citation37]. Three[Citation16, Citation42, Citation69] of eight[Citation16, Citation42, Citation46, Citation56, Citation60, Citation67, Citation69, Citation72] studies reporting multivariate regression analyses found statistically significant associations, and one[Citation60] reported both significant and non-significant associations between FFMI and a measure of 6MWD. Details of specific outcomes of multivariate analyses are detailed in the supplementary material (refer specifically to S2.2.v Six-minute walk test (6MWT)).
Significant group differences, between some or all groups, in 6MWD were reported in 12[Citation34,Citation35, Citation41, Citation65, Citation67, Citation70, Citation72, Citation78, Citation90, Citation94, Citation96,Citation97] of 16 studies [Citation34,Citation35, Citation41, Citation51,Citation52, Citation65, Citation67, Citation70, Citation72, Citation78,Citation79, Citation90, Citation94, Citation96,Citation97, Citation102]. Machado et al.[Citation94] reported that 6MWD (metres and percent predicted normal 6MWD) was significantly lower in normal weight FFMI depleted participants compared to normal weight FFMI non-depleted participants, but these differences did not persist when FFMI depleted versus non-depleted participants were compared within the overweight and obese categories ().
Three studies reported statistically significant positive bivariate associations between various measures of LBMI and 6MWD (metres) (r = 0.40–0.51, all p < 0.05[Citation49,Citation50]; OR = 0.81, p = 0.008[Citation72]). However, one of the studies also reported a non-significant bivariate correlation between central-LBM (kg) and 6MWD (metres) (r = 0.40, p = 0.07) [Citation49]. One[Citation49] of three[Citation33, Citation49, Citation72] studies to conduct multivariate analyses reported a significant relationship between LBM (kg) and 6MWD (metres). A significant relationship was reported by Hillman et al. [Citation49], who included leg-LBM (kg) in an equation that accounted for 76% of the variance in 6MWD. The other two studies reported non-significant multivariate associations between 6MWD and LBM and (p > 0.05) [Citation33, Citation72]. Three[Citation22, Citation39, Citation72] studies reported group differences between LBMI and 6MWD, of which only one[Citation72] reported a statistically significant between-group difference; reporting that people with COPD who walked ≤350 metres compared to >350 metres during the 6MWT had a significantly lower LBMI ().
Two[Citation81, Citation85] of seven[Citation40, Citation48, Citation62, Citation73, Citation81, Citation85, Citation93] studies reported significant bivariate associations between 6MWD (metres) and ASMI (kg/m2) or skeletal muscle mass index (SMMI) (kg/m2) (r = 0.23, p = 0.001[Citation85]; r2=0.11, p < 0.001[Citation81]). In contrast, five studies reported non-significant associations [Citation40, Citation48, Citation62, Citation73, Citation93]. Three studies performed multivariate analyses between 6MWD (metres) and ASMI (kg/m2) or SMMI (kg/m2) [Citation48, Citation60, Citation81]. One[Citation48] reported both significant and non-significant findings based on the specific model used (refer section S2.2.v Six-minute walk test (6MWT) in the supplementary material for breakdown of individual models), whereas the other two[Citation60, Citation81] found no significant relationship between 6MWD and SMMI [Citation60, Citation81].
Significant differences in 6MWD between people with COPD with higher compared to lower ASMI (kg/m2) or SMMI (kg/m2) were reported in five[Citation66, Citation73, Citation85, Citation92, Citation94] of eight studies [Citation60, Citation66, Citation73, Citation85, Citation86, Citation92–94], with a seventh study[Citation60] having significant and non-significant results based on participant sex (). In all six studies reporting significant differences, the higher ASMI or SMMI group achieved a greater 6MWD compared to the lower ASMI or SMMI group ().
Seven studies reported bivariate associations between 6MWD and measures of muscle area [Citation59, Citation68, Citation71,Citation72, Citation74, Citation91, Citation95]. Of these seven, two reported significant associations [Citation68, Citation72], two reported mixed findings [Citation59, Citation91], and three reported no significant associations [Citation71, Citation74, Citation95]. Three studies[Citation57, Citation72, Citation87] performed multivariate analyses of which only one[Citation57] reported a significant relationship between 6MWD and a measure of FFM. The details of these associations are reported in detail in the supplementary file (refer specifically to S2.2.v Six-minute walk test (6MWT)).
The one study that reported group differences in 6MWD and muscle area in people with COPD found significantly lower mid-arm muscle circumference and arm muscle area in people with COPD that walked ≤350 metres compared to >350 metres during the 6MWT () [Citation72].
Six studies reported associations between various other measures of FFM and 6MWD [Citation34, Citation38, Citation50, Citation64, Citation76, Citation99]. Five[Citation34, Citation38, Citation50, Citation76, Citation99] found significant positive associations between the two variables with the sixth[Citation64] being undetermined due to not reporting p-values. Further details on the specific measures and associations can be found in the supplementary materials (refer specifically to S2.2.v Six-minute walk test (6MWT)). Three studies assessed differences in 6MWD between groups of COPD participants with higher compared to lower measures of FFM [Citation34, Citation64, Citation88]. Two studies[Citation34, Citation64] reported significantly higher 6MWD values in the higher versus lower FFM group, whereas the third study[Citation88] reported mixed values based on the specific 6MWD measure used ().
Incremental shuttle walk test (ISWT)
A single study by Maddocks et al.[Citation61] reported a positive association between FFM (kg) and the distance walked during the ISWT (ISWD, metres) (r = 0.11, p = 0.02).
Two studies reported non-significant correlations between FFMI (kg/m2) and the ISWD (metres): r=-0.02, p > 0.05 () [Citation61]; and β = 7.8, p = 0.27 [Citation44]. Three studies reported differences in ISWD (metres) between COPD participants with higher compared to lower FFMI (kg/m2) [Citation44, Citation61, Citation83]. One study reported significantly lower ISWD in the low FFMI group [Citation83], one reported higher ISWD in the lower FFMI group [Citation61], and one reported no difference in ISWD between the two FFMI groups (Table S9) [Citation44].
Steiner et al.[Citation31] reported that neither whole-body LBM (kg) nor lower-limb LBM (kg) was a significant correlate of ISWD (metres): r = 0.11, β = 1.4, [95%CI −1.4, 4.1] (p = 0.330); and r = 0.16, β = 0.51, [95%CI 0.3, 0.7] (p = 0.16), respectively. Furthermore, neither measure of LBM was a significant predictor of ISWD in multivariate linear regression analysis (p > 0.05).
Two studies [Citation63, Citation82] looked at differences in ISWD (metres) between groups categorised by varied thresholds of ASMI (kg/m2), alone[Citation63, Citation82] or in combination[Citation63] with additional criteria for group allocation (Table S9). When looked at alone, one[Citation82] of two studies[Citation63, Citation82] reported a significantly shorter ISWD in the group of people with lower compared to higher ASMI. Similar results were found when ASMI was combined with additional thresholds for group separation (Table S9) [Citation63].
Using ultrasound, Nijholt et al.[Citation77] measured rectus femoris CSA (cm2) and rectus femoris thickness (cm) and found that neither were associated with ISWD (metres): r = 0.22 (p = 0.274) and r = 0.21 (p = 0.297), respectively. Maddocks et al.[Citation61] reported that BIA-derived phase angle (degree) was both a significant correlate (r = 0.43, p < 0.001) and predictor of ISWD (metres) in people with COPD (β = 52.87, [95%CI 35.3-70.2], p < 0.001).
Using BIA-derived phase angle <5th percentile of the normal reference value to dichotomise participants, Maddocks et al.[Citation61] found that people with COPD with a phase angle <5th percentile of the normal reference value had a significantly shorter ISWD than those with a phase angle >5th percentile (Table S9).
Endurance shuttle walk test (ESWT)
A single study by Steiner et al.[Citation31] reported no statistically significant bivariate associations between the distance walked during the ESWT (ESWD, metres) and either whole-body LBM (kg) (r=-0.09, β=-1.5 [95%CI −4.9, 1.9], p = 0.394) or lower-limb LBM (kg) (r=-0.05, β=-2.1 [95%CI −11.6, 7.4], p = 0.662). Similarly, neither measure of LBM emerged as a statistically significant determinant of ESWD (metres) in multivariable regression analyses (p > 0.05) [Citation31].
The associations between FFM and the outcomes from the 12MWT and 3MST have been summarised in the supplementary materials (refer specifically to S2.2.vii 12-minute walk test (12MWT) and S2.2.viii Three-minute constant-rate step test (3MST)).
Discussion
This systematic review provides a comprehensive and up-to-date summary for scientists and healthcare professionals on the current research reporting on the association between FFM – a proxy for skeletal muscle mass – and exercise test outcomes in people with COPD, including measures of exercise capacity as well as the physiological and perceptual factors that contribute to exercise (in)tolerance.
In capturing 83 studies with a total of 18,770 participants, this is the largest systematic review to report on the relationship between FFM and a variety of important exercise test outcomes in people with COPD. Based on the results of our review, four main take home messages were identified. First, we concluded that there exists, with a few caveats (discussed below), a positive association between FFM and multiple established measures of peak exercise capacity in COPD, particularly V’O2,peak, PPO and 6MWD. This was demonstrated through correlative analyses as well as differences in both absolute and relative measures of exercise capacity between groups of COPD participants with higher versus lower FFM. Second, considerable heterogeneity exists in the strength of the reported associations between FFM and measures of exercise capacity when assessed using different approaches. For example, the reported associations between FFM and both V’O2,peak and PPO on symptom-limited INCR cycle CPET (i.e. non-weight bearing exercise) were consistently stronger and less variable than those reported between FFM and 6MWD (i.e. weight bearing exercise). Third, few studies (n = 8, 10%) reported on the association between FFM and cardiac, ventilatory, breathing pattern, operating lung volume and/or perceptual responses at peak exercise. In the few studies that did, there appeared to be no consistent differences in physiological and/or perceptual outcomes at peak exercise between people with COPD with lower versus higher FFM, despite measures of peak exercise capacity (e.g. 6MWD, V’O2,peak, PPO) being consistently lower in the former. Finally, just two (2%) studies investigated associations between FFM and the physiological and/or perceptual responses during submaximal exercise: Silveira et al.[Citation58] reported a positive correlation between FFM and V’O2 at the anaerobic threshold; and Kanezaki et al.[Citation92] reported that, from rest to the end of the 3MST, people with COPD and a lower FFMI adopted a more rapid and shallow breathing pattern, and reported higher multidimensional breathlessness responses compared to people with COPD and a higher FFMI, despite these groups achieving similar exercise-induced changes in IC and similar absolute levels of ventilation at the end of the 3MST.
Variations in fat-free mass and exercise capacity assessment methods
While the majority of scientific evidence supports the existence of a positive association between FFM and exercise capacity in people with COPD, the methodologies used to assess both FFM and exercise capacity varied considerably across the 83 studies included in this systematic review. As a result of this heterogeneity, we were unable to perform a meta-analysis.
BIA was used most often to quantify FFM in the studies meeting our inclusion criteria (n = 53, 64%). BIA is a safe, non-invasive, inexpensive, easy to administer, and widely available method of assessing FFM that does not require special personnel nor a large amount of space [Citation61]. Moreover, BIA-derived measures of FFM are reliable and positively correlated to other body composition assessment tools; for instance, high levels of agreement between BIA and DEXA-derived measures of FFM have been reported in healthy adults and people with COPD [Citation103,Citation104]. Other assessment methods used were DEXA (n = 15, 18%), CT-scan (n = 8, 10%), MRI (n = 2, 2%), ultrasound (n = 2, 2%), or other techniques, including creatine height index (n = 1, <2%), sarcopenia index (n = 1, <2%), sum of skinfolds (n = 1, <2%), calf-circumference (n = 1, <2%) and deuterium labelled water (n = 1, <2%).
Additionally, and as illustrated in and , the specific FFM measurement of interest varied considerably across studies, with some studies reporting estimates of whole-body, height-adjusted, appendicular, CSA, or volumetric measures of FFM (e.g. FFM, FFMI, ASMI, pectoralis muscle CSA, thigh muscle volume). Furthermore, studies varied considerably in the criteria used to characterise their participants with COPD as being FFM depleted or non-depleted. For example, Mostert et al.[Citation26] used FFMI values of ≤16 kg/m2 for males and ≤15 kg/m2 females, whereas Travassos et al.[Citation69] used FFMI values <17.4 kg/m2 for males and <14.65 kg/m2 for females.
Considerable heterogeneity was also observed across studies for the exercise-related outcome measures (e.g. 6MWT, INCR or constant-load CPET on a cycle ergometer or treadmill, 12MWT, ISWT, ESWT, 3MST) and the way these outcomes were expressed or reported (e.g. absolute, relative and/or percent predicted normal 6MWD, V’O2,peak, PPO, EET). Notwithstanding the observed heterogeneity in methods used to respectively assess and quantify FFM and exercise capacity, a positive association was reported between FFM and exercise capacity in COPD by the majority of studies included in our systematic review.
Whether peak exercise test outcomes were reported in absolute or relative terms is likely responsible, at least in part, for some of the statistically non-significant associations between FFM and measures of peak exercise capacity. For instance, of the four studies that reported no statistically significant differences in V’O2,peak between FFMI depleted and non-depleted adults with COPD, two expressed V’O2,peak in millilitres of O2 per kilogram of body mass per minute (ml/kg/min)[Citation41, Citation52] and another in millilitres of O2 per kilogram of FFM per minute (ml/kg-FFM/min) [Citation30]. Moreover, Malaguti et al.[Citation45] reported that V’O2,peak expressed in ml/min and as percentage of predicted normal V’O2,peak but not ml/kg/min was significantly lower in LBMI depleted compared to LBMI non-depleted participants with COPD. It stands to reason that, by indirectly (ml/kg/min) and directly (ml/kg-FFM/min) adjusting V’O2,peak for between-group differences in FFM, the authors of these studies would not likely observe a significant difference in V’O2,peak between their FFMI depleted and non-depleted participants with COPD. By all accounts, the lack of a statistically significant between-group difference in V’O2,peak expressed in ml/kg/min and especially ml/kg-FFM/min reinforces the negative impact that loss of FFM has on peak exercise capacity in people with COPD.
Weight bearing versus non-weight bearing exercise
The positive association between FFM and measures of exercise capacity was most consistent during non-weight bearing exercise tests (e.g. INCR cycle CPET) and most heterogenous during weight bearing exercise tests (e.g. 6MWD, ISWT). We suspect that inconsistencies (or discrepancies) in the results between studies employing non-weight bearing and weight bearing exercise modalities may be due, at least in part, to a potentially confounding influence of BMI (or excess adiposity) on cardiometabolic and ventilatory responses to exercise, especially weight bearing exercise like walking.
In a study of 186,975 adults aged 45-69 years from the general population of the United Kingdom, Franssen et al.[Citation105] reported a strong positive correlation between FFMI and BMI (r = 0.62, p < 0.001). Similar observations were made by Kyle et al.[Citation106] who reported strong positive correlations between BMI and FFMI in 2,647 healthy adult females (r2=0.60, p < 0.001) and 2,982 healthy adult males (r2=0.61, p < 0.001). Thus, as an individual’s body mass (and fat mass) increases, so too does their FFM. That is, people with overweight or obese BMI classification tend to have more FFM than their normal-weight counterparts. This may have direct implications on the results reported in this systematic review, in as much as higher levels of fat mass (adipose tissue) may obscure or confound the relationship between FFM and exercise capacity in COPD when exercise capacity is assessed using a weight-bearing (e.g. 6MWT) as compared to a non-weight bearing exercise test (e.g. cycle CPET). Indeed, studies have found that both overweight (25 ≤ BMI < 30 kg/m2) and obese (BMI ≥ 30 kg/m2) adults with COPD walked significantly shorter distances during the 6MWT than their normal-weight counterparts (18.5 ≤ BMI < 25 kg/m2), despite comparable levels of chronic airflow obstruction [Citation106,Citation107]. In contrast, neither PPO (watts) on INCR cycle CPET[Citation107] nor constant-load cycle EET (seconds)[Citation107] were significantly different between normal-weight, overweight and obese adults with COPD. From an exercise physiological perspective, Ciavaglia et al.[Citation107] found that absolute V’O2 (L/min) was consistently higher, while oxyhaemoglobin saturation (SpO2) was consistently lower in obese adults with COPD (BMI ≥ 30 kg/m2) at respective standardised submaximal power outputs of ≥20 watts and ≥30 watts during symptom-limited INCR treadmill (weight-bearing) versus cycle (non-weight bearing) CPET protocols matched for the rate of increase in external power output (10 watts/2-min). It follows that the combination of a higher metabolic cost of external work and greater SpO2 desaturation during a weight-bearing exercise test (e.g. 6MWT) may obscure or mask an otherwise positive association between FFM and peak exercise capacity in COPD, especially in the presence of abnormally high levels of adiposity. The corollary of this is that the “true” effect of COPD-related loss of FFM on peak exercise capacity (independent of corresponding changes in fat mass or adiposity) is likely best assessed using a non-weight bearing exercise test (e.g. cycle ergometry). By extension, it could be argued that the impact of therapeutic interventions targeting abnormally low levels of FFM (e.g. resistance exercise training, nutritional supplementation, anabolic hormones) on exercise capacity in COPD are also likely best assessed using a non-weight bearing exercise test where the potentially confounding effect of contemporaneous changes in fat mass is minimised.
Potential misclassification of fat-free mass depletion and non-depletion
The positive relationship between BMI and FFMI may also lead to systematic misclassification of overweight and obese adults with COPD as being FFMI non-depleted since they are more likely to have a FFMI that surpasses the absolute FFMI threshold value used to define FFMI depletion, a threshold that is usually derived from normal-weight and/or slightly overweight populations [Citation105]. In contrast, due to this relationship, underweight (BMI < 18.5 kg/m2) people with COPD are more likely to be classified as FFMI depleted. To minimise this risk of misclassification, Franssen et al.[Citation105] created age-, sex-, and BMI-specific reference values for FFMI depletion in underweight, overweight, and obese adults. They reported FFMI depletion threshold values ranging from ≤18.6-21.3 kg/m2 for overweight-obese males and ≤15.4-17.2 kg/m2 for overweight-obese females. Moreover, FFMI depletion threshold values for underweight people (BMI < 18.5 kg/m2) ranged from ≤14.0-14.9 kg/m2 for males and ≤12.7-13.3 kg/m2 for females. These age-, sex-, and BMI-specific FFMI depletion threshold values are quite different than the non-BMI specific FFMI depletion threshold values of ≤16-17 kg/m2 for males and ≤14-15 kg/m2 for females employed by almost all studies included within this systematic review. This may have resulted in underweight and overweight-obese people with COPD being systematically misclassified as FFMI depleted and non-depleted, respectively. The potential systematic misclassification may be at least partly responsible for the discrepancies or inconsistencies we observed between studies concerning the influence of FFMI depletion on exercise capacity in people with COPD. Thus, we feel that, in moving forward, it is important for COPD researchers and healthcare providers alike to use age-, sex-, and BMI-specific FFMI reference values or to employ statistical models (or experimental study designs) that account for variability in BMI when assessing the effect of changes in FFMI due to COPD and/or therapeutic intervention(s) on exercise capacity in this clinical population. Indeed, Machado et al.[Citation94] compared the prevalence estimates of FFMI depletion in people with COPD when using traditional fixed FFMI cut-offs of 15 kg/m2 for females and 17 kg/m2 for males compared to Franssen and colleague’s[Citation105] age-, sex-, and BMI-specific FFMI thresholds. The authors reported a significantly higher prevalence of FFMI depletion among overweight and obese participants with COPD when the age-, sex- and BMI-specific cut-off values were used compared to the fixed FFMI cut-off values. However, prevalence rates of FFMI depletion were not different within the normal weight participants regardless of how FFMI depletion was defined [Citation94].
Strengths and limitations
One of the main strengths of our systematic review is that we purposefully employed a broad and general keyword search strategy aimed at capturing any study that assessed FFM in people with COPD. From there, we included all studies that reported on the association between FFM and any one or combination of exercise test outcomes. As a result, this systematic review was able to narratively synthesise the relationship between FFM and multiple established measures of exercise capacity from 83 studies that included a total of almost 19,000 adults with COPD.
Data on skeletal muscle strength and endurance – two determinants of skeletal muscle dysfunction in COPD beyond abnormally low skeletal muscle mass (or FFM)[Citation109,Citation110] – while positively related to FFM [Citation38, Citation77, Citation111], were not the focus of this systematic review and thus were not investigated or accounted for in our narrative synthesis of the relationship between FFM and exercise capacity in people with COPD. As such, we cannot comment on the role, whether dependent or independent, that concurrent COPD-related changes in skeletal muscle strength and/or endurance had on the observed (i) associations or lack thereof between FFM and exercise test outcomes and/or (ii) differences or lack thereof in exercise test outcomes between COPD patients with lower compared to higher FFM.
Finally, our systematic review focussed almost exclusively on cross-sectional or correlative studies. Thus, we cannot comment on the efficacy of therapeutic interventions targeting abnormally low levels of FFM in COPD (e.g. rehabilitative exercise training, nutritional supplementation, anabolic hormones) nor the impact of longitudinal changes in FFM on concurrent changes in exercise test outcomes in COPD.
Conclusion and clinical implications
Despite an appreciable amount of heterogeneity in the methods used to assess FFM and quantify exercise capacity across studies in people with COPD, a positive association was reported between these two outcome variables in most of the studies included in this systematic review. We identified a lack of studies investigating the association between FFM and temporal physiological and perceptual responses to exercise. This gap in knowledge needs to be addressed to advance our understanding of the pathophysiological mechanisms underlying the association between loss of FFM and exercise intolerance in COPD.
Considering the prognostic significance of exercise capacity on health-related outcomes (e.g. mortality) in COPD as well as the generally positive association between FFM and exercise capacity reported in this review, skeletal muscle mass should be seen as an important prognostic variable for the health and well-being of people living with COPD. These findings, along with the fact that skeletal muscle is a targetable and treatable bodily organ (or trait) in people with COPD [Citation5], reinforces the need for healthcare providers and researchers alike to develop and implement more effective therapeutic interventions focussed on increasing FFM and improving related health outcomes, specifically exercise capacity. For example, placing a greater emphasis on the importance of resistance exercise training, a component of pulmonary rehabilitation programs [Citation112], may help to increase FFM and improve both the quality and quantity of life lived by people with COPD. This is of particular physiological and clinical importance for those men or women with abnormally low FFMI (especially abnormally low BMI-specific FFMI) and severe exercise intolerance.
Acknowledgements
The authors would like to thank Pardise Elmi and Jade Fraser for their time and contributions to data search and entry. The authors would also like to acknowledge and thank the entire Clinical Exercise and Respiratory Physiology Laboratory (CERPL) for providing support and guidance throughout this process.
Disclosure statement
No potential conflict of interest was reported by the authors.
Additional information
Funding
References
- Vogelmeier C, Agusti A, Anzueto A. GOLD Science Committe Members. Global Strategy for Diagnosis, Management and Prevention of COPD (2021 Report). © 2020, Global Initiative for Chronic Obstructive Lung Disease, available from www.goldcopd.org, published in Fontana, WI, USA.
- Chronic Obstructive Pulmonary Disease Among Adults — United States, 2011. Centers for Disease Control and Prevention (CDC); 2012. [cited 2020]. https://www.cdc.gov/mmwr/preview/mmwrhtml/mm6146a2.htm.
- Agusti AG. Systemic effects of chronic obstructive pulmonary disease. Proc Am Thorac Soc. 2005;2(4):367–370. DOI:10.1513/pats.200504-026SR
- Barnes PJ, Celli BR. Systemic manifestations and comorbidities of COPD. Eur Respir J. 2009;33(5):1165–1185. DOI:10.1183/09031936.00128008
- Maltais F, Decramer M, Casaburi R, ATS/ERS Ad Hoc Committee on Limb Muscle Dysfunction in COPD, et al. An official American Thoracic Society/European Respiratory Society statement: update on limb muscle dysfunction in chronic obstructive pulmonary disease. Am J Respir Crit Care Med. 2014;189(9):e15-62–e62. DOI:10.1164/rccm.201402-0373ST
- Limpawattana P, Inthasuwan P, Putraveephong S, et al. Sarcopenia in chronic obstructive pulmonary disease: a study of prevalence and associated factors in the Southeast Asian population. Chron Respir Dis. 2018;15(3):250–257. DOI:10.1177/1479972317743759
- Shrikrishna D, Patel M, Tanner RJ, et al. Quadriceps wasting and physical inactivity in patients with COPD. Eur Respir J. 2012;40(5):1115–1122. DOI:10.1183/09031936.00170111
- Mathur S, Brooks D, Carvalho CR. Structural alterations of skeletal muscle in COPD. Front Physiol. 2014;5(104):104.
- Vogelmeier CF, Criner GF, Martinez FJ, et al. Global Strategy for the Diagnosis, Management, and Prevention of Chronic Obstructive Lung Disease 2017 Report. GOLD Executive Summary. Am J Respir Crit Care Med. 2017;195(5):557–582. DOI:10.1164/rccm.201701-0218PP
- Schols AM, Mostert R, Soeters PB, et al. Body composition and exercise performance in patients with chronic obstructive pulmonary disease. Thorax. 1991;46(10):695–699. DOI:10.1136/thx.46.10.695
- Yoshimura K, Sato S, Muro S, et al. Interdependence of physical inactivity, loss of muscle mass and low dietary intake: Extrapulmonary manifestations in older chronic obstructive pulmonary disease patients. Geriatr Gerontol Int. 2018;18(1):88–94. DOI:10.1111/ggi.13146
- Koo HK, Park JH, Park HK, et al. Conflicting role of sarcopenia and obesity in male patients with chronic obstructive pulmonary disease: Korean national health and nutrition examination survey. PLoS One. 2014;9(10):e110448. DOI:10.1371/journal.pone.0110448
- Marco E, Sanchez-Rodriguez D, Davalos-Yerovi VN, et al. Malnutrition according to ESPEN consensus predicts hospitalizations and long-term mortality in rehabilitation patients with stable chronic obstructive pulmonary disease. Clin Nutr. 2019;38(5):2180–2186. DOI:10.1016/j.clnu.2018.09.014
- Marquis K, Debigare R, Lacasse Y, et al. Midthigh muscle cross-sectional area is a better predictor of mortality than body mass index in patients with chronic obstructive pulmonary disease. Am J Respir Crit Care Med. 2002;166(6):809–813. DOI:10.1164/rccm.2107031
- Franssen FM, Broekhuizen R, Janssen PP, et al. Effects of whole-body exercise training on body composition and functional capacity in normal-weight patients with COPD. Chest. 2004;125(6):2021–2028. DOI:10.1378/chest.125.6.2021
- Ischaki E, Papatheodorou G, Gaki E, et al. Body mass and fat-free mass indices in COPD: relation with variables expressing disease severity. Chest. 2007;132(1):164–169. DOI:10.1378/chest.06-2789
- Casaburi R. Combination therapy for exercise intolerance in COPD. Thorax. 2006;61(7):551–552. DOI:10.1136/thx.2006.058511
- Pinto-Plata VM, Cote C, Cabral H, et al. The 6-min walk distance: change over time and value as a predictor of survival in severe COPD. Eur Respir J. 2004;23(1):28–33. DOI:10.1183/09031936.03.00034603
- Oga T, Nishimura K, Tsukino M, et al. Analysis of the factors related to mortality in chronic obstructive pulmonary disease: role of exercise capacity and health status. Am J Respir Crit Care Med. 2003;167(4):544–549. DOI:10.1164/rccm.200206-583OC
- Schols AMWJ, Mostert R, Soeters PB, et al. Nutritional state and exercise performance in patients with chronic obstructive lung disease. Thorax. 1989;44(11):937–941. DOI:10.1136/thx.44.11.937
- Schols AMWJ, Soeters PB, Dingemans AMC, et al. Prevalence and characteristics of nutritional depletion in patients with stable COPD eligible for pulmonary rehabilitation. Am Rev Respir Dis. 1993;147(5):1151–1156. DOI:10.1164/ajrccm/147.5.1151
- Shoup R, Dalsky G, Warner S, et al. Body composition and health-related quality of life in patients with obstructive airways disease. Eur Respir J. 1997;10(7):1576–1580. DOI:10.1183/09031936.97.10071576
- Baarends EM, Schols AM, Mostert R, et al. Peak exercise response in relation to tissue depletion in patients with chronic obstructive pulmonary disease. Eur Respir J. 1997;10(12):2807–2813. DOI:10.1183/09031936.97.10122807
- Yoshikawa M, Yoneda T, Kobayashi A, et al. Body composition analysis by dual energy X-ray absorptiometry and exercise performance in underweight patients with COPD. Chest. 1999;115(2):371–375. DOI:10.1378/chest.115.2.371
- Kobayashi A, Yoneda T, Yoshikawa M, et al. The relation of fat-free mass to maximum exercise performance in patients with chronic obstructive pulmonary disease. Lung. 2000;178(2):119–127. DOI:10.1007/s004080000014
- Mostert R, Goris A, Weling-Scheepers C, et al. Tissue depletion and health related quality of life in patients with chronic obstructive pulmonary disease. Respir Med. 2000;94(9):859–867. DOI:10.1053/rmed.2000.0829
- Yoshikawa M, Yoneda T, Takenaka H, et al. Distribution of muscle mass and maximal exercise performance in patients with COPD. Chest. 2001;119(1):93–98. DOI:10.1378/chest.119.1.93
- Gosker HR, Lencer NHMK, Franssen FME, et al. Striking similarities in systemic factors contributing to decreased exercise capacity in patients with severe chronic heart failure or COPD. Chest. 2003;123(5):1416–1424. DOI:10.1378/chest.123.5.1416
- Mamoto T, Fujiwara H, Toyama Y, et al. Relationship between exercise performance and water distribution measured by new bioelectrical impedance analysis in patients with chronic obstructive pulmonary disease. Clin Physiol Funct Imaging. 2003;23(4):230–235. DOI:10.1046/j.1475-097X.2003.00502.x
- Franssen FM, Broekhuizen R, Janssen PP, et al. Limb muscle dysfunction in COPD: effects of muscle wasting and exercise training. Med Sci Sports Exerc. 2005;37(1):2–9.
- Steiner M, Singh SJ, Morgan MDL. The contribution of peripheral muscle function to shuttle walking performance in patients with chronic obstructive pulmonary disease. J Cardiopulm Rehabil. 2005;25:43–49.
- Mathew JT, Gv V, Kurpad AV, et al. Nutritional status predicts outcomes in patients hospitalised with exacerbations of COPD. Lung India. 2006;23(4):143–146. DOI:10.4103/0970-2113.44387
- Eisner MD, Blanc PD, Sidney S, et al. Body composition and functional limitation in COPD. Respir Res. 2007;8:7. DOI:10.1186/1465-9921-8-7
- Villaca DS, Lerario MC, Dal Corso S, et al. Clinical value of anthropometric estimates of leg lean volume in nutritionally depleted and non-depleted patients with chronic obstructive pulmonary disease. Br J Nutr. 2008;100(2):380–386. DOI:10.1017/S0007114507886399
- Budweiser S, Meyer K, Jorres RA, et al. Nutritional depletion and its relationship to respiratory impairment in patients with chronic respiratory failure due to COPD or restrictive thoracic diseases. Eur J Clin Nutr. 2008;62(3):436–443. DOI:10.1038/sj.ejcn.1602708
- Franssen FM, Sauerwein HP, Rutten EP, et al. Whole-body resting and exercise-induced lipolysis in sarcopenic [corrected] patients with COPD. Eur Respir J. 2008;32(6):1466–1471. DOI:10.1183/09031936.00014008
- van Wetering CR, van Nooten FE, Mol SJM, et al. Systemic impairment in relation to disease burden in patients with moderate COPD eligble for lifestyle program. Findings from the INTERCOM trial. COPD. 2008;3:443–451. DOI:10.2147/COPD.S2588
- Vilaro J, Rabinovich R, Gonzalez-deSuso JM, et al. Clinical assessment of peripheral muscle function in patients with chronic obstructive pulmonary disease. Am J Phys Med Rehabil. 2009;88(1):39–46. DOI:10.1097/PHM.0b013e31818dff86
- Pelegrino NRG, Lucheta PA, Sanchez FF, et al. Influence of lean body mass on cardiopulmonary repercussions during the six-minute walk test in patients with COPD. J Bras Pneumol. 2009;35(1):20–26. DOI:10.1590/s1806-37132009000100004
- Giron R, Matesanz C, Garcia-Rio F, et al. Nutritional state during COPD exacerbation: clinical and prognostic implications. Ann Nutr Metab. 2009;54(1):52–58. DOI:10.1159/000205960
- Vogiatzis I, Simoes DC, Stratakos G, et al. Effect of pulmonary rehabilitation on muscle remodelling in cachectic patients with COPD. Eur Respir J. 2010;36(2):301–310. DOI:10.1183/09031936.00112909
- Sabino PG, Silva BM, Brunetto AF. Nutritional status is related to fat-free mass, exercise capacity and inspiratory strength in severe chronic obstructive pulmonary disease patients. Clinics. 2010;65(6):599–605. DOI:10.1590/S1807-59322010000600007
- Cortopassi F, Divo M, Pinto-Plata V, et al. Resting handgrip force and impaired cardiac function at rest and during exercise in COPD patients. Respir Med. 2011;105(5):748–754. DOI:10.1016/j.rmed.2010.12.011
- Hallin R, Janson C, Arnardottir RH, et al. Relation between physical capacity, nutritional status and systemic inflammation in COPD. Clin Respir J. 2011;5(3):136–142. DOI:10.1111/j.1752-699X.2010.00208.x
- Malaguti C, Napolis LM, Villaca D, et al. Relationship between peripheral muscle structure and function in patients with chronic obstructive pulmonary disease with different nutritional status. J Strength Cond Res. 2011;25(7):1795–1803. DOI:10.1519/JSC.0b013e3181e501c1
- Waatevik M, Johannessen A, Hardie JA, et al. Different COPD disease characteristics are related to different outcomes in the 6-minute walk test. COPD. 2012;9(3):227–234. DOI:10.3109/15412555.2011.650240
- Fermoselle C, Rabinovich R, Ausin P, et al. Does oxidative stress modulate limb muscle atrophy in severe COPD patients? Eur Respir J. 2012;40(4):851–862. DOI:10.1183/09031936.00137211
- Cesari M, Pedone C, Chiurco D, et al. Physical performance, sarcopenia and respiratory function in older patients with chronic obstructive pulmonary disease. Age Ageing. 2012;41(2):237–241. DOI:10.1093/ageing/afr167
- Hillman CM, Heinecke EL, Hii JW, et al. Relationship between body composition, peripheral muscle strength and functional exercise capacity in patients with severe chronic obstructive pulmonary disease. Intern Med J. 2012;42(5):578–581. DOI:10.1111/j.1445-5994.2012.02771.x
- Roca M, Mitu F, Roca I, et al. Body composition alterations in chronic obstructive pulmonary disease. Rev Med Chir Soc Med Nat Iasi. 2013;117(1):29–35.
- Berton DC, Silveira L, Da Costa CC, et al. Effectiveness of pulmonary rehabilitation in exercise capacity and quality of life in chronic obstructive pulmonary disease patients with and without global fat-free mass depletion. Arch Phys Med Rehabil. 2013;94(8):1607–1614. DOI:10.1016/j.apmr.2013.02.005
- Natanek SA, Riddoch-Contreras J, Marsh GS, et al. MuRF-1 and atrogin-1 protein expression and quadriceps fiber size and muscle mass in stable patients with COPD. COPD. 2013;10(5):618–624. DOI:10.3109/15412555.2013.781577
- Genc A, Ucok K, Sener U, et al. Association analyses of oxidative stress, aerobic capacity, daily physical activity, and body composition parameters in patients with mild to moderate COPD. Turk J Med Sci. 2014;44(6):972–979.
- Teopompi E, Tzani P, Aiello M, et al. Fat-free mass depletion is associated with poor exercise capacity irrespective of dynamic hyperinflation in COPD patients. Respir Care. 2014;59(5):718–725. DOI:10.4187/respcare.02709
- Aiello M, Teopompi E, Tzani P, et al. Maximal exercise in obese patients with COPD: the role of fat free mass. BMC Pulm Med. 2014;14(1):96. DOI:10.1186/1471-2466-14-96
- Frisk B, Espehaug B, Hardie JA, et al. Physical activity and longitudinal change in 6-min walk distance in COPD patients. Respir Med. 2014;108(1):86–94. DOI:10.1016/j.rmed.2013.09.004
- McDonald ML, Diaz AA, Ross JC, et al. Quantitative computed tomography measures of pectoralis muscle area and disease severity in chronic obstructive pulmonary disease. A cross-sectional study. Annals ATS. 2014;11(3):326–334. DOI:10.1513/AnnalsATS.201307-229OC
- Silveira L, Teixeira PJ, da Costa CC, et al. The relationship between fat-free mass index and pulmonary hyperinflation in COPD patients. Respirology. 2014;19(8):1204–1208. DOI:10.1111/resp.12406
- Robles PG, Sussman MS, Naraghi A, et al. Intramuscular fat infiltration contributes to impaired muscle function in COPD. Med Sci Sports Exerc. 2015;47(7):1334–1341. DOI:10.1249/MSS.0000000000000556
- van de Bool C, Rutten EP, Franssen FM, et al. Antagonistic implications of sarcopenia and abdominal obesity on physical performance in COPD. Eur Respir J. 2015;46(2):336–345. DOI:10.1183/09031936.00197314
- Maddocks M, Kon SS, Jones SE, et al. Bioelectrical impedance phase angle relates to function, disease severity and prognosis in stable chronic obstructive pulmonary disease. Clin Nutr. 2015;34(6):1245–1250. DOI:10.1016/j.clnu.2014.12.020
- Ramos D, Bertolini GN, Leite MR, et al. Is dynamometry able to infer the risk of muscle mass loss in patients with COPD? Int J Chron Obstruct Pulmon Dis. 2015;10:1403–1407. DOI:10.2147/COPD.S69829
- Jones SE, Maddocks M, Kon SS, et al. Sarcopenia in COPD: prevalence, clinical correlates and response to pulmonary rehabilitation. Thorax. 2015;70(3):213–218. DOI:10.1136/thoraxjnl-2014-206440
- de Blasio F, de Blasio F, Miracco Berlingieri G, et al. Evaluation of body composition in COPD patients using multifrequency bioelectrical impedance analysis. COPD. 2016;11:2419–2426. DOI:10.2147/COPD.S110364
- Luo Y, Zhou L, Li Y, et al. Fat-free mass index for evaluating the nutritional status and disease severity in COPD. Respir Care. 2016;61(5):680–688. DOI:10.4187/respcare.04358
- Cebron Lipovec N, Schols AM, van den Borst B, et al. Sarcopenia in advanced COPD affects cardiometabolic risk reduction by Short-Term high-intensity pulmonary rehabilitation. J Am Med Dir Assoc. 2016;17(9):814–820. DOI:10.1016/j.jamda.2016.05.002
- Joppa P, Tkacova R, Franssen FM, et al. Sarcopenic obesity, functional outcomes, and systemic inflammation in patients with chronic obstructive pulmonary disease. J Am Med Dir Assoc. 2016;17(8):712–718. DOI:10.1016/j.jamda.2016.03.020
- Martin M, Almeras N, Despres J, et al. Ectopic fat accumulation in patients with COPD: an ECLIPSE substudy. COPD. 2017;12:451–460. DOI:10.2147/COPD.S124750
- Travassos A, Rodrigues A, Furlanetto KC, et al. Fat-free mass depletion in patients with COPD in Brazil: development of a new cutoff point and its relation with mortality and extrapulmonary manifestations. Eur J Clin Nutr. 2017;71(11):1285–1290. DOI:10.1038/ejcn.2017.105
- Tunsupon P, Mador MJ. The influence of body composition on pulmonary rehabilitation outcomes in chronic obstructive pulmonary disease patients. Lung. 2017;195(6):729–738. DOI:10.1007/s00408-017-0053-y
- Buttery SC, Mohan D, Fisk M, et al. Longitudinal follow-up of quadriceps strength and function in a COPD cohort after 3 years. Eur Respir J. 2017;50(2):1700707. DOI:10.1183/13993003.00707-2017
- Matkovic Z, Cvetko D, Rahelic D, et al. Nutritional status of patients with chronic obstructive pulmonary disease in relation to their physical performance. COPD. 2017;14(6):626–634. DOI:10.1080/15412555.2017.1386643
- Byun MK, Cho EN, Chang J, et al. Sarcopenia correlates with systemic inflammation in COPD. Int J Chron Obstruct Pulmon Dis. 2017;12:669–675. DOI:10.2147/COPD.S130790
- Ju S, Lee SJ, Park MJ, et al. Clinical importance of cross-sectional area of intercostal muscles in patients with chronic obstructive pulmonary disease. Clin Respir J. 2018;12(3):939–947. DOI:10.1111/crj.12609
- Kapchinsky S, Vuda M, Miguez K, et al. Smoke-induced neuromuscular junction degeneration precedes the fibre type shift and atrophy in chronic obstructive pulmonary disease. J Physiol. 2018;596(14):2865–2881. DOI:10.1113/JP275558
- Amado CA, Garcia-Unzueta MT, Lavin BA, et al. The ratio serum creatinine/serum cystatin C (a surrogate marker of muscle mass) as a predictor of hospitalization in chronic obstructive pulmonary disease outpatients. Respiration. 2019;97(4):302–309. DOI:10.1159/000494296
- Nijholt W, Beek LT, Hobbelen JSM, et al. The added value of ultrasound muscle measurements in patients with COPD: an exploratory study. Clin Nutr ESPEN. 2019;30:152–158. DOI:10.1016/j.clnesp.2019.01.001
- Machado FVC, Schneider LP, Fonseca J, et al. Clinical impact of body composition phenotypes in patients with COPD: a retrospective analysis. Eur J Clin Nutr. 2019;73(11):1512–1519. DOI:10.1038/s41430-019-0390-4
- Chua JR, Albay AB, Jr., Tee ML. Body composition of Filipino chronic obstructive pulmonary disease (COPD) patients in relation to their lung function, exercise capacity and quality of life. Int J Chron Obstruct Pulmon Dis. 2019;14:2759–2765. DOI:10.2147/COPD.S222809
- Kyomoto Y, Asai K, Yamada K, et al. Handgrip strength measurement in patients with chronic obstructive pulmonary disease: Possible predictor of exercise capacity. Respir Investig. 2019;57(5):499–505. DOI:10.1016/j.resinv.2019.03.014
- Mansour KMK, Goulart CDL, Carvalho-Junior LCS, et al. Pulmonary function and functional capacity cut-off point to establish sarcopenia and dynapenia in patients with COPD. J Bras Pneumol. 2019;45(6):e20180252.
- Kwan HY, Maddocks M, Nolan CM, et al. The prognostic significance of weight loss in chronic obstructive pulmonary disease-related cachexia: a prospective cohort study. J Cachexia Sarcopenia Muscle. 2019;10(6):1330–1338. DOI:10.1002/jcsm.12463
- Cinar A, Arslan S, Demirel Y. The relationship of exercise capacity with fat-free mass and body mass index in elderly patients with chronic obstructive pulmonary disease. tjgeri. 2019;22(1):66–73. DOI:10.31086/tjgeri.2019150574
- Demircioğlu H, Cihan FG, Kutlu R, et al. Frequency of sarcopenia and associated outcomes in patients with chronic obstructive pulmonary disease. Turk J Med Sci. 2020;50(5):1270–1279. DOI:10.3906/sag-1909-36
- Perrot L, Greil A, Boirie Y, et al. Prevalence of sarcopenia and malnutrition during acute exacerbation of COPD and after 6 months recovery. Eur J Clin Nutr. 2020;74(11):1556–1564. DOI:10.1038/s41430-020-0623-6
- Attaway AH, Welch N, Yadav R, et al. Quantitative computed tomography assessment of pectoralis and erector spinae muscle area and disease severity in chronic obstructive pulmonary disease referred for lung volume reduction. COPD: J Chronic Obstruct Pulmonary Dis. 2021;18(2):191–200. DOI:10.1080/15412555.2021.1897560
- Bernardes S, Silva FM, da Costa CC, et al. Reduced calf circumference is an independent predictor of worse quality of life, severity of disease, frequent exacerbation, and death in patients with chronic obstructive pulmonary disease admitted to a pulmonary rehabilitation program: a historic cohort study. J Parenter Enteral Nutr. 2021;46(3):546–555. DOI:10.1002/jpen.2214
- Donovan AA, Johnston G, Moore M, et al. Diaphragm morphology assessed by computed tomography in chronic obstructive pulmonary disease. Ann Am Thorac Soc. 2021;18(6):955–962. DOI:10.1513/AnnalsATS.202007-865OC
- Fekete M, Fazekas-Pongor V, Balazs P, et al. Effect of malnutrition and body composition on the quality of life of COPD patients. PhysInt. 2021;108(2):238–250. DOI:10.1556/2060.2021.00170
- Higashimoto Y, Shiraishi M, Sugiya R, et al. Effect of pulmonary rehabilitation on erector spinae muscles in individuals with COPD. Respir Care. 2021;66(9):1458–1468. DOI:10.4187/respcare.08678
- Kanezaki M, Terada K, Tanabe N, et al. Effects of sarcopenia on ventilatory behavior and the multidimensional nature of dyspnea in patients with chronic obstructive pulmonary disease. J Am Med Dir Assoc. 2021;22(4):827–833. DOI:10.1016/j.jamda.2021.01.081
- Lage VKS, Silva GP, Lacerda ACR, et al. Functional tests associated with sarcopenia in moderate chronic obstructive pulmonary disease. Expert Rev Respir Med. 2021;15(4):569–576. DOI:10.1080/17476348.2021.1850276
- Machado FVC, Spruit MA, Groenen MTJ, et al. Frequency and functional translation of low muscle mass in overweight and obese patients with COPD. Respir Res. 2021;22(1):93. DOI:10.1186/s12931-021-01689-w
- Mason SE, Moreta-Martinez R, Labaki WW, et al. Respiratory exacerbations are associated with muscle loss in current and former smokers. Thorax. 2021;76(6):554–560. DOI:10.1136/thoraxjnl-2020-215999
- Mjid M, Hedhli A, Rouhou SC, et al. COPD patients’ body composition and its impact on lung function. Tunisie Med. 2021;99(2):285–290.
- Schneider LP, Sartori LG, Machado FVC, et al. Physical activity and inactivity among different body composition phenotypes in individuals with moderate to very severe chronic obstructive pulmonary disease. Brazilian J Phys Ther. 2021;25(3):296–302. DOI:10.1016/j.bjpt.2020.07.005
- Tashiro H, Takahashi K, Tanaka M, et al. Skeletal muscle is associated with exercise tolerance evaluated by cardiopulmonary exercise testing in Japanese patients with chronic obstructive pulmonary disease. Sci Rep. 2021;11(1):15862. DOI:10.1038/s41598-021-95413-9
- Zanella PB, Avila CC, Chaves FC, et al. Phase angle evaluation of lung disease patients and its relationship with nutritional and functional parameters. J Am Coll Nutr. 2021;40(6):529–534. DOI:10.1080/07315724.2020.1801535
- Hayden JA, van der Windt DA, Cartwright JL, et al. Assessing bias in studies of prognostic factors. Ann Intern Med. 2013;158(4):280–286. DOI:10.7326/0003-4819-158-4-201302190-00009
- Grooten WJA, Tseli E, Ang BO, et al. Elaborating on the assessment of the risk of bias in prognostic studies in pain rehabilitation using QUIPS-aspects of interrater agreement. Diagn Progn Res. 2019;3:5. DOI:10.1186/s41512-019-0050-0
- Barreiro E, Sancho-Munoz A, Puig-Vilanova E, et al. Differences in micro-RNA expression profile between vastus lateralis samples and myotubes in COPD cachexia. J Appl Physiol (1985). 2019;126(2):403–412. DOI:10.1152/japplphysiol.00611.2018
- Ling CH, de Craen AJ, Slagboom PE, et al. Accuracy of direct segmental multi-frequency bioimpedance analysis in the assessment of total body and segmental body composition in Middle-aged adult population. Clin Nutr. 2011;30(5):610–615. DOI:10.1016/j.clnu.2011.04.001
- Fonseca FR, Karloh M, Araujo CLP, et al. Validation of a bioelectrical impedance analysis system for body composition assessment in patients with COPD. J Bras Pneumol. 2018;44(4):315–320. DOI:10.1590/s1806-37562017000000121
- Franssen FM, Rutten EP, Groenen MT, et al. New reference values for body composition by bioelectrical impedance analysis in the general population: results from the UK biobank. J Am Med Dir Assoc. 2014;15(6):448e1-6.
- Kyle UG, Schutz Y, Dupertuis YM, et al. Body composition interpretation: contributions of the fat-free mass index and the body fat mass index. Nutrition. 2003;19(7–8):597–604. DOI:10.1016/S0899-9007(03)00061-3
- Sava F, Laviolette L, Bernard S, et al. The impact of obesity on walking and cycling performance and response to pulmonary rehabilitation in COPD. BMC Pulm Med. 2010;10:55. DOI:10.1186/1471-2466-10-55
- Maatman RC, Spruit MA, van Melick PP, et al. Effects of obesity on weight-bearing versus weight-supported exercise testing in patients with COPD. Respirology. 2016;21(3):483–488. DOI:10.1111/resp.12700
- Ciavaglia CE, Guenette JA, Ora J, et al. Does exercise test modality influence dyspnoea perception in obese patients with COPD? Eur Respir J. 2014;43(6):1621–1630. DOI:10.1183/09031936.00151513
- Jaitovich A, Barreiro E. Skeletal muscle dysfunction in chronic obstructive pulmonary disease. What We know and can do for our patients. Am J Respir Crit Care Med. 2018;198(2):175–186. DOI:10.1164/rccm.201710-2140CI
- Kim HC, Mofarrahi M, Hussain SN. Skeletal muscle dysfunction in patients with chronic obstructive pulmonary disease. Int J Chron Obstruct Pulmon Dis. 2008;3(4):637–658. DOI:10.2147/copd.s4480
- Hopkinson NS, Tennant RC, Dayer MJ, et al. A prospective study of decline in fat free mass and skeletal muscle strength in chronic obstructive pulmonary disease. Respir Res. 2007;8:25. DOI:10.1186/1465-9921-8-25
- Spruit MA, Singh SJ, Garvey C, et al. An official American Thoracic Society/European Respiratory Society statement: key concepts and advances in pulmonary rehabilitation. Am J Respir Crit Care Med. 2013;188(8):e13–64. DOI:10.1164/rccm.201309-1634ST