
Abstract
Respiratory oscillometry allows measuring respiratory resistance and reactance during tidal breathing and may predict exacerbations in patients with chronic obstructive pulmonary disease (COPD). While the Global Initiative for Chronic Obstructive Lung Disease (GOLD) advocates the ABCD classification tool to determine therapeutic approach based on symptom and exacerbation history, we hypothesized that in addition to spirometry, respiratory oscillometry complemented the ABCD tool to identify patients with a high risk of exacerbations. This study enrolled male outpatients with stable COPD who were prospectively followed-up over 5 years after completing mMRC scale and COPD assessment test (CAT) questionnaires, post-bronchodilator spirometry and respiratory oscillometry to measure resistance, reactance, and resonant frequency (Fres), and emphysema quantitation on computed tomography. Total 134 patients were classified into the GOLD A, B, C, and D groups (n = 48, 71, 5, and 9) based on symptoms on mMRC and CAT and a history of exacerbations in the previous year. In univariable analysis, higher Fres was associated with an increased risk of exacerbation more strongly than other respiratory oscillometry indices. Fres was closely associated with forced expiratory volume in 1 sec (FEV1). In multivariable Cox-proportional hazard models of the GOLD A and B groups, either lower FEV1 group or higher Fres group was associated with a shorter time to the first exacerbation independent of the GOLD group (A vs B) and emphysema severity. Adding respiratory oscillometry to the ABCD tool may be useful for risk estimation of future exacerbations in COPD patients without frequent exacerbation history.
Introduction
Chronic Obstructive Pulmonary Disease (COPD) is a disease of the airway and parenchyma that impairs airflow and causes morbidity and mortality worldwide [Citation1]. Patients develop exacerbations that are defined as worsening of respiratory symptoms requiring additional prescription of antibiotics and/or systemic steroids. Exacerbations accelerate lung function decline [Citation2], impair health status [Citation3,Citation4], and cause poor prognosis [Citation5]. Because the risk of exacerbations is highly heterogeneous among patients, rigorous risk assessment and appropriate personalized interventions to prevent future exacerbations are essential to improve clinical outcomes in patients with COPD.
A history of exacerbations [Citation6], lower forced expiratory volume in 1 sec [FEV1] (< 50% of predicted) [Citation7,Citation8], and severe symptoms [Citation9] are well-recognized as major predictors of exacerbations. In 2011, the Global Initiative for Chronic Obstructive Lung Disease (GOLD) document first proposed the ABCD assessment tool in which patients were categorized into 4 groups based on FEV1, a history of exacerbations, and symptoms for risk stratification and administration of appropriate therapeutics. Subsequently, the FEV1 criterion was removed in the update of the ABCD assessment in 2017. However, this simplification appears to reduce the sensitivity to estimate future risks of patients with COPD. Oishi et al. [Citation10] showed that a frequency of exacerbations varies among patients who are categorized as the GOLD A group (less symptom and no frequent exacerbation history) and Han et al. [Citation11] showed that a combination of FEV1 and the ABCD assessment predicts mortality more sensitively than the ABCD assessment alone.
While spirometry is a standard physiological assessment, the importance of forced oscillation technique (respiratory oscillometry) is increasingly recognized because respiratory oscillometry can assess respiratory resistance and reactance during tidal breathing unlike spirometry. Additionally, spirometry potentially generates more aerosol than respiratory oscillometry and is difficult to perform in the pandemic of severe acute respiratory syndrome coronavirus 2 [Citation12]. Moreover, a baseline impairment in reactance predicts future exacerbations in a large observational study [Citation13] and an increase in day-to-day variation of reactance at home-based monitoring sensitively detects future exacerbations in patients with COPD [Citation14].
It was hypothesized that adding physiological assessments using respiratory oscillometry to the ABCD assessments could increase the accuracy of risk estimation of future exacerbations in patients with COPD. Since the simplicity of the estimation tool is important in clinical practice and a portion of patients in the GOLD A and B groups may carry a higher risk of exacerbations despite the absence of frequent exacerbation history, this study was aimed at identifying the best physiological index of respiratory oscillometry, which could subdivide the GOLD A and B groups into those with and without a higher risk of exacerbations using longitudinal data of a single center COPD cohort.
Methods
Study design
This study was based on a retrospective analysis of a prospective cohort study in Kyoto University Hospital [Citation15–17]. Outpatients with stable COPD were enrolled and underwent pulmonary function test, including forced oscillation technique (respiratory oscillometry) and chest computed tomography (CT) between 2011 and 2014. Basic information such as age, body mass index (BMI), history of smoking, comorbidities, and the number of exacerbations in the previous year was obtained using a structured questionnaire. The study was conducted in accordance with the Declaration of Helsinki. The ethics committee of Kyoto University approved this study (approval No. E182 and R1660-3), and all patients provided written informed consent.
Entry criteria
The entry criteria were as follows 1) a smoking history of ≥10 pack-years; 2) a diagnosis of COPD according to the GOLD criteria; 3) availability in data of respiratory oscillometry and chest CT with appropriate quality. The exclusion criteria were as follows 1) alpha-1 antitrypsin deficiency; 2) coexisting other respiratory diseases, such as current diagnosis of asthma, interstitial pneumonia and bronchiectasis; 3) history of COPD exacerbations in the past 4 weeks; 4) a history of cancer in the past 5 years; 5) a surgical history of lobectomy. Because few females were recruited (<10% of all patients), we excluded females from this analysis.
Clinical evaluation
An exacerbation was defined as a worsening of symptoms requiring treatment with oral corticosteroids or antibiotics or both. Following the enrollment of the study, patients were coached to record the date of worsening of symptoms, taking additional medicines including antibiotics and systemic corticosteroid, and treatments in the emergency room. They visited the hospital regularly generally every 2 to 3 months and showed their prescription record to the attending physicians at each visit. Thus, the number of exacerbations could be counted precisely. When patients stopped visiting the hospital before the completion of the 5-year follow-up, the information about exacerbations from the enrollment to the last follow-up visit was used for the analyses.
Symptoms and dyspnea were evaluated using questionnaires such as modified Medical Research Council (mMRC) dyspnea scale and COPD Assessment Test (CAT) [Citation18,Citation19]. According to the GOLD 2017, patients with mMRC 0-1 and CAT <10 and exacerbation history 0 or 1 (not leading to hospital admission) were grouped into GOLD A group, patients with mMRC ≥2 or CAT ≥10 and exacerbation history 0 or 1 (not leading to hospital admission) were grouped into GOLD B group, patients with mMRC 0-1 and CAT <10 and exacerbation history ≥2 or ≥1 (leading to hospital admission) were grouped into GOLD C group, and patients with mMRC ≥2 or CAT ≥10 and exacerbation history ≥2 or ≥1 (leading to hospital admission) were grouped into GOLD D group.
Evaluation of respiratory function
Spirometry was performed after inhaling short-acting bronchodilators with a Chestac-65V (Chest MI Corp., Tokyo, Japan) [Citation20]. The predicted pulmonary function values were calculated using Japanese reference equations [Citation21]. Respiratory oscillometry was measured with a commercially available device (MostGraph-01, Chest MI Corp., Tokyo, Japan) after inhaling short-acting bronchodilators. During the examinations, patients breathed in the seated position at tidal volume through a mouthpiece with a nose clip while holding their cheeks to reduce upper airway shunting [Citation22]. The device applied a noise signal to the airway. Data were recorded for 1 min after confirmation of stable breathing. Using MostGraph-01 software (version 1.31, Chest MI Corp., Tokyo, Japan), respiratory system resistance at 5 and 20 Hz (R5 and R20), reactance at 5 Hz (X5), resonant frequency (Fres), and low-frequency reactance area (ALX) were obtained at expiration and inspiration, separately. All patients underwent at least 2 times of respiratory oscillometry to acquire within 15% variability in R5 and R20, then the best values of each index were recorded. The predicted values of respiratory oscillometry were calculated using sex, height, and BMI based on a recent report by Berger et al. [Citation23] and % of predicted R5, R20, X5, Fres, and ALX were calculated for inspiratory and expiratory values (%R5-ins, %R5-exp, %R20-ins, %R20-exp, %X5-ins, %X5-exp, %Fres-ins, %Fres-exp, %ALX-ins, and %ALX-exp, respectively).
CT image analysis
Full inspiratory chest CT was performed at the enrollment with a peak kilovoltage of 120, a 0.5-second exposure time, and autoexposure control using an Aquilion 64 scanner (Cannon Medical, Otawara, Japan). Images with a 0.5-mm slice thickness were reconstructed with a high-spatial frequency algorithm (FC56). Emphysema was quantified as the percentage of low attenuation volume less than −950 HU to the total lung volume (LAV%) [Citation24–26].
Statistics
Statistical analysis was performed using R software [Citation27]. Data were presented as mean and standard deviation (SD) (normally distributed variables), median and interquartile range (non-normally distributed variables), or the number and percentage (categorical variables). Mann-Whitney U tests were performed for the comparisons of continuous indices. Pearson’s Chi-square tests were performed for comparisons of categorical variables. Cox proportional hazard model analysis was performed to identify variables associated with exacerbations. All continuous variables were normalized by dividing them by their half SD as previously reported [Citation28,Citation29]. The false discovery rate (FDR) was calculated to conceptualize the rate of type I errors when conducting multiple comparisons. The GOLD A and B patients were divided according to %FEV1 (<50% and ≥50%) because <50% of %FEV1 is associated with an increased risk of exacerbation [Citation7,Citation8]. Moreover, the GOLD A and B patients were also divided according to % of predicted respiratory oscillometry indices. The cutoff value was determined by linear regression between %FEV1 and each % of predicted respiratory oscillometry index. The Kaplan-Meier method and log-rank test were used to compare the exacerbation rate between subgroups. Multiple pairwise comparisons with adjustment by Benjamini-Hochberg method were used to compare Kaplan-Meier curves among more than 2 groups. Multivariable Cox proportional hazards models were constructed to test whether severe impairments in physiological indices were associated with a shorter time to first exacerbation independent of the GOLD ABCD categorization and potential confounding factors including age, smoking status (pack-year), BMI, and LAV% on CT [Citation30]. A p-value less than 0.05 was considered statistically significant.
Results
Patient characteristics
Of 147 included in our previous study [Citation16], 13 were excluded because respiratory oscillometry was not performed. Supplementary Table S1 shows that clinical characteristics did not differ between patients included and excluded in this study. shows characteristics of 134 male patients with COPD included in the present analyses. The numbers (%) of patients in the GOLD A, B, C, and D groups were 48 (35.8%), 71 (53.0%), 6 (4.5%), and 9 (6.7%), respectively. Their respiratory oscillometry data are summarized in and Supplementary Table S2. The 5-year follow-up was completed in 94 (70.1%) patients. During the follow-up (median [interquartile range, IQR] = 5 [3.84-5] years), total 208 exacerbations were recorded, and 84 (62.7%) patients experienced at least one exacerbation. Among patients who did not complete the follow-up, 21 experienced at least one exacerbation whereas 19 did not. The median (IQR) of exacerbation frequency was 0.2 (0-0.6) per patient per year.
Table 1. Patients’ characteristics.
Table 2. Patients’ respiratory oscillometry characteristics.
shows the coefficient of variation (CV) of R5-ins, R5-exp, R20-ins, R20-exp, Fres-ins, Fres-Ex, ALX-ins, and ALX-exp in 113 patients whose raw data of multiple measurements of respiratory oscillometry within a day were available. Regarding the reactance measures, the CV was smaller in Fres-ins than in Fres-exp, ALX-ins, and ALX-exp (CV% = 4.3%, 6.0%, 13.1%, and 21.3%, respectively).
Table 3. The coefficient of variation of multiple respiratory oscillometry measurements within a day.
Associations of spirometry and respiratory oscillometry indices with exacerbation in all patients and in patients without a history of frequent exacerbations (GOLD A and B)
As shown in , univariable Cox proportional hazard models were performed to investigate whether each physiological index was associated with an exacerbation occurrence over 5 years. To compare the relative impacts between these indices, normalization was performed by dividing them by their half SD. Consequently, the hazard ratio (HR) for a decrease in %FEV1 (HR,1.36; 95% CI 1.21–1.53; p < 0.001; FDR < 0.001) and an increase in %Fres-exp (HR, 1.20; 95% CI, 1.10–1.32; p < 0.001; FDR < 0.001) followed by those for increases in %Fres-ins (HR, 1.18; 95% CI, 1.08-1.29; p < 0.001; FDR < 0.001) and %ALX-ins (HR, 1.18; 95% CI, 1.08-1.29; p < 0.001; FDR < 0.001) were higher than HR for the other indices. When the same analysis was limited to the GOLD A and B groups, a decrease in %FEV1 (HR, 1.33; 95% CI, 1.18-1.50; p < 0.001; FDR < 0.001), increases in %Fres-ins (HR, 1.19; 95% CI, 1.08-1.31; p < 0.001; FDR < 0.01) and %Fres-exp (HR,1.19; 95% CI, 1.08-1.32; p < 0.001; FDR < 0.01) showed the highest HR among all physiological indices. Regarding CT imaging, the extent of emphysema assessed as LAV% also showed an increase in HR (HR = 1.21; 95% CI = 1.09-1.34; p < 0.01).
Table 4. Univariable cox proportional hazard models to explore an association of physiological indices with a risk of future exacerbations.
Respiratory oscillometry-based categorization and exacerbation occurrences in patients without a history of frequent exacerbation (GOLD A and B)
To determine the cutoff value of %Fres-ins to divide the GOLD A and B groups, the linear regression between %FEV1 and %Fres-ins was performed. There was a close association between %FEV1 and %Fres-ins (r = −0.70, p < 0.001 on Pearson’s correlation test). shows that 50% in %FEV1 corresponded to 135% in %Fres-ins. shows representative data of respiratory reactance in the GOLD B patients with high and low %Fres-ins (253% and 70%, respectively). compares clinical features between high and low %Fres-ins in the GOLD A and B patients. In the GOLD A group, patients with high %Fres-ins had lower BMI and %FEV1. In the GOLD B group, patients with high %Fres-ins had lower BMI and %FEV1 and higher LAV% than those with low %Fres-ins.
Figure 1. Association between forced expiratory volume in 1 sec and inspiratory resonant frequency in patients with COPD and colored 3-Dimensional visualization of respiratory changes in reactance in GOLD group B patients.
(A) % of predicted forced expiratory volume in 1s (%FEV1) was associated with % predicted of resonant frequency at inspiration (%Fres-ins). The linear regression showed that 50% in %FEV1 corresponded to 135% in % Fres-ins. (B) Colored 3-Dimensional visualization of respiratory changes in reactance in GOLD group B patients with low inspiratory resonant frequency (Fres-ins, 70%, left) and high Fres (253%, right).
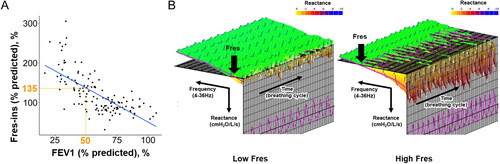
Table 5. Clinical and physiological comparisons between patients with high and low inspiratory resonant frequency.
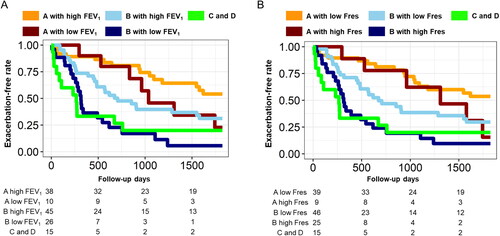
compares the time to the first exacerbation when the Group A and B patients were divided into those with mild and severe physiological impairments based on %FEV1 (≥50% and <50%) or the % Fres-ins (≥135% and <135%). Consequently, the time to the first exacerbation in the Group B with low FEV1 was shorter than that in the Group B with high FEV1, but comparable to that in the Group C and D. Moreover, the time to the first exacerbation in the Group B with high Fres was shorter than that in the Group B with low Fres, but comparable to that in the Group C and D.
Figure 2. Further categorization of the GOLD A and B groups using FEV1 and resonant frequency to compare the time to the first future exacerbation over 5 years.
(A) Based on a cutoff of 50% for % of predicted forced expiratory volume in 1 s (%FEV1), the GOLD A and B groups were further divided into Group A with high FEV1, Group A with low FEV1, Group B with high FEV1 and Group B with low FEV1. A Group C D indicates a combined group from the GOLD C and D groups. (B) Based on a cutoff for % predicted of resonant frequency at inspiration (%Fres-ins = 135%), the GOLD A and B groups were further divided into Group A with high Fres, Group A with low Fres, Group B with high Fres, and Group B with low Fres.
As shown in , multivariable Cox proportional hazards models were constructed to test whether low %FEV1 group and high %Fres-ins group were associated with an exacerbation occurrence independent of the GOLD ABCD categorization and other potential confounding factors. Due to a close correlation between %FEV1 and %Fres-ins as shown in , %FEV1 and %Fres-ins were separately included in the models to avoid collinearity. The results revealed that %FEV1 <50% (HR, 1.81; 95% CI, 1.01-3.25; p < 0.05) and high %Fres-ins >135% (HR, 1.85; 95% CI, 1.11-3.07; p = 0.018) were significantly associated with a shorter time to the first exacerbations, independent of age, BMI, smoking packyear, LAV%, and the GOLD group (A vs B). In these models, the GOLD group (A vs B) was associated and LAV% tended to be associated with a shorter time to the first exacerbation. Moreover, Supplementary Table S3 and S4 shows that %Fres-exp > 170% (HR, 1.74; 95% CI, 1.02-2.96; p < 0.05) was also associated with a shorter time to the first exacerbation independent of age, BMI, smoking packyear, LAV%, and the GOLD group (A vs B) whereas X5, ALX, R5, and R20 were not.
Table 6. Multivariable Cox proportional hazard models to explore relative contributions of baseline physiological impairments to future exacerbations.
Discussion
This study showed that in addition to FEV1, respiratory oscillometry indices were associated with exacerbation occurrences in patients categorized in the GOLD A and B groups. Moreover, the multivariable Cox proportional hazard models of these patients showed that lower FEV1 and higher Fres were significantly associated with a shorter time to the first exacerbation during the 5-year follow-up even after adjustment for the GOLD group (A vs B), age, smoking history, BMI, and emphysema severity on CT. Both spirometry and respiratory oscillometry were used in this study based on the assumption that respiratory oscillometry and spirometry potentially reflect different physiological aspects in patients with COPD. Respiratory oscillometry allows evaluating respiratory mechanics by measuring pressure and airflow and providing the impedance that comprises the respiratory system resistance and reactance [Citation31]. While the respiratory resistance assessed using R5 and R20 mainly reflects airway lumen caliber, the respiratory reactance assessed using X5, Fres, and ALX, reflects the elastic and inertial properties of lung [Citation32,Citation33].
Despite the distinct features in spirometry and respiratory oscillometry, no difference was found in terms of risk assessments of exacerbations. Moreover, there was a close association between %FEV1 and %Fres-ins. This is consistent with a previous report [Citation34]. These suggest that respiratory oscillometry could be an alternative method to monitor lung function and estimate clinical outcomes periodically in patients with COPD.
The reactance on the respiratory oscillometry is affected by emphysema in patients with COPD as emphysema alters the elastic property of the lungs [Citation33]. Additionally, the reactance reflects ventilation inhomogeneity that is induced by both emphysema and airway disease [Citation33,Citation35,Citation36]. Because emphysema, airway disease, and ventilation defects are associated with a high risk of exacerbations [Citation30,Citation37], this study focused on the reactance. The univariable cox proportional hazard models of the GOLD A and B patients also showed that %Fres-ins and %Fres-exp had higher HR values than the other oscillation indices. Therefore, Fres was selected as the main respiratory oscillation index.
The intra-individual variability (CV) of Fres-ins was smaller than that of other reactance indices such as Fres-exp, ALX-ins, and ALX-exp. This is consistent with a previous study that showed a relatively smaller CV of Fres (10%) than that of ALX (26%) [Citation38]. A previous study showed that the respiratory oscillometry remains constant over 3 months but is relatively more variable than FEV1 [Citation13]. And a study using home-based monitoring of respiratory oscillometry showed that a variability of the respiratory oscillometry is useful for early detection of exacerbations [Citation14]. Further studies are needed to reveal the nature and clinical relevance of a variability of the respiratory oscillometry.
Previous studies showed associations of the respiratory oscillometry indices with clinical features in patients with COPD. In the ECLIPSE study including 2054 patients with COPD [Citation13], FEV1/FVC and %FEV1 were lower than in this study (45% vs 52%, and 48% vs 59%) while R5 and Fres were higher (R5 = 0.49 and Fres = 20.7 in the ECPIPSE and R5-ins = 0.21, R5-exp = 0.27, Fres-ins = 11.7, and Fres-exp = 14.21 in this study). This suggests that the respiratory oscillometry values in this study are reasonable for the spirometry severity. Moreover, the data in showed that LAV% (emphysema severity) was higher in the GOLD B group patients with high %Fres-ins than in those with low %Fres-ins whereas LAV% did not significantly differ between the GOLD A group patients with high and low %Fres-ins. This is in line with the finding in the ECLIPSE study that showed weak associations between emphysema and respiratory system impedance in patients with COPD.
In this study, 36% and 53% patients were assigned to the GOLD A and B groups, respectively, and only 11% patients were assigned to the GOLD C and D groups. The lower rate of frequent exacerbations is consistent with former studies in Japan [Citation39]. Moreover, the found prevalence of the GOLD A group (36%) is inconsistent with the previous report by Oishi et al. who showed that 49% was assigned to the GOLD A group. This inconsistency is because this study used both mMRC and CAT, whereas the study by Oishi et al. used only mMRC. Although previous studies have used only mMRC to evaluate symptoms [Citation10,Citation11,Citation40], mMRC <2 cannot correspond to CAT < 10 [Citation41]. Thus, the single use of mMRC would yield different outputs compared to the method using both mMRC and CAT. Furthermore, in another study that used both mMRC and CAT for symptomatic evaluation, the prevalence of the GOLD A group was 60% patients [Citation42], which is higher than that of this study. We postulate that the different study locations and medical facility (university hospital versus community hospital) in the two studies have affected the discrepancy.
Regarding the mechanistic link between physiological impairments and exacerbations in patients with COPD, Zider et al. performed a meta-analysis and showed that an increase of 100 ml in FEV1 by bronchodilators reduced the rate of exacerbation by 21% (n = 80718, p < 0.001) [Citation43]. Those authors suggested that increased airway patency by bronchodilator improves clearance of secretions and diminishes bacterial colonization, which can decrease airway inflammation and exacerbation risks. Therefore, we postulate that worsening of FEV1 and Fres-Ins can reflect impairment in airway patency and predict future exacerbation in patients in the GOLD A and B groups. Moreover, because the reactance is associated with the closure of airways during breathing and airway closure is associated with lung hyperinflation [Citation44,Citation45], the found association between Fres-ins and exacerbation risks suggests that greater airway closure increases lung hyperinflation and predispose to further exacerbations in patients with COPD.
The Kaplan Meier curves showed less clear separation in the Group A patients with high and low %Fres-ins (or %FEV1) than in the Group B patients. This might be because the risk of exacerbations is lower in less symptomatic patients (GOLD A) than symptomatic patients (GOLD B) [Citation46] and this lower risk of exacerbations might outweigh the impact of impaired lung function.
The multivariable models showed that in addition to physiological impairments on respiratory oscillometry and spirometry, the GOLD group (A vs B) was also associated and LAV% tended to be associated with the time to the first exacerbation. These findings are consistent with previous data showing that symptoms and emphysema on CT are associated with exacerbations [Citation9,Citation30,Citation47]. However, BMI was not associated with exacerbation in the same model although studies have shown associations between low BMI and a risk of exacerbations [Citation47,Citation48]. These are possibly because the impacts of physiological impairments, symptoms, and emphysema on exacerbations may be larger than those of BMI in patients with COPD.
There were some limitations in this study. First, the sample size was relatively small. Because the present cohort included very few females (<10% of the total number), we decided to include only males in the study. The generatability of the present findings to female patients with COPD is unclear. Second, this study used the prediction equations of respiratory oscillometry indices generated by Berger et al. [Citation23] who used a larger cohort of healthy urban subjects. However, the subjects in that study were younger (age 46.7 years), taller (height 1.77 m) and had a higher BMI (26.5 kg/m2), than those in this study. Moreover, although this study measured the inspiratory and expiratory respiratory oscillation data, separately, the equation by Berger et al. did not provide predicted values at inspiration and expiration. To investigate whether different equations could affect the present findings, we reanalyzed the respiratory oscillation data. When using prediction equations generated from Chinese subjects [Citation49], we found that high %Fres-ins was associated with exacerbation occurrences in the GOLD B patients (Supplementary Figure S1A). Additionally, although the number of subjects was small, a study in Norway reported prediction equations that allowed differentiation between inspiration and expiration [Citation38]. By using those equations, we also confirmed that the results were not changed (Supplementary Figure S1B). While we acknowledge that making prediction equations for our study population is extremely important, we believe that influences of the selection of prediction equations on the present findings might be small.
In conclusion, the reactance index on respiratory oscillation such as inspiratory Fres was closely associated with FEV1 on spirometry and higher Fres was associated with a shorter time to the first exacerbations independent of the GOLD group (A vs B) in COPD patients with no frequent exacerbation history. Physiological evaluation using respiratory oscillometry may be useful to estimate a risk of exacerbations in patients with COPD.
Declaration of interest
The authors report no conflicts of interest in this work.
Additional information
Funding
References
- Lozano R, Naghavi M, Foreman K, et al. Global and regional mortality from 235 causes of death for 20 age groups in 1990 and 2010: a systematic analysis for the global burden of disease study 2010. Lancet. 2012;380(9859):2095–2128. DOI:10.1016/S0140-6736(12)61728-0
- Donaldson GC, Seemungal TA, Bhowmik A, et al. Relationship between exacerbation frequency and lung function decline in chronic obstructive pulmonary disease. Thorax. 2002;57(10):847–852. DOI:10.1136/thorax.57.10.847
- Donaldson GC, Wilkinson TM, Hurst JR, et al. Exacerbations and time spent outdoors in chronic obstructive pulmonary disease. Am J Respir Crit Care Med. 2005;171(5):446–452. DOI:10.1164/rccm.200408-1054OC
- Seemungal TA, Donaldson GC, Paul EA, et al. Effect of exacerbation on quality of life in patients with chronic obstructive pulmonary disease. Am J Respir Crit Care Med. 1998;157(5):1418–1422. DOI:10.1164/ajrccm.157.5.9709032
- Soler-Cataluña JJ, Martínez-García MA, Román Sánchez P, et al. Severe acute exacerbations and mortality in patients with chronic obstructive pulmonary disease. Thorax. 2005;60(11):925–931. DOI:10.1136/thx.2005.040527
- Hurst JR, Vestbo J, Anzueto A, Evaluation of COPD Longitudinally to Identify Predictive Surrogate Endpoints (ECLIPSE) Investigators, et al. Susceptibility to exacerbation in chronic obstructive pulmonary disease. N Engl J Med. 2010;363(12):1128–1138. DOI:10.1056/NEJMoa0909883
- Hoogendoorn M, Feenstra TL, Hoogenveen RT, et al. Association between lung function and exacerbation frequency in patients with COPD. Int J Chron Obstruct Pulmon Dis. 2010;5:435–444. DOI:10.2147/COPD.S13826
- Beeh KM, Glaab T, Stowasser S, et al. Characterisation of exacerbation risk and exacerbator phenotypes in the POET-COPD trial. Respir Res. 2013;14:116. DOI:10.1186/1465-9921-14-116
- Kim J, Lee CH, Lee MG, et al. Acute exacerbation according to GOLD 2017 categories in patients with chronic obstructive pulmonary disease. Arch Bronconeumol. 2019;55(8):414–420. DOI:10.1016/j.arbres.2019.02.004
- Oishi K, Hirano T, Hamada K, et al. Characteristics of 2017 GOLD COPD group A: a multicenter cross-sectional CAP study in Japan. Int J Chron Obstruct Pulmon Dis. 2018;13:3901–3907. DOI:10.2147/COPD.S181938
- Han MZ, Hsiue TR, Tsai SH, et al. Validation of the GOLD 2017 and new 16 subgroups (1A-4D) classifications in predicting exacerbation and mortality in COPD patients. COPD. 2018; 13:3425–3433. DOI:10.2147/COPD.S179048
- Gupta N, Sachdev A, Gupta D. Oscillometry-A reasonable option to monitor lung functions in the era of COVID-19 pandemic. Pediatr Pulmonol. 2021;56(1):14–15. DOI:10.1002/ppul.25121
- Crim C, Celli B, Edwards LD, ECLIPSE investigators, et al. Respiratory system impedance with impulse oscillometry in healthy and COPD subjects: ECLIPSE baseline results. Respir Med. 2011;105(7):1069–1078. DOI:10.1016/j.rmed.2011.01.010
- Zimmermann SC, Huvanandana J, Nguyen CD, et al. Day-to-day variability of forced oscillatory mechanics for early detection of acute exacerbations in COPD. Eur Respir J. 2020;56(3):1901739. DOI:10.1183/13993003.01739-2019
- Tanabe N, Muro S, Hirai T, et al. Impact of exacerbations on emphysema progression in chronic obstructive pulmonary disease. Am J Respir Crit Care Med. 2011;183(12):1653–1659. DOI:10.1164/rccm.201009-1535OC
- Tanabe N, Sato S, Oguma T, et al. Associations of airway tree to lung volume ratio on computed tomography with lung function and symptoms in chronic obstructive pulmonary disease. Respir Res. 2019;20(1):77. DOI:10.1186/s12931-019-1047-5
- Tanimura K, Sato S, Fuseya Y, et al. Quantitative assessment of erector spinae muscles in patients with chronic obstructive pulmonary disease. Novel chest computed tomography-derived index for Prognosis. Ann Am Thorac Soc. 2016;13(3):334–341. DOI:10.1513/AnnalsATS.201507-446OC
- Jones PW, Harding G, Berry P, et al. Development and first validation of the COPD assessment test. Eur Respir J. 2009;34(3):648–654. DOI:10.1183/09031936.00102509
- Tsuda T, Suematsu R, Kamohara K, et al. Development of the Japanese version of the COPD assessment test. Respir Investig. 2012;50(2):34–39. DOI:10.1016/j.resinv.2012.05.003
- Miller MR, Hankinson J, Brusasco V, ATS/ERS Task Force, et al. Standardisation of spirometry. Eur Respir J. 2005;26(2):319–338. DOI:10.1183/09031936.05.00034805
- Kubota M, Kobayashi H, Quanjer PH, Clinical Pulmonary Functions Committee of the Japanese Respiratory Society, et al. Reference values for spirometry, including vital capacity, in Japanese adults calculated with the LMS method and compared with previous values. Respir Investig. 2014;52(4):242–250. DOI:10.1016/j.resinv.2014.03.003
- Mori K, Shirai T, Mikamo M, et al. Colored 3-dimensional analyses of respiratory resistance and reactance in COPD and asthma. Copd. 2011;8(6):456–463. DOI:10.3109/15412555.2011.626818
- Berger KI, Wohlleber M, Goldring RM, et al. Respiratory impedance measured using impulse oscillometry in a healthy urban population. ERJ Open Res. 2021;7(1):00560–2020. DOI:10.1183/23120541.00560-2020
- Gevenois PA, De Vuyst P, de Maertelaer V, et al. Comparison of computed density and microscopic morphometry in pulmonary emphysema. Am J Respir Crit Care Med. 1996;154(1):187–192. DOI:10.1164/ajrccm.154.1.8680679
- Shimizu K, Tanabe N, Tho NV, et al. Per cent low attenuation volume and fractal dimension of low attenuation clusters on CT predict different long-term outcomes in COPD. Thorax. 2020;75(2):116–122. DOI:10.1136/thoraxjnl-2019-213525
- Shima H, Tanabe N, Sato S, et al. Lobar distribution of non-emphysematous gas trapping and lung hyperinflation in chronic obstructive pulmonary disease. Respir Investig. 2020;58(4):246–254. DOI:10.1016/j.resinv.2020.01.001
- Team RC. R: A Language and Environment for Statistical Computing. 2015. Available from: http://www.R-project.org/.
- Waschki B, Kirsten A, Holz O, et al. Physical activity is the strongest predictor of all-cause mortality in patients with COPD: a prospective cohort study. Chest. 2011;140(2):331–342. DOI:10.1378/chest.10-2521
- Tanabe N, Sato S, Tanimura K, et al. Associations of CT evaluations of antigravity muscles, emphysema and airway disease with longitudinal outcomes in patients with COPD. Thorax. 2021;76(3):295–297. DOI:10.1136/thoraxjnl-2020-215085
- Han MK, Kazerooni EA, Lynch DA, COPDGene Investigators, et al. Chronic obstructive pulmonary disease exacerbations in the COPDGene study: associated radiologic phenotypes. Radiology. 2011;261(1):274–282. DOI:10.1148/radiol.11110173
- Oostveen E, MacLeod D, Lorino H, ERS Task Force on Respiratory Impedance Measurements, et al. The forced oscillation technique in clinical practice: methodology, recommendations and future developments. Eur Respir J. 2003;22(6):1026–1041. DOI:10.1183/09031936.03.00089403
- Shirai T, Kurosawa H. Clinical application of the forced oscillation technique. Intern Med. 2016;55(6):559–566. DOI:10.2169/internalmedicine.55.5876
- Lundblad LKA, Siddiqui S, Bossé Y, et al. Applications of oscillometry in clinical research and practice. Canadian J Respir Critical Care Sleep Med. 2021;5(1):54–68. DOI:10.1080/24745332.2019.1649607
- Kolsum U, Borrill Z, Roy K, et al. Impulse oscillometry in COPD: identification of measurements related to airway obstruction, airway conductance and lung volumes. Respir Med. 2009;103(1):136–143. DOI:10.1016/j.rmed.2008.07.014
- Kirby M, Svenningsen S, Kanhere N, et al. Pulmonary ventilation visualized using hyperpolarized helium-3 and xenon-129 magnetic resonance imaging: differences in COPD and relationship to emphysema. J Appl Physiol (1985). 2013;114(6):707–715. DOI:10.1152/japplphysiol.01206.2012
- Eddy RL, Westcott A, Maksym GN, et al. Oscillometry and pulmonary magnetic resonance imaging in asthma and COPD. Physiol Rep. 2019;7(1):e13955. DOI:10.14814/phy2.13955
- Kirby M, Pike D, Coxson HO, et al. Hyperpolarized (3)He ventilation defects used to predict pulmonary exacerbations in mild to moderate chronic obstructive pulmonary disease. Radiology. 2014;273(3):887–896. DOI:10.1148/radiol.14140161
- Aarli BB, Eagan TM, Ellingsen I, et al. Reference values for within-breath pulmonary impedance parameters in asymptomatic elderly. Clin Respir J. 2013;7(3):245–252. DOI:10.1111/j.1752-699X.2012.00312.x
- Ishii T, Nishimura M, Akimoto A, et al. Understanding low COPD exacerbation rates in Japan: a review and comparison with other countries. Int J Chron Obstruct Pulmon Dis. 2018;13:3459–3471. DOI:10.2147/COPD.S165187
- Cabrera lópez C, casanova macario C, marín trigo JM, et al. Comparison of the 2017 and 2015 global initiative for chronic obstructive lung disease reports: impact on grouping and outcomes. Am J Respir Crit Care Med. 2018;197(4):463–469. DOI:10.1164/rccm.201707-1363OC
- Jones PW, Adamek L, Nadeau G, et al. Comparisons of health status scores with MRC grades in COPD: implications for the GOLD 2011 classification. Eur Respir J. 2013;42(3):647–654. DOI:10.1183/09031936.00125612
- Kobayashi S, Hanagama M, Ishida M, et al. Clinical characteristics and outcomes in japanese patients with COPD according to the 2017 GOLD classification: the ishinomaki COPD network registry. COPD. 2018;13:3947–3955. DOI:10.2147/COPD.S182905
- Zider AD, Wang X, Buhr RG, et al. Reduced COPD exacerbation risk correlates with improved FEV(1): a Meta-Regression analysis. Chest. 2017;152(3):494–501. DOI:10.1016/j.chest.2017.04.174
- Lutchen KR, Gillis H. Relationship between heterogeneous changes in airway morphometry and lung resistance and elastance. J Appl Physiol (1985). 1997;83(4):1192–1201. DOI:10.1152/jappl.1997.83.4.1192
- Lundblad LK, Thompson-Figueroa J, Allen GB, et al. Airway hyperresponsiveness in allergically inflamed mice: the role of airway closure. Am J Respir Crit Care Med. 2007;175(8):768–774. DOI:10.1164/rccm.200610-1410OC
- Mackay AJ, Donaldson GC, Patel AR, et al. Usefulness of the chronic obstructive pulmonary disease assessment test to evaluate severity of COPD exacerbations. Am J Respir Crit Care Med. 2012;185(11):1218–1224. DOI:10.1164/rccm.201110-1843OC
- Suzuki M, Makita H, Ito YM, Hokkaido COPD Cohort Study Investigators, et al. Clinical features and determinants of COPD exacerbation in the Hokkaido COPD cohort study. Eur Respir J. 2014;43(5):1289–1297. DOI:10.1183/09031936.00110213
- Putcha N, Anzueto AR, Calverley PMA, et al. Mortality and exacerbation risk by body mass index in patients with COPD in TIOSPIR and UPLIFT. Ann Am Thorac Soc. 2022;19(2):204–213. DOI:10.1513/AnnalsATS.202006-722OC
- Liang XL, Gao Y, Guan WJ, et al. Reference values of respiratory impedance with impulse oscillometry in healthy chinese adults. J Thorac Dis. 2021;13(6):3680–3691. DOI:10.21037/jtd-20-3376