
 ?Mathematical formulae have been encoded as MathML and are displayed in this HTML version using MathJax in order to improve their display. Uncheck the box to turn MathJax off. This feature requires Javascript. Click on a formula to zoom.
Abstract
Chronic obstructive pulmonary disease (COPD) is a progressive inflammatory disease with pulmonary and extra-pulmonary complications. Due to the disease’s systemic nature, many investigations investigated the genetic alterations in various biological samples. We aimed to infer causal genes in COPD’s pathogenesis in different biological samples using elastic-net logistic regression and the Structural Equation Model. Samples of small airway epithelial cells, bronchoalveolar lavage macrophages, lung tissue biopsy, sputum, and blood samples were selected (135, 70, 235, 143, and 226 samples, respectively). Elastic-net Logistic Regression analysis was implemented to identify the most important genes involved in COPD progression. Thirty-three candidate genes were identified as essential factors in the pathogenesis of COPD and regulation of lung function. Recognized candidate genes in small airway epithelial (SAE) cells have the highest area under the ROC curve (AUC = 97%, SD = 3.9%). Our analysis indicates that macrophages and epithelial cells are more influential in COPD progression at the transcriptome level.
Introduction
Chronic obstructive pulmonary disease (COPD) is a progressive inflammatory disease characterized by airway obstruction that is among the first three causes of death worldwide [Citation1,Citation2]. Clinical presentations of COPD include emphysema, small airway obstructions, and chronic bronchitis.
Although the precise underlying processes of COPD pathogenesis are still unknown, the range of long-term exposure to many types of xenobiotics, such as smoking, occupational hazardous chemichals, and hereditary background, is stated [Citation3], with no effective therapy or medicine [Citation4,Citation5]. Cigarette smoking is the most significant risk factor for the development of COPD [Citation3,Citation6]. Nonetheless, more than 20% of COPD patients are not smokers or ex-smokers [Citation7,Citation8]. Furthermore, additional research has shown that smokes emitted by solid fuels used for cooking or heating are not connected with COPD ethiology [Citation9].
As a systemic multi-organ disease, multiple causes could alter the nature and consequences of COPD at the genomic level. Despite various transcriptomics studies on COPD, the critical role of hidden gene signatures is not clarified in different clinical samples [Citation10–13]. It seems that a comprehensive analysis of heterogeneous biological samples is mandatory to find novel candidate genes in systemic pathogenesis and progression of COPD. The progression of COPD severity depends on the interaction of different cells present in the lung microenvironment. Various techniques have been utilized to interpret the disease complexity and pathogenesis elements. Many studies have been conducted based on top-down and/or bottom-up strategies to identify key players and regulators of the pathogenesis process, but nearly none investigated the level of direct/indirect impact of different cells on the staging and progression process of COPD. Specific statistical classification and prediction approaches can satisfy the need for high throughput high-dimensional transcriptome datasets [Citation14]. Microarray analysis studies permit statistical and mathematical approaches to understand the association between thousands of genes in a disease’s specific stages. One of the primary challenges in microarray analysis is identifying genes, or groups of genes, that are differentially expressed in a disease or at different stages. More recently, machine-based learning algorithms have increasingly gained attention in bioinformatics and biology research [Citation15,Citation16]. In contrast, (regularization) based regression models (e.g. elastic-net logistic regression) have been widely used in microarray analysis [Citation17].
We hypothesized that the different biological samples are not equally involved in the progression of COPD at the transcriptomics level. Also, we questioned if it would be possible to investigate the direct/indirect interaction among them. Therefore, this project was designed to identify novel important genes within different biological samples to provide novel therapeutic targets in COPD. Here, we fitted an elastic-net logistic regression model on transcriptome datasets to overcome overfitting and multi-collinearity issues, as common problems arise in the high throughput data analysis while representing a sparse and interpretable model in high dimensional datasets [Citation12,Citation18]. Following the identification of novel effective genes, structural equation modeling (SEM) was utilized to assess simultaneous direct and indirect effects of candidate genes and biological samples on COPD progression.
Methods
Datasets and data processing
A systematic search was performed in the PubMed database with the search strategy of COPD OR chronic obstructive pulmonary disease) AND (epitheli* OR macrophage OR basophil OR biopsy OR sputum OR BAL OR Bronchoalveolar lavage OR blood OR PBMC OR Lung tissue) AND (microarray OR transcriptomics OR RNA-seq). Then, omics data repository databases were searched to enrich the archived studies. After removing the duplicates, the studies with more than fifty samples and different stages of COPD with publicized raw data were included. Finally, studies were selected based on mostly matching transcriptomics platforms to minimize the cross-platform biases. The demographic and historical data of the selected datasets are provided in supplementary file 1.
Raw transcriptomics data from small airway epithelial cells (SAE) (GSE20257) [Citation19], alveolar macrophages (GSE13896) [Citation20], lung tissue (GSE47460) [Citation21–23], sputum (GSE22148) [Citation24], and blood samples (GSE54837) [Citation25] were downloaded from GEO database. Initially, raw expression data were combined by the R package of "merging", as the combined dataset for each of biological samples included healthy controls and the patients in the GOLD stages of COPD [1–4]. After normalization of the datasets, the batch effect was removed and statistical comparison was performed by "Affy", "SVA", and "Limma" R packages, respectively [Citation26,Citation27]. The false discovery rate was corrected using the Benjamini-Hochberg correction method. The cutoff of the adjusted p-value (<0.0001) or absolute fold-change >2 was applied for the selection of differentially expressed genes. Since there were no healthy controls in sputum and blood datasets, the average normalized/standardized expression value of healthy controls from other datasets was used. Then Sensitivity analysis was performed to assess the robustness of the results obtained by differential expression analysis.
Elastic-net penalized logistic regression
Elastic-net logistic regression as a regularization method can be used for gene selection [Citation28]. This statistical learning method was introduced as a compromise between ridge and lasso penalties. Elastic-net penalty combines the strengths of both ridge and lasso [Citation29]. Based on the simulation and experimental studies on the genomic selection using regularized linear regression models, the elastic net regularization was found to outperform ridge and extensions of LASSO in high dimensional data [Citation12, Citation30]. This penalty selects groups of correlated genes. Besides, it possesses optimized predictive performance compared with LASSO and ridge in the transcriptomics data [Citation12]. Elastic-net logistic regression methods were performed by the "glmnet" R package [Citation31]. Candidate genes were identified based on the below equation:
is a vector of gene expression parameters, and lambda is tuning parameters for LASSO and ridge penalties, respectively. Beta parameters were estimated by coordinate descent as an optimization algorithm [Citation31]. The best estimates for lambda parameters were derived by K-fold cross-validation. Alpha as a hyper-parameter, controls the distribution between the LASSO and ridge penalties. In this study, alpha was considered as a fixed value of 0.5.
Also, the statistical comparison was performed by the "pROC" R package between areas under the Roc curves (AUCs) for identified candidate genes in all biological samples [Citation32]. The identification of novel candidate genes was performed by the elastic-net logistic regression method based on the trend of gene expression data over gold stages of COPD, and then, enrichment was performed using the ClueGO plugin of Cytoscape software.
Structural equation modeling
Structural equation modeling (SEM) includes causal modeling, analysis of covariance structures, and latent variable models. This modeling has many advantages as a generalization of multivariate multiple regression compared with conventional regression. SEM can assess multiple regression equations simultaneously, allowing identifying the strength and sign of direct and indirect effects for complex causal diagrams [Citation33,Citation34].
Path standardized coefficients (β) were calculated as the effect size that is free of scale and is robust against heterogeneity in the integration of genomics datasets. Goodness of fit (GOF) indices (e.g. The Root Mean Square Error of Approximation (RMSEA)<0.08, Standardized Root Mean Square Residual (SRMR)<0.08) were applied for assessing the fitness of the model. SEM was performed using the "lavaan" R package [Citation35]. Numerical estimation of path coefficients (β) was derived by an iterative maximum likelihood algorithm. Multiple regression equations in SEM are represented below:
Y in each equation is the number of stages in the biological sample. Beta coefficient is the strength and sign of candidate genes involved in the progression of COPD (Y).
Cross-validation, stability, and accuracy
The repeated k-fold cross-validation by bootstrapping is a good strategy to reduce the high variability of cross-validation [Citation36]. Sensitivity analysis was performed to check the robustness of the results against changes in the training sets [Citation37]. In the present study, the algorithm split the data set using repeated random 100 times sub-sampling in 5-fold cross-validation, permuting the sample labels every time. Cross-validated performances were summarized by observed sensitivities and specificities with standard deviation (SD). Furthermore, the area under the Receiver Operator Characteristic (ROC) curve (AUC) was used to calculate the precision of performance of the classifiers [Citation38,Citation39]. We used the bootstrap technique, which enables us to predict the fit of a model to a hypothetical testing set when an independent dataset is not available. The bootstrap approach allows us to use a computer to mimic the process of obtaining new datasets so that we can estimate the variability of our estimate without generating additional samples. Rather than repeatedly obtaining an independent dataset, we instead obtain distinct datasets by repeatedly sampling observations from the original data sets with replacement. To validate the selected genes with previous studies, literature mining was performed in PubMed. Interactive cluster heatmap was applied by the "heatmaply" R package [Citation40].
Results
Differential analysis of genes expression data
Removing batch effects and normalizing data, according to the differential expression analysis of COPD vs. healthy samples, 918 probes from SAE, 1942 probes from lung tissue, 134 probes from blood, 1074 probes from alveolar macrophages, and 5768 probes from sputum samples were identified as the differentially expressed genes (adjusted p-value < 0.0001 or absolute fold-change >2) ().
Table 1. The summarized data indicating the primary, qualified, and differentially expressed probes in each biological sample.
Gene selection and prediction
After adjustment of the effects of confounding variables (e.g. age and smoking status) by using Elastic-net penalized logistic regression, the total number of 33 genes was selected as associated factors with COPD progression with AUCs, sensitivities, and specificities in each biological sample (). According to statistical comparisons of AUCs of selected genes in different biological samples, genes identified in SAE cells and macrophages performed significantly better to predict the disease progression/stage. However, the AUC of the candidate genes in SAE samples was not significantly different (p-value = 0.478) compared to the AUC in macrophages to predict the disease stage ().
Figure 1. Statistical comparison of AUCs among different biological samples based on the identified genes (* indicated significant difference at the level of 0.05, ** indicated significant difference at the level of 0.01, ***indicated significant difference at the level of 0.001).
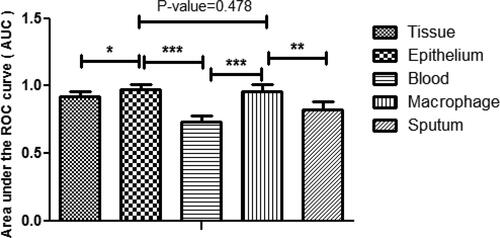
Table 2. Probes and corresponding 33 candidate genes by elastic-net penalized logistic regression model for the association between the genes with COPD progression.
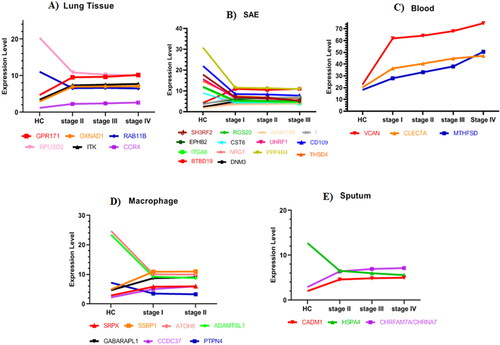
Functional enrichment classified the novel genes into five groups, including "Regulation of CoA-transferase activity", "Vacuole organization", "dendritic spine organization", and "Cell adhesion molecules" (supplementary file 2). The expression level of candidate genes was measured and graphed among all biological samples (Lung Tissue, SAE, Blood, Macrophage, and Sputum) in each healthy and all COPD stages ().
Figure 2. (A) Expression level of CCR4, ITK, RPUSD2, RAB11B, OXNAD1, and GPR171 in lung tissue. (B) Expression level of BTBD19, THSD4, PPP4R4, NRG1, DNM3, ITGA6, D109, UHRF1, CST6, EPHB2, CDKN2A, KIAA1199, RGS20, and SH3RF2 in SAE. (C) Expression level of MTHFSD, CLEC7A, and VCAN in Blood. (D) Expression level of PTPN4, CCDC37, GABARAPL1, ADAMTSL1, ATOH8, SSBP1, and SRPX in macrophages. (E) Expression level of CHRFAM7A/CHRNA7, HSPA4, and CADM1 in sputum.
For plotting co-expression patterns of selected genes among the patients, heatmap with agglomerative hierarchical clustering were plotted (). Co-expression pattern of the selected genes resulted in four major clusters in COPD patients, including (OXNAD1, CCR4, ITK, and GPR171), (ADAMTSL1, THSD4, PPP4R4, ITGA6), (BTBD19, EPHB2, CHRFAM7A, SSBP1, GABARAPL1, ATOH8, PTPN4, MTHFSD, CCDC37, NRG1, CADM1, CLEC7A, VCAN), and (KIAA1199, DNM3, SRPX, CDKN2A, RPUSD2, RAB11B, HSPA4, RGS20, SH3RF2, CST6, CD109, UHRF1) based on the similarity of correlation coefficients/co-expression pattern (). Of these 33 genes, 24 have previously been reported in the literature to be associated with lung diseases, including COPD or other lung disorders (). THSD4, PPP4R4, CDKN2A, CADM1, and NRG1, which has previously been detected in GWAS studies to determine single nucleotide polymorphisms (SNPs) in COPD and asthma, were among the mentioned 24 genes (https://www.ebi.ac.uk/gwas/home) [Citation41–43]. However, we identified nine genes that have not been previously reported in COPD and other lung diseases, including RPUSD2, RAB11B, BTBD19, DNM3, SH3RF2, MTHFSD, ATOH8, SRPX, and HSPA4 (). These genes may represent novel potential biomarkers in the diagnosis and prognosis of COPD. The functional protein interaction network for the selected genes is illustrated in , based on the STRING database ().
Figure 3. Spearman’s rank correlation, co-expression, matrix between the selected genes in the COPD patients: heatmap for hierarchical clustering the 33 candidate genes based on their pattern of gene expression.
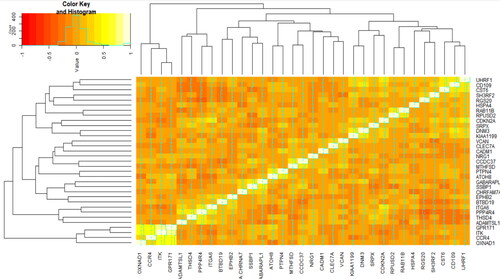
Figure 4. Co-expression network for the 33 selected genes from GeneMania. The size of the nodes indicates the co-expression degree between genes. The thickness of the edges indicates the weight of co-expression. The red-yellow color of the nodes/edges indicates the degree/weight, respectively.
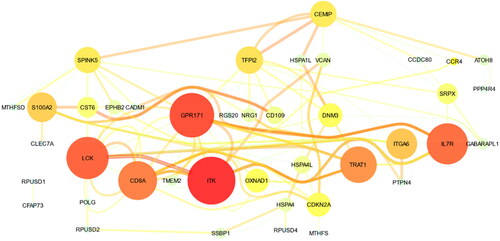
Table 3. Confirmation of the association of 33 selected genes with COPD/or lung function by literature reviewing in PubMed databank.
Causal pathway of selected candidate genes
Fitting the path diagram of selected genes (), the genes in SAE, lung tissue, and sputum had more significant direct effects on COPD progression, respectively. In contrast, the identified genes in blood samples had less significant direct and indirect effects on COPD progression. Based on the magnitude of indirect standardized path coefficient, the novel genes in macrophages, lung tissue, SAE cells, and sputum affected COPD progression significantly indirectly compared with blood samples (). All goodness of fit indices indicated that the model has an acceptable fit (RMSEA = 0.059, p-value < 0.05; SRMR = 0.051).
Figure 5. The path diagram: A diagram based on the connections between selected genes in the studied biological samples.
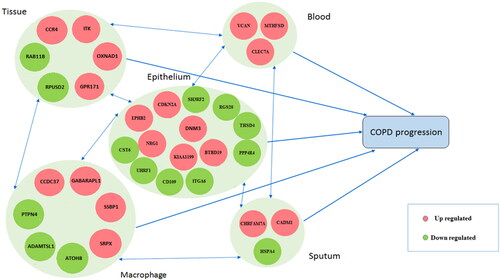
Table 4. Standardized direct, indirect, and total effects of selected genes in studied biological samples on COPD progression.
Discussion
COPD patients can currently be classified based on clinical tests, including spirometry or St George’s Respiratory Questionnaire (SGRQ), but the need for further prognosis mandates identifying novel biomarkers that highly correlate with the disease progression. Nowadays, the application of high-throughput techniques as well as systems biology and machine learning approaches deeply alter the vision of researchers toward identification of novel diagnostic and prognostic biomarkers. Different studies have been conducted on the transcriptome of various cell lines involved in COPD’s pathogenicity. In this study, previously reported influencing cell types were studied to identify the most impacting genes in the development of COPD staging. Heterogeneity of samples make the algorithms vulnerable to identify higher number, more pure, and less noisy differentially expressed genes (DEGs), which in case narrows the discovery route of novel predicting genes.
The penalized logistic regression model and SEM are used to identify novel genes and to assess the connection network of the selected genes, respectively. The studies show that the elastic net often performs better than ridge and LASSO for the model selection consistency and prediction accuracy in microarray data [Citation17]. The strengths of this study include the application of modern computational methods such as the statistical learning, SEM, validation of all of the results by literature review, and repeated cross-validation method (repeated 5-CV). However, some of the limitations of this study were the small sample size of disease stages, the lack of external validation dataset. On the other hand, applied novel methodologies in this study are robust against outliers and heterogeneity in gene expression data according to the bootstrap and cross-validation, standardized path coefficient in SEM and sensitivity analysis.
Analysis determined that identified genes in SAE cells, and macrophages had a higher accuracy rate than other biological samples in prediction of the disease progression. According to our results, twenty-four out of 33 genes were previously reported to associate with COPD, lung function (FVC, FEV1 or the FEV1/FVC ratio), and other lung related complications. Nine novel genes were identified with no background in COPD studies, including RPUSD2, RAB11B, BTBD19, DNM3, SH3RF2, MTHFSD, ATOH8, SRPX, and HSPA4. Amongst all, RPUSD2, RAB11B, BTBD19, DNM3, and MTHFSD were the most important novel genes in the analyses that can be nominated as novel important genes involved in the prognosis of COPD staging progression.
Contributing with the highest number of novel genes, epithelial cells appear to be most influential in pathogenesis of the COPD. The second rank in number of predicting genes belongs to macrophages. Macrophages have long been reported for their pillar role in inflammatory diseases and tissue remodeling processes. Enrichment analysis of novel candidate genes of epithelial cells demonstrated high contribution in cancer progression processes, initiation of inflammation and healing processes, and immune cell recruitment. On the other hand, some candidate genes impact hydrolyzing enzymes that leads to accumulation of mucus in bronchioles.
Thereupon, epithelial cells play a central direct role in COPD pathogenesis. However, macrophages are more indirectly in charge of inflammatory circumstances of lung microenvironment. Overall, it must be considered that macrophages have the upper hand compared to epithelial cells when it comes to COPD progression. Both M1 and M2 subclasses of macrophages are critical for healing processes. M1 cells remove damaged cells and M2 cells prepare an environment for proliferation and remodeling.
Macrophage candidate genes have high co-express with TWIST1 and PRRX1 transcription factors, which can be classified as oncogenes. These genes are mostly involved in genome replication and repair, along with autophagy and mitophagy processes. Comparing up and down-regulated candidate genes in macrophages reveal that downregulated genes mostly belong to antioxidant or proliferation initiation, while upregulated genes mostly belong to oxidant or tension responses.
Most candidate genes in tissue samples mainly contribute to chemokine signaling pathways, immune systems activation, cell-cell adhesion, and different G-protein related signaling cascades.
The co-expression network of candidate genes reveals that mostly tightly correlate with the immune system signaling mediators. We previously conducted research on COPD that highlighted the importance of epithelial cells in the progression of the disease. Also, 17 novel genes were introduced to be associated with the pathogenesis of COPD. PRKAR2B, GAD1, LINC00930, and SLITRK6 were the most important genes, which are consistent with the current study [Citation12].
Conclusions
These novel genes may provide the basis for the development of therapeutics in COPD and its associated morbidities in the future. It is hoped that further studies on this issue would identify novel genes as biomarkers to help diagnosis and prognosis in COPD.
Authors’ contributions
SM participated in the design of the study and wrote the manuscript. HB and JS performed the data gathering. AE and MA performed the statistical analysis. AA and SAJ conceived of the study, and participated in its design and coordination, and helped to draft the manuscript. MS edited the manuscript. All authors read and approved the final manuscript.
Acknowledgments
This work was supported by Baqiyatallah University of Medical Sciences, Tehran, Iran.
Disclosure statement
The authors declare that they have no competing interests.
Funding
The author(s) reported there is no funding associated with the work featured in this article.
Data availability statement
Data sharing not applicable to this article as no datasets were generated or analyzed during the current study.
References
- Zhao J, Li M, Chen J, et al. Smoking status and gene susceptibility play important roles in the development of chronic obstructive pulmonary disease and lung function decline: a population-based prospective study. Medicine. 2017;96(25):e7283. DOI:10.1097/MD.0000000000007283
- Lozano R, Naghavi M, Foreman K, et al. Global and regional mortality from 235 causes of death for 20 age groups in 1990 and 2010: a systematic analysis for the global burden of disease study 2010. Lancet. 2012;380(9859):2095–2128. DOI:10.1016/S0140-6736(12)61728-0
- Vestbo J, Hurd SS, Agustí AG, et al. Global strategy for the diagnosis, management, and prevention of chronic obstructive pulmonary disease: GOLD executive summary. Am J Respir Crit Care Med. 2013;187(4):347–365. DOI:10.1164/rccm.201204-0596PP
- Harries TH, Rowland V, Corrigan CJ, et al. Blood eosinophil count, a marker of inhaled corticosteroid effectiveness in preventing COPD exacerbations in post-hoc RCT and observational studies: systematic review and meta-analysis. Respir Res. 2020;21(1):3. DOI:10.1186/s12931-019-1268-7
- Dobler CC, Morrow AS, Farah MH, et al. Pharmacologic and nonpharmacologic therapies in adult patients with exacerbation of COPD: a systematic review. 2019.
- de Marco R, Accordini S, Marcon A, et al. Risk factors for chronic obstructive pulmonary disease in a european cohort of young adults. Am J Respir Crit Care Med. 2011;183(7):891–897. DOI:10.1164/rccm.201007-1125OC
- Lamprecht B, McBurnie MA, Vollmer WM, BOLD Collaborative Research Group, et al. COPD in never smokers: results from the population-based burden of obstructive lung disease study. Chest. 2011;139(4):752–763. DOI:10.1378/chest.10-1253
- Eisner MD, Anthonisen N, Coultas D, Committee on Nonsmoking COPD, Environmental and Occupational Health Assembly, et al. An official American thoracic society public policy statement: novel risk factors and the global burden of chronic obstructive pulmonary disease. Am J Respir Crit Care Med. 2010;182(5):693–718. DOI:10.1164/rccm.200811-1757ST
- Amaral AFS, Patel J, Kato BS, BOLD Collaborative Research Group, et al. Airflow obstruction and use of solid fuels for cooking or heating: BOLD results. Am J Respir Crit Care Med. 2018;197(5):595–610. DOI:10.1164/rccm.201701-0205OC
- Yang J, Jin J, Zhang Z, et al. Integration microarray and regulation datasets for chronic obstructive pulmonary disease. Eur Rev Med Pharmacol Sci. 2013;17(14):1923–1931.
- Pierrou S, Broberg P, O’Donnell RA, et al. Expression of genes involved in oxidative stress responses in airway epithelial cells of smokers with chronic obstructive pulmonary disease. Am J Respir Crit Care Med. 2007;175(6):577–586. DOI:10.1164/rccm.200607-931OC
- Mostafaei S, Kazemnejad A, Jamalkandi SA, et al. Identification of novel genes in human airway epithelial cells associated with chronic obstructive pulmonary disease (COPD) using machine-based learning algorithms. Sci Rep. 2018;8(1):1–20. DOI:10.1038/s41598-018-33986-8
- Ham S, Oh Y-M, Roh T-Y. Evaluation and interpretation of transcriptome data underlying heterogeneous chronic obstructive pulmonary disease. Genomics Inform. 2019;17(1):e2. DOI:10.5808/GI.2019.17.1.e2
- Cui Y, Zheng C-H, Yang J, et al. Sparse maximum margin discriminant analysis for feature extraction and gene selection on gene expression data. Comput Biol Med. 2013;43(7):933–941. DOI:10.1016/j.compbiomed.2013.04.018
- Tan AC, Gilbert D. Ensemble machine learning on gene expression data for cancer classification. 2003.
- Peng Y. A novel ensemble machine learning for robust microarray data classification. Comput Biol Med. 2006;36(6):553–573. DOI:10.1016/j.compbiomed.2005.04.001
- Zou H, Hastie T. Regularization and variable selection via the elastic net. J R Stat Soc B. 2005;67(2):301–320. DOI:10.1111/j.1467-9868.2005.00503.x
- Huang H-H, Liu X-Y, Liang Y. Feature selection and cancer classification via sparse logistic regression with the hybrid L1/2 + 2 regularization. PLoS One. 2016;11(5):e0149675. DOI:10.1371/journal.pone.0149675
- Shaykhiev R, Otaki F, Bonsu P, et al. Cigarette smoking reprograms apical junctional complex molecular architecture in the human airway epithelium in vivo. Cell Mol Life Sci. 2011;68(5):877–892. DOI:10.1007/s00018-010-0500-x
- Xue J, Schmidt SV, Sander J, et al. Transcriptome-based network analysis reveals a spectrum model of human macrophage activation. Immunity. 2014;40(2):274–288. DOI:10.1016/j.immuni.2014.01.006
- Peng X, Moore M, Mathur A, et al. Plexin C1 deficiency permits synaptotagmin 7-mediated macrophage migration and enhances mammalian lung fibrosis. Faseb J. 2016;30(12):4056–4070. DOI:10.1096/fj.201600373R
- Anathy V, Lahue KG, Chapman DG, et al. Reducing protein oxidation reverses lung fibrosis. Nat Med. 2018;24(8):1128–1135. DOI:10.1038/s41591-018-0090-y
- Kim S, Herazo-Maya JD, Kang DD, et al. Integrative phenotyping framework (iPF): integrative clustering of multiple omics data identifies novel lung disease subphenotypes. BMC Genomics. 2015;16(1):924. DOI:10.1186/s12864-015-2170-4
- Singh D, Fox SM, Tal-Singer R, On behalf of the ECLIPSE Investigators, et al. Induced sputum genes associated with spirometric and radiological disease severity in COPD ex-smokers. Thorax. 2011;66(6):489–495. DOI:10.1136/thx.2010.153767
- Singh D, Fox SM, Tal-Singer R, et al. Altered gene expression in blood and sputum in COPD frequent exacerbators in the ECLIPSE cohort. PLoS One. 2014;9(9):e107381. DOI:10.1371/journal.pone.0107381
- Irizarry RA, Gautier L. Package ‘affy. 2013.
- Smyth GK. Limma: linear models for microarray data. Bioinformatics and computational biology solutions using R and Bioconductor. Springer; 2005. pp. 397–420.
- Torang A, Gupta P, Klinke DJ. An elastic-net logistic regression approach to generate classifiers and gene signatures for types of immune cells and T helper cell subsets. BMC Bioinf. 2019;20(1):1–15. DOI:10.1186/s12859-019-2994-z
- Friedman J, Hastie T, Tibshirani R. The elements of statistical learning. Springer Series in Statistics, New York; 2001.
- Ogutu JO, Schulz-Streeck T, Piepho H-P, editors. Genomic selection using regularized linear regression models: ridge regression, lasso, elastic net and their extensions. BMC Proceedings; 2012;6(Suppl. 2):S10. DOI:10.1186/1753-6561-6-S2-S10
- Friedman J, Hastie T, Tibshirani R. Regularization paths for generalized linear models via coordinate descent. J Stat Softw. 2010;33(1):1–22.
- Robin X, Turck N, Hainard A, et al. pROC: an open-source package for R and S + to analyze and compare ROC curves. BMC Bioinf. 2011;12(1):77. DOI:10.1186/1471-2105-12-77
- Cohen J, Cohen P, West SG, et al. Applied multiple regression/correlation analysis for the behavioral sciences. Toronto (ON): Routledge; 2013.
- Wolfle LM. Strategies of path analysis. Am Educ Res J. 1980;17(2):183–209. DOI:10.3102/00028312017002183
- Rosseel Y. Lavaan: an R package for structural equation modeling and more. Version 0.5–12 (BETA). J Stat Soft. 2012;48(2):1–36. DOI:10.18637/jss.v048.i02
- Kim J-H. Estimating classification error rate: repeated cross-validation, repeated hold-out and bootstrap. Comput Stat Data Anal. 2009;53(11):3735–3745. DOI:10.1016/j.csda.2009.04.009
- Rodriguez JD, Perez A, Lozano JA. Sensitivity analysis of kappa-fold cross validation in prediction error estimation . IEEE Trans Pattern Anal Mach Intell. 2010;32(3):569–575. DOI:10.1109/TPAMI.2009.187
- Chang JC, Wooten EC, Tsimelzon A, et al. Gene expression profiling for the prediction of therapeutic response to docetaxel in patients with breast cancer. Lancet. 2003;362(9381):362–369. DOI:10.1016/S0140-6736(03)14023-8
- Dreiseitl S, Ohno-Machado L. Logistic regression and artificial neural network classification models: a methodology review. J Biomed Inform. 2002;35(5-6):352–359. DOI:10.1016/S1532-0464(03)00034-0
- Galili T, O’Callaghan A, Sidi J, et al. Heatmaply: an R package for creating interactive cluster heatmaps for online publishing. Bioinformatics. 2018;34(9):1600–1602. DOI:10.1093/bioinformatics/btx657
- Morrow JD, Cho MH, Hersh CP, et al. DNA methylation profiling in human lung tissue identifies genes associated with COPD. Epigenetics. 2016;11(10):730–739. DOI:10.1080/15592294.2016.1226451
- Busch R, Hobbs BD, Zhou J, COPDGene Investigators, et al. Genetic association and risk scores in a chronic obstructive pulmonary disease Meta-analysis of 16,707 subjects. Am J Respir Cell Mol Biol. 2017;57(1):35–46. DOI:10.1165/rcmb.2016-0331OC
- Akhabir L, Sandford AJ. Genome-wide association studies for discovery of genes involved in asthma. Respirology. 2011;16(3):396–406. DOI:10.1111/j.1440-1843.2011.01939.x