Abstract
Analyses of images of the cell-to-substratum region of contact have been carried out by the means of total internal reflection fluorescence (TIRF) microscopy during both the formation and the dissolution of cellular contacts. The evolutions of the cellular contacts are visualized during the adhesion process under normal and virus-infected intracellular conditions, and during the lift-off process under various toxicities of the extracellular medium fluid. Then, propositions are developed for quantifying the cell viabilities by estimating the increase in the area of contact for the adhesion process and by specifying the maximum intensity of the TIRF image for the lift-off process.
INTRODUCTION
Cell motility is essential to a wide range of physiological and pathogical processes, including embryonic development, inflammation, tissue repair, angiogenesis, and tumor invasion (Zygourakis Citation1996). Recent advances in optical technology have enabled the precise and real-time investigation of the motility of a ‘live single cell.’ The observation of a single cell in real time is commonly carried out for obtaining information on specific characteristics under homogeneous conditions in lieu of average values under heterogeneous conditions.
Among the various pieces of information, the most valuable parameter is the ‘cell viability’ for determining whether or not the culturing condition is adequate, particularly in the case of drug screening, and whether or not the candidate drug is reliable. The cell viability can be quantified by measuring the cell adhesion. However, conventionally, cell adhesion has been measured only at a bulk scale by, for example, merely counting the cells remaining after lavation, which is a very troublesome and time-consuming task. Therefore, for the purpose of quantitatively estimating the single-cell adhesion, the conventional method is not quite efficient.
Cells can adhere in many different ways to the substratum. Among them, the best-known is focal contact (or focal adhesion), which is defined in terms of the proximity of the cell's ventral surface to the substratum. It is a type of anchoring junction that forms a small region on the surface of a fibroblast or other cell that is anchored to the extracellular matrix (Burridge and Fath Citation1989). Its region represents the area of closest approach of the ventral cell membrane to the substratum, with a separation distance of 10~15 nm (Izzard and Lochner Citation1980). Even though cell-substrate adhesion has been studied (Roy et al. Citation2002), e.g., in the context of the measurement of cell adhesion by laser-induced stress waves (Hu et al. Citation2006), few researchers have thus far reported on cell lift-off.
Total internal reflection fluorescence (TIRF) microscopy has been traditionally well known to be useful for the visualization of the cell-membrane/substrate contact region. It utilizes an optical effect that is particularly well suited to the study of molecular and cellular phenomena at liquid/solid interfaces (Axelrod et al. Citation1984). Gingell et al. (Citation1987) developed a rigorous electromagnetic theory of total internal reflection and applied it to the establishment of a quantitative basis for mapping cell-substratum topography. The TIRF technique has been used in biological studies, such as cell-substrate contacts, vesicle fusion, and single-molecule observation (Lanni et al. Citation1985; Thompson and Lagerholm 1987; Wang and Axelrod Citation1994; Burmeister et al. Citation1998; Toomre and Manstein Citation2001; Li et al. Citation2004; Bretschneider et al. Citation2004; Manneville Citation2006; Young and Marcantonio Citation2007). Lanni et al. (Citation1985) observed fibroblast cells growing on glass slides and Fuhr et al. (Citation1998) reported the observation of cell adhesion and migration by using different microscopic techniques, including TIRF. However, those studies did not consider the effect of different cellular conditions on cell adhesion. By using TIRF, Partridge and Marcantonio (Citation2006) analyzed the initiation of attachment and the generation of focal adhesion. Using confocal and TIRF microscopy, Vilarino et al. (Citation2006) characterized the effect of a marine toxin (AZA-1) on the cytoskeleton of adherent cells and cell growth. However, there are no studies in the literature that use TIRF to quantitatively account for the progression and retrogression of cellular contact.
Thus, the objective of the present study is to use the TIRF method to quantitatively investigate the motility of a single live cell on a chip system with regard to both cell adhesion and lift-off. For assaying adhesion, both normal and virus-infected cells are tested to investigate the effect of intracellular conditions on cellular contact. On the other hand, for assaying lift-off, the evolution of the cellular detachment of normal cells is observed under different degrees of toxicity. Then, propositions are developed for quantifying the cell viabilities by utilizing the intensities of TIRF images.
METHODS
Experimental Apparatus
a shows a schematic of the experimental apparatus, which consists of three modules: a chip system (see also b), an incubator, and a TIRF microscope with a CCD camera. An Ar-ion laser is adopted as the light source for exciting the fluorescence inside the cell at a wavelength of 488 nm (Stabilite 2017; Spectra-Physics). A prism (PS851; ThorLab) is placed under the slide-glass of the chip system that contains the cells. The beam from the Ar-ion laser-source is split into two pathways, one for epifluoresence (EF) and the other for total internal reflection fluorescence (TIRF). The split beam for EF setup is focused through a convex lens so that it becomes intensified for exciting the fluorescence inside the cell, whereas the other beam, which is for TIRF setup, is focused through a convex lens and reflected by a mirror toward the glass plate that is in contact with the prism for refracting the beam. When the shutter in EF setup is closed, only near-surface images can be obtained by the means of TIRF without being affected by the bulk fluorescence. Then, the light emitted from the cell is detected by the microscope's objective lens (50×; Mitotoyo) and passed through a long-pass filter prior to the CCD camera (Cooke) for diminishing the noises from other wavelength bands.
Figure 1. Schematic of the experimental setup and the chip.
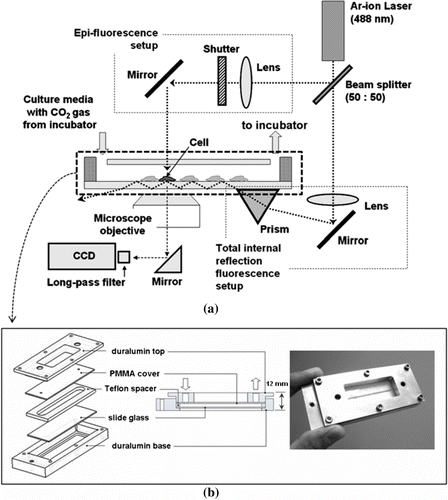
To investigate cell adhesion to and lift-off from the substratum, a human embryonic kidney (HEK293) cell was chosen. To keep the cells alive during the experiment that lasts for hours, we designed a culturing chip that was strong and firm enough to even hold a single slide-glass (1×3 inches). Proper temperature (37°C) and CO2 concentration (5% in the atmosphere) were maintained inside the chip by circulating the medium through an incubator by the use of a peristaltic pump. A schematic and a photographic image of the present chip are shown in b. Following sterilization with an autoclave, a regular slide-glass is installed into a duralumin housing (2×4 inches) with a Teflon wall and a polymethylmethacrylate (PMMA) cover. The chip system is assembled with six screws, where parafilm was used as a gasket layer to seal chinks between all the parts. The cells are loaded through the inlet-hole of the duralumin top and the PMMA cover. Nutrition is supplied during the experiment from the incubator through the chip system.
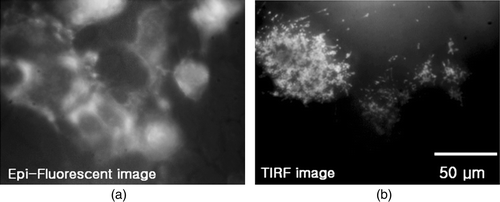
In the literature (Lanni et al. Citation1985; Bretschneider et al. Citation2004; Weisswange et al. Citation2005; Partridge and Marcantonio Citation2006; Manneville Citation2006), there are many examples of the use of EF in combination with TIRF for measuring global and membrane-specific events. However, in the present study, EF setup was used only for illuminating the whole field to locate the cells before and/or after the TIRF images were recorded. The EF and TIRF images of HEK293 cells in the specified region are compared in .
Figure 2. Microscopic images of HEK293 cells with eGFP: (a) EF image; (b) TIRF image.
TIRF and Optical Setup
TIRF is known as a precision optical method for illuminating only near the substrate by using the evanescent field, which vertically extends several hundred nanometers, when the incident light is totally reflected. If it is a visible light, it typically illuminates a vertical slice that is shallower than 100 nm (Toomre and Manstein Citation2001). Thus, TIRF images have low background noise so that the configuration of an object that is near the surface can be revealed by correlating the intensity of the TIRF image with the distance from the glass.
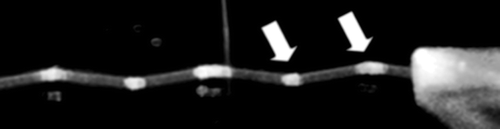
In the present study, for the sake of convenience, we construct the experimental apparatus by aligning the prism-based TIRF module with the chip system. As shown in a, a small prism is placed under the bottom of the slide-glass with only immersion oil (n = 1.516; Olympus) for fixation without any mechanical support. In a, a pathway of the laser beam in the inside of the slide-glass is schematically shown to generate total internal reflection regions. In fact, demonstrates how evanescent field regions are generated upon the slide-glass of the present setup; the regions are indicated by the two white arrows as brighter illumination regions where the beam reflects from the inner surface of the slide-glass. TIRF is applicable to these regions. However, because the cells are cultured upon the slide-glass, only those in the regions that are illuminated by the beam that is reflected from the upper interface (see the right arrow in ) can be observed with TIRF.
Figure 3. Photographic image of the pathway of the laser beam through the prism and the inside of the slide-glass that generates total internal reflection.
Preparation for Cellular Conditions
Both normal and virus-infected cells are used for the adhesion assay, whereas only normal cells with varying extracellular toxicities are used for the lift-off assay. About 5–10 days prior to the experiment, the enhanced green fluorescent protein (eGFP) gene was injected into both cell-groups (293 cells altogether) by electroporation for the cells to generate fluorescent protein for visualization. The usability of cells was determined after checking the emission of eGFP from the membranes of the cells.
Normal Cells
In line with the general protocol for culturing mammalian cells, HEK293 cells were cultured in Dulbecco's modified Eagle's minimum essential medium (DMEM) that contained 10% fetal bovine serum (FBS) and 50 U/ml penicillin.
Virus-Infected Cells
Adenoviruses are known to infect eukaryotic cells, proliferate themselves there, and then, a few days later, cause the cells to weaken or die. Therefore, if we observe the adhesion process of adenovirus-infected cells, we can compare it with that of normal cells and figure out the relationship between the cell condition and the cell contact. Two hundred microliters of adenovirus suspension was injected into 10 ml of medium that contained cells, which covered about 50% of the T-flask bottom with an area of 25 cm2. Seventy-two hours after the injection, the cells were loaded into the chip system that was mounted on a TIRF microscope.
We sought to compare the adhesion process of a normal cell with that of a weak or diseased cell. Although the adenovirus is well known to deliver genes into cells, it is also known to weaken the vitality of cells. If we used some other reagents to kill the cells during the adhesion process, these reagents might also dissolve the protein inside the cells and thereby prevent the cells from forming a focal adhesion structure.
Toxicities
Following the conventional method for lifting off cultured cells, the medium was first removed. Subsequently, lavation was carried out several times. After these preliminary processes, the perfusion of trypsin-EDTA (trypsin), which is a well-known chemical that is capable of dissolving proteins that construct focal contacts, was carried out over the cells so that the cells could later be taken off by injecting fresh culturing medium onto them. For the present experiment, however, these conventional preliminary processes may unexpectedly affect cell adhesion. Alternatively, if any reagent is used to kill the cells during the adhesion process, it might dissolve the protein inside the cells and thereby prevent the cells from forming a focal adhesion structure before everything else. On the other hand, trypsin is known to cause cells to detach from the substrate without killing them. Therefore, trypsin was instilled into a DMEM solution that contained the cells to yield a toxic extracellular medium.
Experimental Method
In the adhesion assay, TIRF images were recorded from the initial state through to the saturated state of the cellular contact of both normal and virus-infected cells. On the other hand, in the lift-off assay, those of normal cells were obtained immediately from the instant when each toxic medium was introduced until the images became so blurred as to indicate that the cell totally had been lifted-off.
First, we cultured a group of normal cells and another group of virus-infected cells in a CO2 incubator and transferred them into respective chips. Second, by placing one chip on the present device that was connected to the culture medium pool in the incubator with a silicone tube, we took photos of TIRF images, at 1-min intervals for 30 min, of the single cell that was forming its contacts, which could be either normal or virus infected. Meanwhile, other chips were kept in the incubator, without any flow inside, so that cell-substrate contacts could freely form for hours to be subsequently used for the lift-off experiment. For nourishment and perfusion, we used a peristaltic pump at a flow-rate of 0.52 ml/min. Third, for the purpose of making the single cell disestablish its contacts, we placed the cell chip on the present system and circulated the trypsin solution.
Three different concentrations of the trypsin, i.e., 0%, 50%, and 100% by volume in phosphate-buffered saline (PBS), were adopted to create the flow of toxic extracellular medium through the culture chip. In this lift-off assay, the solution did not pass through the incubator; hence, the CO2 concentration and the temperature of this assay were different from those of the adhesion assay. However, the two experimental conditions that were imposed on the cells under the three toxic conditions were the same. In any event, in less than 1 min, DMEM was almost replaced with trypsin solution. We took photos of cell-substrate contacts at 1-min intervals for 60-min durations under various toxic extracellular conditions.
Because a weak flow always occurred during the perfusion or circulation of the fluid medium, the ensuing shear stress on the cell might have affected the cell contact or lift-off. However, the effect of the shear stress was assumed to be negligible because the rate of flow was controlled to be as low as possible. In fact, the effect of the shear stress may constitute another very interesting topic for further research.
RESULTS AND DISCUSSION
Cell Adhesion Assay
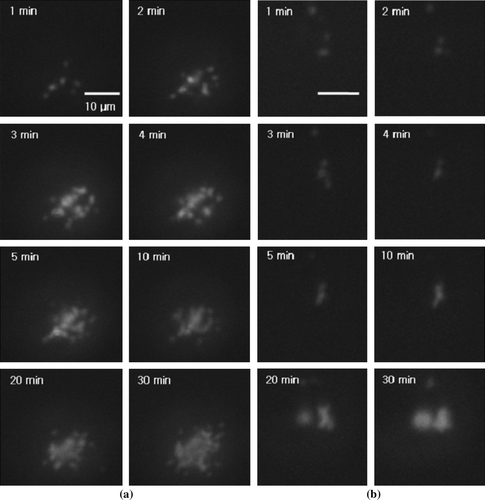
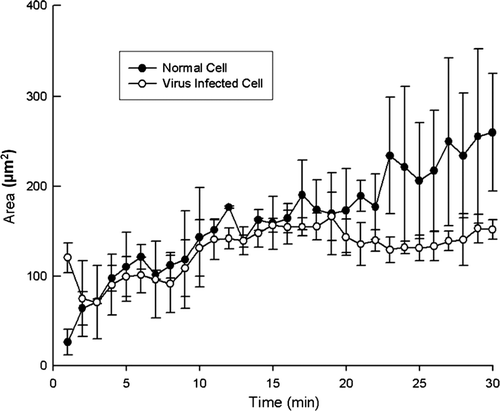
a and b respectively show the time-series of the TIRF images during the adhesion processes of normal and adenovirus-infected cells. They display the succession of changes of the cell-to-substrate contacts from the outset through to the final state. It is clearly seen that during the adhesion process of the HEK293 cell, the contact area increases, as anticipated. However, the variation of the contact area considerably depends upon the intracellular condition. For the normal cell, six spots that represented the cell-to-substrate contacts began to appear after 1 min. Then, the number of spots gradually increased over time. Finally, after 30 min, a large number of spots were clustered in the manner of a cloud. For the adenovirus-infected cell, the contact area also increased, but at a much slower rate. Therefore, it is proposed that to diagnose the intracellular condition, the information on the changing pattern of the contact area, as well as the contact area at the final state, can be useful.
Figure 4. Time-series of TIRF images during the adhesion process: (a) normal cell; (b) virus-infected cell.
Thus, to quantify the contact area, the number of all pixels with intensity that exceeded a threshold level was counted in the TIRF images and multiplied by the area of a unit pixel (6.55×10⁻² µm2). The threshold level was arbitrarily chosen with the signal-to-noise ratio (SNR) of 2.33. In the present study, we focus on the changing pattern of the contact area as defined above. Therefore, the determination of the exact configuration of the cellular contact area should be separately discussed.
shows the variation of the contact area with time; this is deduced from the images in . For a cell under normal condition, the contact area increases up to 250 µm2, whereas for a cell that is infected by adenoviruses, the contact area stops increasing earlier, viz., at about 150 µm2. In general, the slope of the curve, which depicts the contact area as a function of time, for a normal cell is steeper than that for a virus-infected cell. Therefore, it can be argued that the variation of the contact area and its increasing rate can be used to quantify cell viability. In a previous study (Partridge and Marcantonio Citation2006), the two-dimensional area that was spread by cells that are transfected by different plasmids was measured by using phase-contrast microscopy and TIRF microscopy. The findings of Partrige and Marcantonio (Citation2006) that the increasing rate of the spread area varied with the transfecting material and that the area range was 100~400 µm2 are quite comparable to the present study. However, in their study, the cells were fixed and stained before the measurement. Therefore, theirs was not a live-cell assay, which is a point of difference for the present study.
Figure 5. Increase in the contact area during the adhesion process over the initial 30 min.
Cell Lift-off Assay
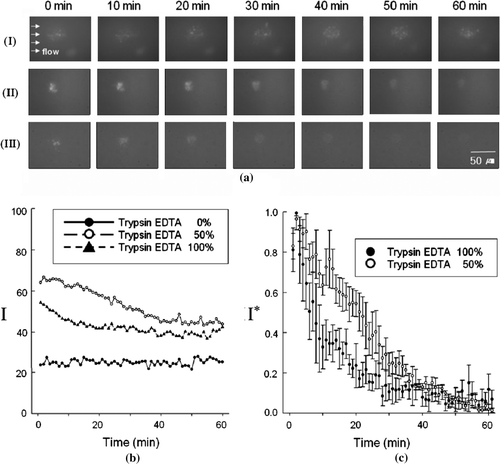
In the cell lift-off assay, live cells were exposed to different toxic extracellular conditions. shows cell lift-off processes when the cells are subjected to 0%, 50%, and 100% v/v trypsin flows for 60 min. The time-series of TIRF images in a demonstrate the decay of cellular contact under the three different toxic conditions. It is particularly noted that in aII and 6aIII, the spots gradually crumble into an indistinct cluster and their intensities decay, in contrast to the case of the nontoxic flow (aI). By comparing the three sets of data in a, we can argue that the extracellular toxicity of the medium drastically affects the cell-substrate contact because the light intensity from the TIRF image implies proximity between the cell contact and the substrate.
Figure 6. Cell lift-off processes under different toxic extracellular conditions: (a) Time-series of TIRF images obtained for (I) nontoxic, (II) 50%, and (III) 100% trypsin-EDTA flows; (b) temporal variation of the standardized maximum pixel intensity I that is deduced from (a); (c) temporal variation of the normalized maximum pixel intensity I* under two toxic extracellular conditions, where five sets each of experimental data are included for 50% and 100% trypsin-EDTA flows.
During the adhesion process, the increase of the cellular contact area was estimated by counting the pixels for which the intensity exceeded a threshold level. However, during the lift-off process, it was difficult to estimate the decrease of the cellular contact area because the counted pixels did not disappear one by one; rather, their brightness faded out somewhat simultaneously. Therefore, it is proposed that the maximum intensity of the TIRF image over the cellular contact area (in lieu of the cellular contact area itself) is used as the quantitative measure of the lift-off process. It is further considered that if some unexpected local variation of the experimental condition occurs, then it is likely to affect the fluorescence of the cells, regardless of their original motion. In these regards, some standardization of data is necessary so that the following definition of standardized maximum pixel intensity can be introduced.1
In Equation 1, imax and imin are respectively the maximum and minimum intensities among the whole pixels of each TIRF image, which are determined by the 16-bit gray-scale value of each pixel, whereas imean is the mean intensity of each TIRF image. The curves in b represent the temporal variations of I that are deduced from a, which indicate the deterioration of the cellular contact. Physically, I corresponds to the closest distance of the contact structure from the substrate. In Equation 1, when imax imin, I becomes close to 0, which means there is no definite contact structure over a given image. On the other hand, when imax >> imin, I becomes larger, which means that the contact structure is close to the substrate. In the cell lift-off process, the TIRF images were observed to become more blurred until they had no clear fluorescence. Such a change could be well represented by the definition of I. Under 100% toxicity, I initially decays more rapidly than under 50% toxicity, as b illustrates a definite difference between the two cases.
Moreover, it is further considered that the difference in the concentration of the fluorescence in the cytoplasm may cause some cells to look brighter than others. Therefore, it is necessary to normalize the experimental results that were obtained under different conditions of extracellular toxicity. In this regard, we define a new, normalized, maximum pixel intensity for which the maximum value throughout the duration of the lift-off process is 1 (one) and the minimum value is 0 (zero), as follows.2
In Equation 2, Imax and Imin are the maximum and minimum values of I (see Equation 1). More specifically, I* is nothing but a transfer function that is used to compare the graphs in b under the same scale, where the maximum value of the graph is 1 and the minimum is 0. Thus, five sets each of data that pertained to the temporal variation for 50% and 100% trypsin-EDTA flows, such as those shown in b, were further normalized by using Equation 2 and shown in c. It is apparent that during the initial 30 minutes, I* of the 100%-trypsin assay decreased much more rapidly than that of the 50%-trypsin assay. In fact, I* stands for the normalized value of the difference in intensity between the closest point of the cell to the substrate (the cell contact) and the farthest point from the substrate (beyond the depth of penetration of the evanescent wave). Therefore, the temporal variation of I* accurately describes the cell lift-off process, given that I* corresponds to the decrease in the difference in intensity relative to the initial value under toxic extracellular conditions. However, after 30 min, there was no remarkable difference between the two intensities. This is because the initial 30 min sufficed for both cells to be exposed long enough to toxic material. Therefore, the cells would be totally lifted off regardless of the concentration of the toxic material.
The location of the cell was checked by using EF after the lift-off was completed. Although the cell did not drift away within 60 min, the image was not blurred under the nontoxic environment (see aI). Thus, it is believed that the change in the TIRF image was due to the vertical motion of the cell and not the thermal drift. Further, the objective lens that was used was not a liquid-emersion type and the distance between the cell and the lens was greater than 20 mm. Therefore, the thermal drift could be largely ignored. Moreover, every part of the chip system remained at a constant temperature. In particular, the TIRF section, which was at room temperature, was not in contact with the cell chamber section at 37°C and the air layer worked as an insulator. Hence, there was no conduction between them, as a result of which it was unlikely that the temperature of the objective lens could affect the cell lift-off.
CONCLUSIONS
Quantitative methods have been proposed for estimating the variation of the contact between the cell and the substratum under diverse intracellular conditions and the variation of cell lift-off under diverse extracellular conditions. The methods analyze time-series of TIRF images of live HEK293 cells, which are obtained on a chip system. In the adhesion assay, the variations of the contact area with time were compared between normal and adenovirus-infected cells. As a consequence, it was argued that the variation of the contact area and its rate of increase can be used to quantify cell viability. In the lift-off assay, live cells were exposed to different toxic extracellular conditions, where the maximum intensity of the TIRF image that contained the cellular contact area was utilized as the quantitative measure. A standardized maximum intensity that is based on the mean intensity of each TIRF image and, more significantly, a second value that is normalized by the difference between the maximum and minimum of the former value were proposed. They yield a good quantitative account of cell viability under extracellular toxicity conditions. It is quite noteworthy that cell adhesion and lift-off under different intra/extracellular conditions can be quantified in real time on a chip with a simple TIRF system.
Acknowledgements
This work was supported by grant R01-2005-000-10558-0 from the Basic Research Program of the Korea Science & Engineering Foundation (KOSEF), and also by the Micro-Thermal System Research Center under the auspices of KOSEF. The authors are thankful to Mr. Sudong Kim for his assistance in preparing the manuscript.
References
- Axelrod D, Burghardt TP, Thompson NL. Total internal reflection fluorescence. Ann Rev Biophys Bioeng. 1984; 13: 247–268
- Bretschneider T, Diez S, Anderson K, Heuser J, Clarke M, Müller-Taubenberger A, Köhler J, Gerisch G. Dynamic actin patterns and Arp2/3 assembly at the substrate-attached surface of motile cells. Curr Biol 2004; 14: 1–10
- Burmeister JS, Olivier LA, Reichert WM, Truskey GA. Application of total internal reflection fluorescence microscopy to study cell adhesion to biomaterials. Biomaterials 1998; 19: 307–325
- Burridge K, Fath K. Focal contacts: Transmembrane links between the extracellular matrix and the cytoskeleton. BioEssays 1989; 10: 104–108
- Fuhr G, Richter E, Zimmermann H, Hitzler H, Niehus H, Hagedorn R. Cell traces - footprints of individual cells during locomotion and adhesion. Biol Chem 1998; 379: 8–9
- Gingell D, Heavens OS, Mellor JS. General electromagnetic theory of total internal reflection fluorescence: The quantitative basis for mapping cell-substratum topography. J Cell Sci 1987; 87: 677–693
- Hu L, Zhang X, Miller P, Ozkan M, Ozkan C, Wang J. Cell adhesion measurement by laser-induced stress waves. J Appl Phys 2006; 100: 084701-1–084701-5
- Izzard CS, Lochner LR. Formation of cell-to-substrate contacts during fibroblast motility: An interference-reflexion study. J Cell Sci 1980; 42: 81–116
- Lanni F, Waggoner AS, Taylor DL. Structure organization of interphase 3T3 fibroblasts studied by total internal reflection fluorescence microscopy. J Cell Biol 1985; 100: 1091–1102
- Li D, Xiong J, Qu A, Xu T. Three-dimensional tracking of single secretory granules in live PC12 cells. Biophy J 2004; 87: 1991–2001
- Manneville JB. Use of TIRF microscopy to visulize actin and microtubules in migrating cells. Method Enzymol 2006; 406: 520–532
- Partridge MA, Marcantonio EE. Initiation of attachment and generation of mature focal adhesions by integrin-containing filopodia in cell spreading. Mol Biol Cell 2006; 17: 4237–4248
- Roy P, Rajfur Z, Pomorski P, Jacobson K. Microscope-based techniques to study cell adhesion and migration. Nat Cell Biol 2002; 4: E91–E96
- Thompson NL, Lagerholm BC. Total internal reflection fluorescence: Applications in cellular biophysics. Curr Opin Biotechnol 1997; 8: 58–64
- Toomre D, Manstein DJ. Lighting up the cell surface with evanescent wave microscopy. Trends Cell Biol 2001; 11: 298–303
- Vilarino N, Nicolaou KC, Frederick MO, Cagide E, Ares IR, Louzao MC, Vieytes MR, Botana LM. Cell growth inhibition and actin cytoskeleton disorganization induced by Azaspiracid-1 structure-activity studies. Chem Res Toxicol 2006; 19: 1459–1466
- Wang MD, Axelrod D. Time-lapse total internal reflection fluorescence video of acetylcholine receptor cluster formation on myotubes. Dev Dynam. 1994; 201: 29–40
- Weisswange I, Bretschneider T, Anderson KI. The leading edge is a lipid diffusion barrier. J Cell Sci 2005; 118: 4375–4380
- Young EF, Marcantonio EE. A novel subcellular collagen organization process visualized by total internal reflection fluorescence microscopy. Cell Commun Adhes 2007; 14: 169–180
- Zygourakis K. Quantification and regulation of cell migration. Tissue Eng 1996; 2: 1–26