
 ?Mathematical formulae have been encoded as MathML and are displayed in this HTML version using MathJax in order to improve their display. Uncheck the box to turn MathJax off. This feature requires Javascript. Click on a formula to zoom.
Abstract
How does information credibility, a subjective judgment of investors, affect empirical asset pricing in financial markets? Traditional economic theories are inadequate for interpreting market responses driven by people’s subjective thinking, as these cognitive processes are not encompassed by the concept of utility. We explore these effects by using computational linguistics and deep structured learning algorithms to analyze financial newspapers and social media posts. After controlling for factors related to content and market momentum in our narrative based credibility indicator, we find that news credibility is positively correlated with the returns on assets preferred by experts and negatively correlated with assets preferred by gamblers. Based on this finding, we point out that the efficient-market hypothesis (EMH) is not appropriate in the dominant market of gamblers in the short-term. In the long-term, however, investment motivation does not significantly affect the validity of the hypothesis.
1. Introduction
In an efficient capital market, asset prices should fully absorb all available information quickly and without bias (Malkiel and Fama Citation1970). Although empirical evidence supports this argument, many studies still question the validity of this insight. For instance, many empirical studies have found ambiguous asset return patterns and thus reject the assumption that the capital market is efficient. Some studies find return reversal, while others find drift patterns when new relevant information is published, as discussed in the survey conducted by Tetlock (Citation2014). One of the key assumptions imposed here is that market participants are strictly rational. For example, the efficient market hypothesis (EMH) assumes that market participants receive and respond rationally and consistently to the information they receive and update their decisions immediately based on this information. Psychologists Glimcher (Citation2011) have criticized economic theories for neglecting people’s goals, hopes or desires; as they are not observable, economists tend to only consider how they constrain people’ preferences in the most limited sense. There are a number of different types of subjective factors, such as emotion (Bollen, Mao, and Zeng Citation2011), superstition (Hirshleifer, Jian and Zhang, Citation2018), the weather (Saunders Citation1993) or even the FIFA World Cup (Kaplanski and Levy Citation2010) may be regarded as a potential psychological factor affecting the market. From the perspective of emotion, many behavioral finance works (e.g., Tetlock, Saar-Tsechansky, and Macskassy Citation2008; Uhl Citation2014; Barberis, Shleifer, and Vishny Citation2005) indicate the connection between human psychological factors such as sentiment and market performance. However, one important issue often overlooked in previous sentiment analysis in behavioral finance is the perceived credibility of the information. How market participants interpret and respond to information that they do not fully believe remains unclear. Unlike previous sentiment studies primarily consider daily news sentiment (e.g., Tetlock, Saar-Tsechansky, and Macskassy Citation2008) or investor sentiment (e.g., Brown and Cliff Citation2005), in this paper we primarily focus on the perception sentiment of newly released information and its impact on the market performance. We define investors’ sentiment on news descriptions as news perception credibility, or simply called news credibility. In the work of measuring the credibility of news, Jin et al. (Citation2014) consider news with different sentiment polarities have no effect to each other. Naturally, when two correlated but different sources of information have similar sentiment polarities, it can be considered that one source considers the other is relatively credible. We are therefore inspired to compare the sentiment of news with the sentiment of investors on social media to construct the news perception credibility indicator.
Yet there remains a lack of knowledge on the effects of news credibility on financial markets. We consider two types of investors participate in the market: experts and gamblers. Experts are all market participants exposed to market assets based on objective information, including financial statements and expert analysis reports. In contrast, we define gamblers as market participants exposed to assets based on subjective factors. We believe that subjective factors have different effects on different types of people. For example, for a perfectly rational economist, the victory of her favorite team should not affect her decision regarding the company stocks that she will buy. (We assume that the firm is not related to the team.) A market is made up of people, so we can reasonably infer that the people who make up the market will have diverse responses to these subjective factors. To distinguish the effects of credibility on experts and gamblers, we focus on two financial markets: the stock market and the cryptocurrency market.
There are many sources of information available to market participants, and the Internet and electronic devices are continuously increasing the speed of information dissemination and reader coverage. Gaziano (Citation1988) argues that people are less likely to pay attention to the press if they do not believe or trust the press. A well-known and reliable source of information is therefore essential for information to be well received and considered “newsworthy” by most market participants. In this analysis, we use two types of markets (the stock market and the cryptocurrency market) to describe the dominant markets of experts and gamblers. Our dataset consists of 349 human-annotated news articles published between 1 March 2018 and 10 October 2018 in the Financial Times. For the experts’ dominant market, we consider the consumer staples sector of S&P 500 firms, as company fundamentals are clearly exposed and relatively easy for market participants to recognize. For gamblers, we consider the Bitcoin cryptocurrency market as the dominant market. Bitcoin was introduced by Nakamoto (Citation2008) as a purely peer-to-peer electronic cryptocurrency that did not require the participation of trusted third parties. Although there are many cryptocurrencies on the market, Bitcoin is one of the most popular, and thus can represent the behavior of most cryptocurrency market participants. Although it is true that some people, especially those who use cryptocurrencies for privacy purposes, use cryptocurrencies for real transactions, Athey et al. (Citation2016) shows that the main function of Bitcoin today is investment. A set of 276,701 comments in StockTwits is used to measure news credibility among market participants. For both markets, we measure abnormal asset returns one day, one week and two weeks after the publication of the news to analyze asset pricing.
This paper has three main objectives. The first is to measure the credibility of information in global financial markets. The second is to identify and test the textual characteristics that can affect information credibility. The third is to broaden our knowledge of asset pricing patterns driven by imperfectly credible information shocks. To answer our research questions, we use a set of news articles about the consumer staples sector of S&P 500 firms and Bitcoin in 2018. We collect all of the news articles relevant to the study of information shocks and annotate them as bullish, neutral or bearish. In addition, we collect pre-annotated comments from a social network to estimate the credibility of these information shocks. To understand what can drive the dynamics of news credibility, we focus on market momentum, news content and macro controls. Finally, we evaluate asset returns after a shock to interpret the effects of imperfectly credible information absorption patterns on a financial market.
This paper extends research on behavioral finance from news sentiment to news perception credibility. This study makes three concrete contributions to the literature. First, we show a clear difference in information credibility between our experts and gamblers. We create a narrative-based credibility indicator and other content-based controls that will help researchers to better understand the effects of narrative events on asset pricing. In this process, an important task is to classify the sentiments of user comments on social media. Unlike most literature that only deals with polar emotions, we also consider the impact of neutral emotions on social networks in financial markets. In order to reduce the noise of missing labels in the neutral annotations that we recognize, we control the weight of this part of neutral emotion by introducing the coefficient λ. Second, we extend our knowledge of gamblers in financial markets by taking into account behavioral factors. We show that news credibility has a positive effect on asset pricing in the dominant market of experts, but this effect is negative in the dominant market of gamblers. One explanation for this result is that when the information is more credible, experts are more likely to rely on the new information they receive, increasing the effect of the news shock. In contrast, information that is not credible strengthens the importance of gamblers’ subjective expectations for asset pricing, thereby causing bubbles. Third, we answer the fundamental question in finance — whether the EMH still appropriate when irrational traders dominant the market. Our finding suggests the answer is yes, but only valid in the long-term of the gamblers’ dominant market.
This paper is organized as follows. The second section reviews the literature that motivates the empirical research in regard to our study. The third section describes the data sources and collection criteria used. The fourth section explains how we measure news credibility in our study. The fifth section presents the main results of the effects of information credibility on market returns. The sixth section explores the robustness of our results, and seventh section concludes the paper.
2. Literature review
We begin our discussion of the role of speculators in asset markets. Economic theory generally considers that speculative activity makes asset markets more efficient (e.g., Grossman and Stiglitz Citation1980; Grossman Citation1995) by improving their information and allocation functions. Speculators can be strategic traders who manipulate the stock price for profits by short-selling the stock (Goldstein and Guembel Citation2008) based on the feedback effect from the stock market to corporate decisions. In contrast, a body of literature (e.g., De Long et al. Citation1990; Lux Citation1995; Shleifer and Summers Citation1990; Shiller Citation2003) report that speculative activity is driven by noise traders, herding and bubbles can destabilize the market and make asset markets less efficient. Therefore, the overall effect of speculative activity on market efficiency can be positive (through strategic trading) or negative (through the effects of irrational traders). The foremost difference from speculators is that gamblers rudimentarily rely on irrational factors when making investment decisions. If speculators have an indefinite impact on the EMH, then gamblers who recognized as irrational traders might have a more inexplicit effect on the hypothesis. Under the traditional view of the EMH, gamblers who rely on factors unrelated to the fundamental value of the assets will lose money and eventually leave the market (see, e.g., Friedman Citation1953). However, there is considerable literature (e.g., De Long et al. Citation1988; Hirshleifer, Subrahmanyam, and Titman Citation2006) shows that irrational traders can earn more abnormal returns than rational informed investors in some situations, this situation is called the survival of irrational traders. In addition, some speculative assets can be difficult for most traders to assess their fundamental value, thus there may be relatively few rational investors in these markets. Therefore, it is appropriate to assume the EMH should consider the impact of irrational gamblers on asset markets.
A large amount of literature mainly focuses on the impact of news events on the stock market. Traders in the stock market tend to be more rational than asset markets with low fundamental value, such as cryptocurrency markets. Intuitively we can infer that rational and irrational people differently respond to subjective factors. Sentiment analysis is usually a method used by behavioral finance researchers to study the impact of news events and irrational factors on financial markets. (Edmans, Goldstein, and Jiang Citation2015) study strategic speculators’ incentives to trade on information and indicate the feedback effect rises (decreases) the profitability of buying (selling) on bullish (bearish) news. Antweiler and Frank (Citation2004) suggest that news stories from the Internet help predict market volatility and that the influence of news on stock returns is statistically significant but economically small. Tetlock, Saar-Tsechansky, and Macskassy (Citation2008) use a simple quantitative measure of language in firm-specific news articles and find that market prices consistently underreact to negative words in firm-specific news stories, especially those on fundamental value. Calomiris and Mamaysky (Citation2019) examine how a news article and its context drive risk and returns. They identify the influence of news measures on changes in market performance by country type over time, showing that the content of news articles conveys more information in emerging markets than in developed economies. In general, the previous sentiment studies can be classified into two categories in general. Some studies such as Tetlock, Saar-Tsechansky, and Macskassy (Citation2008) and Uhl (Citation2014) choose daily news sentiment data for analysis and successfully used sentiment indicators to explain the performance of some markets at certain periods of time. On the other hand, Brown and Cliff (Citation2005) represents another analysis approach by looking at investor sentiment rather than news sentiment and show that high investor sentiment leads to overvaluation.
Naturally, it leads to a question of whether it is workable to amalgamate the different sentiment categories for behavioral finance studies. In this paper, we define the news and investors sentiment amalgam as news perception credibility or news credibility for short. If news sentiment is always homogeneous to investors sentiment, then news credibility is redundant. However, as Shang, Brooks, and McCloy (Citation2014) claim market participants treat the sentiment in listed firms’ narratives might deviate from how they value mass media narratives, news credibility is valuable to capture the latent gap between the sources and investors sentiment. One extension of the news and investors sentiment amalgam is the study of news absorption patterns. These studies use the event study approach proposed by Fama et al. (Citation1969) to show how market participants respond to information. For instance, Frank and Sanati (Citation2018) perform a textual analysis of news stories from the Financial Times and find a significant difference in market responses to positive and negative price shocks with regard to new information. Defining a price shock as a price change for a given stock from one day to the next, the authors conclude that the stock market will overreact to good news and underreact to bad news. In addition, the stock market will overreact more to negative no-news shocks than to positive no-news shocks. The authors provide one plausible explanation for these seemingly contradictory results is the attention bias of investors. In other words, investors’ perception of news sentiment rather than news sentiment per se might be more relevant to market performance.
There are controversial definitions of news media credibility in the literature. Abdulla et al. (Citation2002) measure credibility by three dimensions: trustworthiness, currency and bias. Metzger et al. (Citation2003) comprise trustworthiness and expertise, fairness, bias, incompleteness, concern for community, separation of opinion and fact, and accuracy seven dimensions for credibility estimation. Thorson, Vraga, and Ekdale (Citation2010) recognize fairness, completeness, bias, accuracy, trustworthiness, and addressing perceptions of balance in the news six dimensions that appear to be important in news credibility judgments. Some studies on the other hand address a similar issue using the duration of source credibility (Hovland and Weiss Citation1951), the comparison of credibility between different sources (Abdulla et al. Citation2002; Cassidy Citation2007; Lee Citation1978) or the factors that can influence source credibility (Thorson, Vraga, and Ekdale Citation2010). The main methodology of these studies is the usage of questionnaires or interviews. However, these multidimensional definitions might only appropriate to study the credibility of media when the samples are relatively small. Newhagen and Nass (Citation1989) claim the credibility of mass media news is to treat news information as a reasonable reflection of the events they depict. Jin et al. (Citation2014) further argue that messages with disparate sentiment polarities have no sway over each other. We are inspired by these views and hence introduce the bi-dimensional news perception credibility that only rely on news sentiment and investors sentiment. Our approach significantly reduces the difficulty to measure the credibility of media, especially in the big data era.
This paper extends research on behavioral finance from news sentiment to news credibility. In addition to contributing to the growing literature on news absorption patterns in the financial market and the correlation between news content and market reaction, this paper introduces the concept of news credibility and studies its role in the news absorption process, which explains previous inconsistent results on news shock return patterns. Our results indicate the usefulness of newspaper and social media narratives for researchers examining traditional and new financial markets from the perspective of behavioral finance.
3. Financial news and social network data
One of the main challenges in our research is to select an appropriate subset to reflect the indispensable characteristics of target markets. For the experts’ dominant market, we select 33 companies from the consumer staples sector of S&P 500 component stocks as our sample with at least one related news that appeared in the newspaper. Our main consideration is that the activities and main products of the companies in this sector are clear to most general investors. Most products in the consumer staples sector, such as food and beverages, are designed to meet the basic physiological desires of consumers. Therefore, companies in the consumer staples sector may be easier to be evaluated by investors, while products in the semiconductor or mining industry may be more complex or unfamiliar. On the other hand, most manufacturers are in monopolistic competition and thus invest plenty of resources in advertisement and product information disclosure. These two reasons lead to the consumer staples sector being highly valued by experts (such as Warren E. Buffett) who predominately rely on objective data to make investment decisions. In addition, these listed companies provide a large amount of substantial data that experts can analyze. The daily news reports (UTC time) of these S&P 500 firms used here are those published by the Financial Times from 1 March 2018 to 10 October 2018. Because our news credibility depends on the daily real-time sentiment of social networks, we must limit the time period of our research to avoid abuse of social network server resources and the expensive cost of data collection, storage and analysis. We therefore choice around 8 months in our study. On the other hand, we hope that Bitcoin is relatively familiar to investors in the selected time period. Simultaneously, there should not be too many factors affecting investors apart from financial news. For example, Bitcoin’s price fluctuations will be much greater than in the previous period in 2020. Tesla’s attitude toward Bitcoin payments and Elon R. Musk’s remarks might be one of the main factors affecting its price. As a result, the period after 2020 may have a certain exogenous influence on our news research. Based on previous considerations, we have decided that our study periods in the stock market and the Bitcoin market will be the same from March to October 2018.
The Financial Times and the Wall Street Journal are both representative and reliable sources of general financial news. Nevertheless, Frank and Sanati (Citation2018) suggest that the Wall Street Journal is more geared toward US readers. In contrast, the Financial Times has a global readership and therefore tends to have higher criteria for selecting and publishing news preferred by global subscribers. In this study, we focus on the opinions of global market participants and therefore choose news articles published in the Financial Times as our main source of information.
To evaluate news credibility in the stock market, we collect 245 stock news articles from the Financial Times website. These news stories are collected if an article appears under the website query topic based on the firm name (for instance, the query topic “Coca-Cola Co.” in the Financial Times indicates the Coca-Cola Company). Using the query topics of articles annotated by this official website prevents us from missing relevant news stories due to common variations in company names.
We select the Bitcoin market to represent the dominant financial market of gamblers. To estimate news credibility in the cryptocurrency market, we collect 104 news articles related to the keyword “Bitcoin” from the Financial Times website. These news stories are selected if an article appears on the website after searching for relevant keywords. Our public narrative data set includes 242,361 unduplicated observations corresponding to the 33 S&P 500 firms of the consumer staples sector and 34,340 comments related to “Bitcoin” in StockTwits. StockTwits is a social network created in 2008 for investors, traders and entrepreneurs to share ideas. In 2013, this social network had 230,000 active users. These data are collected if (i) the articles refer to communities relevant to the markets of interest, as indicated by the hashtags,Footnote1 and (ii) the article is not an advertisement. Compared with news articles in the Financial Times, texts in StockTwits are very unstructured with many casual terms, such as slang, online terms, emoji etc. One of our main reasons for choosing this social network is that it enables users to use “bullish” or “bearish” tags to indicate their market expectations to the public.
illustrates the sentiment variable and comments provided by StockTwits users. These annotations can therefore be used as a proxy for researchers to efficiently study the subjective cognition of market participants on a large scale. In addition, we use textual data from Twitter in our robustness tests. We collect 4,685,417 unique tweets from 29 May 2018 to 10 October 2018 on topics related to “Bitcoin”. More details are provided in the section, Robustness Tests.
Figure 1. Example of StockTwits messages.
Note: This figure illustrates web-page of StockTwits Messages in regard to the “Bitcoin” relevant hashtags.
4. Measuring credibility
As Nagura et al. (Citation2006) indicate that the credibility of online news is related to the judgment of readers, in this section, we propose a method to rate the credibility of financial news from the perspective of investors’ perception of news sentiment. Today, many investors are willing to share their comments about the market with polarized sentiment in social networks. These investor sentiment data are valuable for researchers to measure news credibility by comparing it with market news sentiment. Big data analysis and crawler technology make it possible to analyze investor sentiment based on social networks. Nevertheless, our main empirical challenge is to construct credibility measures for the 276,701 self-annotated comments on the 349 newspaper articles. Each observation with a sentiment label “bullish” indicates that the user is optimistic about the market, “bearish” indicates that the user is pessimistic about the market and an empty label indicates that the user makes no judgment, thus we classify this empty label as “neutral”. Although it is reasonable to speculate that a “bullish” or “bearish” label can correctly indicate the investment trend of these social network users, it is difficult to interpret the cognition of “neutral” label users. On the one hand, a “neutral” label can indicate that these users do not expect the event to have a significant effect on the market. On the other hand, this label can indicate that the news is not relevant to the market, or that users have chosen to omit their expectations concerning the market. The first scenario signals that this news article is de facto neutral for the market, whereas the second scenario reduces the information conveyed by the “neutral” comments.
So far, the most common sentiment analysis approach to textual data has been the binary or polarity classification. This approach only classifies each document as positive or negative. One of the main advantages of the binary classification approach is that it reduces the complexity of the classification problem. However, a disadvantage of this approach is that if most users consider the news neutral for the market, this approach simply ignores this majority of the observations, leading to an overestimation of polarized sentiment following the news shock. To address this problem, we use a parameter λ ∈ [0,1] to control the weight of “neutral” comments among social network users. λ determines the effect of users’ “neutral” expectations on their overall sentiment, a challenge being to choose the appropriate value of λ. There is a tradeoff between a lower λ and a higher λ. If λ is close to 0, our approach will become similar to the binary classification approach as it largely ignores the “neutral” comments of social network users. However, if λ is close to 1, the noise of “neutral” comments will overwhelm the optimistic or pessimistic expectations of other users. In this analysis, we use a lower λ ∈ (0,0.1] after experimenting with different numerical values from 0 to 1 to ensure that the effect of a positive (negative) news shock on the social network will not be overwhelmed by the noise of “neutral” comments.
The rest of this section explains how we develop a continuous sentiment measure for social network users, then discusses the approach we use to identify news shocks from the newspaper. Next, we present the news credibility measures of recognized news shocks based on the sentiment measure from the social network. Finally, we describe how we construct textual measures from relevant news articles to measure subjective factors in terms of news credibility in general financial markets.
4.1. Continuous sentiment in the social network
In the original StockTwits data set, the sentiment of each social network user is a discrete indicator of positive, negative or neutral market expectations. Jin et al. (Citation2014) propose a probabilistic mapping from the binary credibility annotation to measure Microblog credibility. Analogously, we propose several steps to capture the average market expectation among social network users with a continuous sentiment variable through a probabilistic mapping from discrete labels. The goal is to improve the actual information content of the sentiment indicator, allowing us to conduct more reliable studies on the factors that can affect people’s expectations and cognition.
First, for each market-related community i from StockTwits, we group all records according to their publication date t and count the number of each label s ∈ {0,1,2} is an indicator of the sentiment annotation, with 0 indicating “bearish”, 1 “neutral” and 2 “bullish”. This classification is akin to the methods proposed by Uhl (Citation2014) and Gotthelf and Uhl (Citation2019), which divide news sentiment into three categories: positive, negative, and neutral, but the numerical range in their work is rather between −1 (negative) and 1 (positive). We use a weighted
instead of
to measure the frequency of each sentiment of community i at time t, where
is given by
To compute the overall daily sentiment label for each asset relevant to the community from the social network, ∀i ∈ , t ∈
we use the following criteria:
(1)
(1)
(2)
(2)
where
is the expected overall daily sentiment label and
is the probability that
accurately measures the overall daily sentiment of social network users at time t in community i.
The second step in measuring sentiment in the social network is to map a discrete based on
to a set
where
To this end, we use a
-loss function defined as
to measure the distance between the estimated variable
and the true variable y.
-loss is an error measurement instrument widely used in machine learning applications and research (Bühlmann and Yu Citation2003; Chang, Hsieh, and Lin Citation2008; Mao et al. Citation2016; Zhao et al. Citation2017).
-loss allows researchers to reduce error sensitivity if the estimated value is close to the observed value and to increase it if the error deviates from the observation. Applying the
-loss function to estimate
based on EquationEquation (2)
(2)
(2) at time t, we obtain the following:
(3)
(3)
If a real annotation exists, the corresponding probability of this label should always be equal to 1. Using from EquationEquation (1)
(1)
(1) and
from EquationEquation (3)
(3)
(3) , we construct the following continuous sentiment measure:
(4)
(4)
where
captures the sentiment dynamics from pessimistic expectations to optimistic expectations among social network users in community i at time t.
Similar to in EquationEquation (1)
(1)
(1) , we use
to denote the sentiment of the relevant news article published at time τ. Using
in EquationEquation (4)
(4)
(4) , we define narrative-based credibility
in community i at time t with regard to the news shock at time τ as follows:
(5)
(5)
where
is equal to the length of
in our study.
is a continuous measure of the distance between the direction of the news shock and the sentiment in the social network. By using the
-loss function of EquationEquation (3)
(3)
(3) , we reduce the sensitivity of the indicator when public sentiment is close to the direction of the news shock, and vice versa.
4.2. Identification of news shocks
A news shock refers to an event published in the news media that can attract people’s attention. We consider this type of information as “newsworthy”. It is a difficult task to identify the type of news that interests each market participant, but we can simplify this task by assuming that each market participant will only be interested in financial news related to the assets in which they wish to invest. It is therefore essential to determine whether a narrative is relevant to the target market. We follow two steps to detect and annotate the relevance of each news article in our data set to ensure that each potential shock can be identified accurately and effectively.
First, we define several classification rules that allow a computer to automatically delete irrelevant news articles. As mentioned earlier, we use the sector name (usually the name of a firm or asset) in the Financial Times to identify and build our news collection. To design the classification rules, we divide the sector name into individual words and remove common stop words like “Co”, “Inc” and “Corp”, which appear in most corporation names. In textual analysis, these procedures are called tokenization and preprocessing. We use the remaining tokens as keywords to match the topics and content of news articles in each sector. The score for a successful match between a token in the topic and a keyword should be 2, and the score for a successful match between a token in the content and a keyword should be 1. As a sector name can generate multiple keywords, we only use the maximum score among all of the keywords. We compare this score with a predefined threshold value θk and classify the news as relevant if the maximum score is higher than θk. One challenge is to choose the appropriate threshold value. We use θk = 3 after considering a tradeoff between the accuracy and efficiency of the classification rules. To avoid the possibility that a small variation in the name of a token related to a keyword can lead to a mismatch with the keyword, we use the “fuzzywuzzy” package in Python to calculate the similarity ratio between each token in a news story and the keyword. For instance, the similarity ratio between “Cola” and “Coca-Cola” is 62 and the ratio between “Estée” and “Estee” is 80. We define a successful match between a token in a news story and a keyword in a sector name if the similarity ratio is greater than a threshold θs, and we use θs = 60 after experimenting with the transformation of different keyword-related token names.
Our second step is to ask experts with at least a Master of Finance or a degree in other relevant subjects to check the news stories that have been identified as “irrelevant” by our classification rules as some relevant news articles may fail to pass our rules, for example if they include only a few keywords in their title and content. For each discarded news item, we provide the name of the company or financial asset and ask these experts to manually annotate whether the news is relevant or not.
After using our auto-classification rules and the annotations of experts to indicate the relevance of the news stories in our collection, we ask financial experts to interpret and annotate each relevant news article with the sentiment label “bullish”, “neutral” or “bearish”. Following the previous notation, we use to denote each news shock, where
summarizes the news shock identification results based on our data.
Table 1. News collection summary with annotations.
4.3. Computational linguistic approach to the media
Textual analysis is becoming more and more popular among economists, as it provides powerful and efficient tools for quantitatively studying large-scale information incorporated into texts. Shiller (Citation2017) argues that textual analysis will become a more solid field of research in economics in the coming years due to the big data generated by social media and the development of interdisciplinary research involving subjects such as psychology, neuroscience and artificial intelligence. Numbers, symbols, punctuation and topics are direct carriers of information in textual media. To study the credibility of information shocks, it is necessary to control for these plausible linguistic effects on credibility. To this end, in their article, Hansen, McMahon, and Prat (Citation2018) develop “counting measures” and “topic measures” to quantify the reports of the Federal Open Market Committee so that they can study the behavior of policymakers. In this paper, we use counting measures and the latent Dirichlet allocation (LDA) (Blei, Ng, and Jordan Citation2003) based on topic modeling to quantify news content and determine how the content affects news credibility.
4.3.1. Counting measures
In terms of counting measures, we choose four indicators, i.e. questions, exclamations, numbers and capitals, to capture content-based information of different dimensions from the news narratives. summarizes these four counting measures.
Table 2. Summary of counting measures.
The question measure enables us to estimate the degree of uncertainty in an article. The exclamation measure allows us to roughly measure the intensity of the tone in a news narrative. The number measure can be used as a proxy for numerical language in an article, indicating the quantitative reliability of the source of information. Finally, the capital measure controls the frequency of financial assets presented in the media. All four measures are considered to be content-based characteristics that can affect the credibility of narratives introduced in EquationEquation (5)(5)
(5) .
4.3.2. Topic measures
Next, we describe how we construct our topic measures of news shocks. In the first step, we analyze the content of a news article based on information hidden in the text. One limitation of counting measures is that this approach omits any information transmitted by text combination. Different news articles can discuss different topics even if they have the same shock direction, affecting market participants to varying degrees. For instance, good news related to agriculture may not affect people as much as good news related to the banking system. We mitigate this concern by using the LDA model to identify underlying topics in a series of news narratives. Topic models are a type of statistical model used to identify topics in a collection of documents, and it has been widely used in the field of information retrieval, textual analysis and natural language processing. As a typical topic model, LDA provides a quantitative and intuitive approach for researchers from different disciplines interested in mining and analyzing information from textual data.
4.3.2.1. LDA topic modeling
The basic concept of the LDA topic model is that each topic is a set whose elements are specific high frequency words tha are more likely to appear in documents discussing that topic. Suppose that there are K topics and D relevant documents in the news collection. The collection can be coded according to a document’s term frequency as vectors where N is the number of unique elements in a set that includes all words detected in the collection, also called a N size dictionary. To reduce the complexity and noise caused by trivial words, we use the vocabulary indicator in the counting measure stage for all relevant documents to construct the dictionary of size N. To represent each abstract topic, we use vectors
Each element in a vector corresponds to a word in the dictionary of size N and the value of each element in a topic is determined by the term frequency of the words in the dictionary. The LDA model assumes that each document includes several topics, which can be denoted by vectors
Each element of a vector indicates the proportion of the document belonging to this topic, and based on the proportion of each topic, a topic index vector
is assigned to each word in the document, where
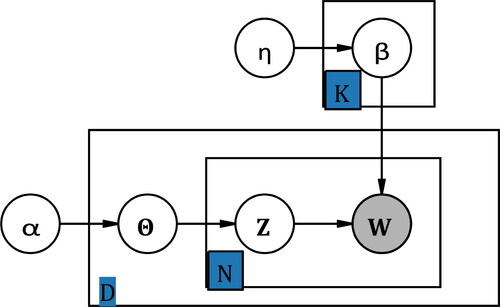
We use a plate notation to visualize the correlations between the variables in the LDA model in . The shaded nodes are the observed variables, representing the vectorized training data set in our collection. α and η are parameters to control the predefined conditional probabilities Pr(Θd | α) and Pr(βd | η). According to the graphical representation of the dependencies between random variables in , we can obtain the joint distribution of Wd, Zd and Θd:
(6)
(6)
Figure 2. Plate notation for the LDA model.
Note: Plate notation is introduced by Buntine (Citation1994) as a type of structured probabilistic models or probabilistic graphical models, the purpose is to present the human designed conditional dependence structure between random variables. For example, an arrow from variable A to B denotes the hypothetical casualty from A to B. If and only if variables A and B are both inside the same plate or rectangular with a subscript number N is this graph used to simplify the notation that independent two self-distributed variables A and B repeat N times under the condition of causality determined by the arrow’s direction. In other words, there are totally N2 combinations to represent the casualty from A to B.
Adding the joint distribution Equationequation (6)(6)
(6) on Zd and βd, then integrating it on Θd gives the following marginal distribution:
(7)
(7)
By summing the marginal distribution in EquationEquation (7)(7)
(7) for each document in the collection, the LDA model transforms it into a log-likelihood function and then executes an unsupervised learning algorithm to measure parameters α∗ and η∗ to maximize the likelihood function as follows:
(8)
(8)
By identifying the appropriate parameters after training the collection, LDA generates K meaningful word clusters in the data and assigns each document to the most appropriate topic.
4.3.2.2. Topic selection for LDA
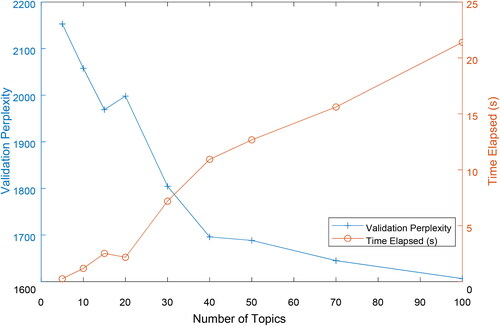
One challenge in LDA topic modeling is choosing the appropriate number of topics, K. Typically, a higher K increases the statistical capability of the prediction model, but lowers its interpretability, as each topic may be too specific to be analyzed. In the extreme case where K = D, each document will be assigned one individual topic. Although this model fits the sample perfectly, it is useless for capturing the general patterns in the news articles. Conversely, if K is too small, the latent topics generated may be too vague for topic analysis. To resolve the tradeoff between a high K and a low K, we compare the experimental results of model perplexity in the 20% validation data set with different K values, as shown in . We use K = 40 after taking into account the tradeoff between the complexity of the model and the validation perplexity under an appropriate training convergence time.
Figure 3. Topic selection for LDA.
Note: We keep 20% of the original data-set for validation. Perplexity is an indicator in information theory that measures how well a probability model predicts a sample. Usually a lower perplexity denotes a higher likelihood that the probability distribution will fit the sample. Time elapsed measures the convergence time of the model, indicating the complexity of the model.
4.3.2.3. LDA results
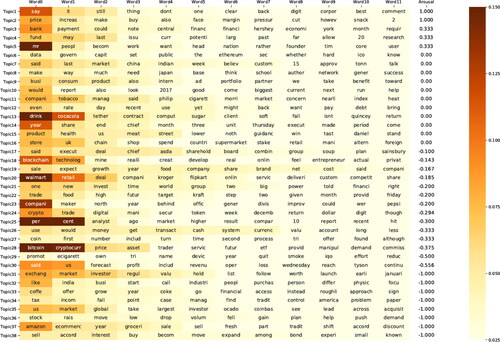
We perform LDA topic modeling on the combination of relevant news titles and content in our sample. For each news article, we calculate the probability vectors of 59,783 words after preprocessing, N-gram tokenization and stemming, and identify the most likely topic of each document. shows 38 topics in a heatmap identified by the LDA unsupervised algorithm. We report the top 12 most likely keywords, the darker shades on the heatmap denoting a higher probability that a detected word belongs to one of these topics. Based on the researchers’ understanding of each topic keyword, we use a topic tag to represent the content of each topic. For instance, Topic 3 is “banking”, Topic 18 is “blockchain technology” and Topic 24 is “cryptocurrency market”. Although these topic tags are subjective, LDA provides an intuitive approach for people to understand the central idea of each news narrative.
Figure 4. Topics ranked by level of arousal; terms in topics ranked by probability.
Note: This figure presents the 38 individual distributions over N-size dictionary that LDA unsupervised learning algorithm calculates to indicate news topics. To order the detected topics, we create an arousal index by using the average daily highest VIX value as a baseline to calculate the gap in the number of a topic with a daily highest VIX greater or equal to the baseline versus the number of the topic in the opposite case, and divided by the number of the topic in the relevant news collection. In each row, terms are ordered from left to right according to their likelihoods belong to a single topic of their row.

The LDA algorithm does not automatically order the topics. To quantify the effects of different topics on news credibility, we project the topics generated by LDA into a one-dimensional space of arousal. Arousal is a term in neurophysiology that describes the state of being awoken by stimulation,Footnote2enabling us to measure the distance between each topic, which represent the different degrees of stimulus generated by different topics of news shocks. To this end, we define an arousal index using the highest average daily level of the CBOE (Chicago Board Options Exchange) Volatility Index (VIX).
To order the identified topics, we create an arousal index between t0 and tn using the highest average daily VIX value as a baseline. For each date
if
vector
records the document frequency of each topic. In contrast, vector
records the document frequency of each topic if
Vector
denotes the total document frequency of each latent topic. Following the notation above, we define the arousal index vector
as follows:
where each element Ai corresponds to the arousal index of topic i. A higher (lower) value reflects more (less) intense stimulation for market participants during the shock. In our study, t0 is 1 March 2018 and tn is 10 October 2018. We sort the latent topics in descending order of Ai from Topic 1 to Topic 38.
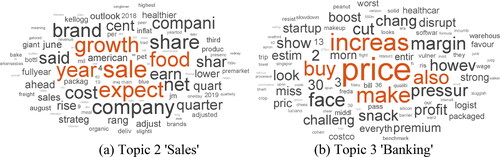
The topics with a higher level of arousal (see ) are sales (2), banking (3) and fund (4), while inactivating topics (see ) are e-commerce (37), US market (35) and beverage (33). The topics with a trivial relationship to the arousal level include tobacco (11), soft drink (13) and healthcare (15). This result is understandable because news shocks will have a relatively limited effect on consumer behavior toward more dependent products.
Figure 5. Arousal topics in news narratives.
Note: These word clouds present two relatively high arousal level topics in the Financial Times. The size of words is approximately proportional to the probability belongs to the topic computed by the LDA algorithm.
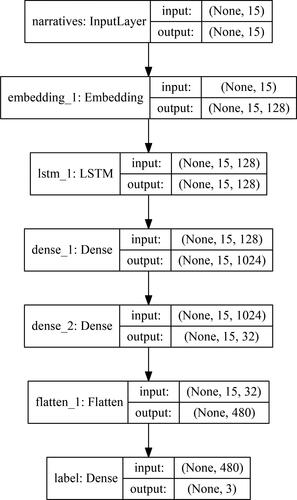
Figure 6. Inactivation topics in news narratives.
Note: The settings of these figures are similar to those presented in , except for the relatively low arousal level topics.
4.3.3. Momentum measures
We also consider the role of market momentum in news credibility using abnormal returns (AR) one day before the news shock. The abnormal return is defined as the difference between the actual return and the expected return on an asset. We calculate the expected returns on the stock market using the traditional capital asset pricing model (CAPM) proposed by Sharpe (Citation1964) and Lintner (Citation1975) in Event Study by WRDS. Some studies attempt to provide theoretical asset pricing models for cryptocurrencies. Cong, Li, and Wang (Citation2019) introduce a dynamic pricing model by taking into account platform productivity, endogenous user adoption and user heterogeneity. However, there is a terra incognita in current asset pricing models that make it difficult to satisfactorily interpret expected returns from cryptocurrencies. However, cryptocurrencies, at least Bitcoin, are a type of decentralized currency with a high level of privacy. In other words, the expected volatility of cryptocurrencies should be strongly correlated with the global exchange market. Therefore, we introduce the following approach to measure the expected returns of cryptocurrencies:
where
is the expected return of cryptocurrency c at time t, and
is the return of the global exchange market at time t. In our study, we suggest that
where ESDR represents the value in US dollars of one unit of Special Drawing Rights (SDR).Footnote3
5. Results
In this section, we present our findings on the effects of news credibility on market performance. We use t to indicate the time interval since the initial news shock. The linear model we adopt is as follows:
(9)
(9)
where the dependent variable ARit indicates the average abnormal returns of the assets observed on market i at time t and Z is people’s expectations regarding information credibility (see details in the section: Momentum Measures). Vector X includes market momentum and other macro controls, such as previous abnormal market returns i, to capture market momentum and the VIXFootnote4 to control for general market volatility.
In the section, Continuous Sentiment in the Social Network, we present our narrative-based credibility measure for people’s expectations. Nevertheless, news content can affect the result of our measure, so we use the counting measures and topic measures described in the section, Computational Linguistic Approach to the Media, to control for the linguistic effects of news articles on the credibility indicator. Thus, the narrative-based credibility in EquationEquation (5)
(5)
(5) can be given by
(10)
(10)
where vector Cτ includes the counting measures, topic measures, and sentiment dummy variables D(Bearish) and D(Bullish) of news shocks of relevant news articles at time τ. Based on EquationEquations (9)
(9)
(9) and Equation(10)
(10)
(10) , we obtain the following reduced form of the effects of news credibility on abnormal market returns:
(11)
(11)
presents the results of EquationEquation (11)(11)
(11) . News credibility has a significant positive effect on short-term stock market returns. This result is in line with our expectations in traditional financial markets that company information is one of the main price drivers, as such information can update people’s knowledge of the fundamental values of companies. However, news credibility has a significant negative effect on the returns of the cryptocurrency market one week after. We interpret this phenomenon as gamblers’ expectations becoming the main source of asset market value when the fundamental value of these assets is trivial or difficult to estimate. Gamblers become less volatile when reliable information is available, allowing assets to return to their fundamental value. However, if the market is flooded with a lot of information that is not credible, this can further stimulate gamblers’ reliance on subjective intuitions rather than reason, thereby creating bubbles in the cryptocurrency market.
Table 3. Effects of news credibility on market performance.
According to the “Yerkes–Dodson law”, subjects’ performance in complex tasks follows a bell-shaped curve when the level of arousal increases. When the level of arousal is relatively low, increased arousal can generate interest and stimulate the performance of subjects. Conversely, when the level of arousal is relatively high, high arousal can become anxiety and therefore decrease performance. Based on our observations, the participants in the stock market and the cryptocurrency market are distributed to the right of the bell-shaped curve, which indicates that when news shock topics are more likely to arouse readers’ emotions, these emotions are more likely to turn into anxiety than interest, reducing people’s expected market returns.
For our counting measures, we observe certain significant effects of the content-based characteristics on the credibility indicator. However, most of them are not dominant characteristics affecting market performance. One predominant characteristic is the abnormal market return the day before a news shock. This past abnormal return is a proxy for market momentum related to people’s expectations. The results show that market momentum has a significant negative effect on the long-term performance of the stock market and the cryptocurrency market, indicating that market performance is absorbed in the long-term. One interesting result is that market momentum has a significant positive effect on the cryptocurrency market in the medium term, but not in the short-term, suggesting that Bitcoin gamblers take at most one week to be affected by price momentum; thus, price momentum rather than news credibility becomes the dominant factor in market performance during this period.
For the news sentiment dummies, we only observe significant negative effects on market performance two weeks after the news shock in the stock market. A reasonable explanation is that the impact of neutral news in the short-run may be underestimated. In the long-run, the value of neutral news may be more obvious for stock market participants, because the stock market has more rational experts than the cryptocurrency market, which affects market performance.
Finally, we see a significant effect of market volatility on both financial markets in the short-term, and that the positive effect of market risk is much stronger among gamblers. However, we do not observe a significant long-term relationship, which means that the market risk indicator only temporarily affects people’s asset return expectations.
6. Robustness tests
6.1. Perturbation analysis
First, we report our robustness test results by tuning the values of the parameters used in the Results section. The first parameter we consider is the threshold value λ, which controls the sensitivity of the news credibility indicator to “neutral” comments in the social network. In our main analysis, we use λ = .02 and make our sentiment analysis model in the social network close to the polarity classifier. In this robustness test, we modify this threshold value to λ = .1 and allow “neutral” comments to have a higher weight in our credibility measure. in Appendix A shows that the results of this robustness test correspond to our main results in . With the exception of slight fluctuations in the estimated coefficients, the significance is consistent with the main estimates.
Second, we modify the threshold value to λ = 0 and only take into account polarized news shocks and comments. We only keep the sentiment dummy variable D(Bearish) in our model and in Appendix A shows that the results of this robustness test sustain our main findings with a slight variance of the significance and the estimated coefficients.
6.2. Sample selection
We switch our attention to the selection of our narrative sample in the social network. Our credibility measure depends mainly on comments from StockTwits. To test the possible influence of sample selection bias on our conclusion, our next robustness test measures news credibility using another popular social network platform. To simplify our robustness exercise, we choose Twitter and use the keyword “Bitcoin” to test news credibility in the cryptocurrency market. The Twitter standard Streaming Application Programming Interface (API) allows researchers to randomly request tweets in real time (comments on Twitter) on a specific hashtag at a limited maximum speed. Twitter is one of the largest social networks with a massive number of international daily active users, and thus can reflect the cognition of general market participants. However, a major challenge when using tweets is that Twitter does not provide a self-annotated tag like StockTwits reflecting user expectations in the market. To solve this problem, we use a deep learning approach. Specifically, we choose annotated narratives in StockTwits as training data and then classify each tweet into “bullish”, “neutral” or “bearish”.
Deep learning is a type of machine learning algorithm based on artificial neural networks with multiple hidden layers. The depth corresponds to the number of layers in a neural network, explaining the name “deep learning” when referring to the training process of multi-layer neural networks. Hornik, Stinchcombe, and White (Citation1989) theoretically prove that multi-layer artificial networks with at least one hidden layer can approximate any measurable function to any desired degree of accuracy. Unlike traditional supervised learning algorithms, such as the naïve Bayes classifier or the support vector machine, one advantage of the deep learning algorithm is its powerful ability to learn the relationship between input data and output labels without a strict feature selection process for input. This advantage is very useful for processing highly unstructured social network data, otherwise we have to decide and select specific keywords from our data collection to train our classifier. We discuss in detail the configuration, training and performance of our deep learning model in Appendix B.
We collect 4,685,417 unique tweets from 29 May 2018 to 10 October 2018 related to the “Bitcoin” topic. in Appendix A compares the effects of news credibility on the Bitcoin market based on the StockTwits measure and the Twitter measure. Our main results of news credibility in the Bitcoin market are robust, indicating that StockTwits can appropriately represent general users of social networks for researchers to analyze the expectations of gamblers.
7. Conclusions
In empirical asset pricing, external shocks, especially those caused by news, are one of the most important factors affecting asset prices. News credibility is an important but easily overlooked factor in understanding how people perceive and process information in a market. In this study, we propose a statistical learning approach that allows researchers to estimate news credibility using large-scale textual data in newspapers and social media. One challenge in applying our narrative-based credibility indicator is that the linguistic characteristics of news articles can affect the accuracy of the measurements. To solve this problem, we generate a content-based control vector with counting measures and topic measures that can maximize the noise caused by the text structure. For the topic measures, we apply the LDA unsupervised learning model, which allows the machine to automatically detect latent topics in the newspaper. We also develop an arousal index based on psychological theory, which allows us to measure the level of anxiety stimulated by particular news content.
We find that news credibility is positively correlated with stock market returns but negatively correlated with cryptocurrency returns. We explain this result using the idea that when the information is more precise, investors have more resources for valuation and thus amplify news shocks. However, when the information is less credible, gamblers tend to use their own subjective expectations to value assets with low or unclear fundamental values, thereby creating bubbles. Finally, this paper explains how researchers can benefit from machine learning algorithms in textual analysis. In today’s big data era, a large amount of unstructured data are hidden on the Internet, providing reliable data sources for research. Knowledge-based supervised learning, such as deep learning, unsupervised learning based on data patterns, such as LDA, and other machine learning techniques are powerful new tools for researchers in many fields.
Acknowledgements
I am grateful to C. Simon Fan, Hongliang Zhang and Fuhai Hong for helpful comments and suggestions. Thanks also to Joint PhD Workshop with Zhejiang University holding at Lingnan University for their feedback and suggestions.
Additional information
Funding
Notes
1 For instance, the hashtag $BTC.X refers to “Bitcoin BTC/USD”. These hashtags can be used in StockTwits to identify topics in chat rooms
2 Yerkes and Dodson (1908) study the relationship between the level of arousal and subjects’ performance in different tasks and reveal that performance, such as attention and working memory in a difficult task, will follow a bell-shaped curve when the level of arousal continues to increase. This result is also called the “Yerkes–Dodson law” in psychology.
3 The SDR is a potential claim on the freely usable currencies of members of the International Monetary Fund (IMF) and can be exchanged for these currencies. The valuation of the SDR is defined by adding the values in US dollars of a basket of major currencies, based on market exchange rates. From 31 January 2018 to 7 January 2019, the components of the SDR were the US dollar, the euro, the Japanese yen, the British pound and the Chinese renminbi. We use daily observations of the SDR valuation from the IMF database.
4 The VIX is a measure of volatility conveyed by S&P 500 stock index option prices, taking into account the market’s expectation of 30-day volatility.
5 n is the maximum number of tokens in the network. We use n = 15 and ignore the remaining words in each tweet. Therefore, each tweet can be coded as a 15-dimensional row vector and each vector component is a word index in a dictionary.
6 The batch size refers to the number of training samples used in one training iteration. A larger batch size can reduce training times but requires more GPU memory to load the training samples.
References
- Abdulla, Rasha A., Bruce Garrison, Michael Salwen, Paul Driscoll, and Denise Casey. 2002. “The Credibility of Newspapers, Television News, and Online News.” Education in Journalism Annual Convention, Florida, USA.
- Antweiler, Werner, and Murray Z. Frank. 2004. “Is All That Talk Just Noise? The Information Content of Internet Stock Message Boards.” The Journal of Finance 59 (3):1259–94. doi:10.1111/j.1540-6261.2004.00662.x
- Athey, Susan, Ivo Parashkevov, Vishnu Sarukkai, and Jing Xia. 2016. “Bitcoin Pricing, Adoption, and Usage: Theory and Evidence.” Working paper, Stanford Graduate School of Business.
- Barberis, Nicholas, Andrei Shleifer, and Robert W. Vishny. 2005. A Model of Investor Sentiment. Princeton: Princeton University Press.
- Blei, David M., Andrew Y. Ng, and Michael I. Jordan. 2003. “Latent Dirichlet Allocation.” Journal of Machine Learning Research 3:993–1022.
- Bollen, Johan, Huina Mao, and Xiaojun Zeng. 2011. “Twitter Mood Predicts the Stock Market.” Journal of Computational Science 2 (1):1–8. doi:10.1016/j.jocs.2010.12.007
- Brown, Gregory W., and Michael T. Cliff. 2005. “Investor Sentiment and Asset Valuation.” The Journal of Business 78 (2):405–40. doi:10.1086/427633
- Bühlmann, Peter, and Bin Yu. 2003. “Boosting with the L2 Loss: Regression and Classification.” Journal of the American Statistical Association 98 (462):324–39. doi:10.1198/016214503000125
- Buntine, Wray L. 1994. “Operations for Learning with Graphical Models.” Journal of Artificial Intelligence Research 2:159–225. doi:10.1613/jair.62
- Calomiris, Charles W., and Harry Mamaysky. 2019. “How News and Its Context Drive Risk and Returns around the World.” Journal of Financial Economics 133 (2):299–336. doi:10.1016/j.jfineco.2018.11.009
- Cassidy, William P. 2007. “Online News Credibility: An Examination of the Perceptions of Newspaper Pournalists.” Journal of Computer-Mediated Communication 12 (2):478–98. doi:10.1111/j.1083-6101.2007.00334.x
- Chang, Kai-Wei, Cho-Jui Hsieh, and Chih-Jen Lin. 2008. “Coordinate Descent Method for Large-Scale l2-Loss Linear Support Vector Machines.” Journal of Machine Learning Research 9:1369–98.
- Chollet, François, et al. 2015. “The Keras.” https://keras.io.
- Cong, Lin William, Ye Li, and Neng Wang. 2019. “Tokenomics: Dynamic Adoption and Valuation.” Working Paper, Becker Friedman Institute for Research in Economics.” 2018-49; Fisher College of Business Working Paper, 2018. 03–15.
- De Long, J. Bradford, Andrei Shleifer, Lawrence H. Summers, and Robert J. Waldmann. 1988. “The Survival of Noise Traders in Financial Markets.” National Bureau of Economic Research.
- De Long, J. Bradford, Andrei Shleifer, Lawrence H. Summers, and Robert J. Waldmann. 1990. “Noise Trader Risk in Financial Markets.” Journal of Political Economy 98 (4):703–38. doi:10.1086/261703
- Edmans, Alex, Itay Goldstein, and Wei Jiang. 2015. “Feedback Effects, Asymmetric Trading, and the Limits to Arbitrage.” American Economic Review 105 (12):3766–97. doi:10.1257/aer.20141271
- Fama, Eugene F., Lawrence Fisher, Michael C. Jensen, and Richard Roll. 1969. “The Adjustment of Stock Prices to New Information.” International Economic Review 10 (1):1–21. doi:10.2307/2525569
- Frank, Murray Z., and Ali Sanati. 2018. “How Does the Stock Market Absorb Shocks?” Journal of Financial Economics 129 (1):136–53. doi:10.1016/j.jfineco.2018.04.002
- Friedman, Milton. 1953. “The Case for Flexible Exchange Rates.” In Essays in Positive Economics, 157–203. Chicago: University of Chicago Press.
- Gaziano, Cecilie. 1988. “How Credible Is the Credibility Crisis?” Journalism Quarterly 65 (2):267–78. doi:10.1177/107769908806500202
- Glimcher, Paul W. 2011. Foundations of Neuroeconomic Analysis. New York: Oxford University Press.
- Goldstein, Itay, and Alexander Guembel. 2008. “Manipulation and the Allocational Role of Prices.” Review of Economic Studies 75 (1):133–64. doi:10.1111/j.1467-937X.2007.00467.x
- Gotthelf, Nina, and Matthias W. Uhl. 2019. “News Sentiment: A New Yield Curve Factor.” Journal of Behavioral Finance 20 (1):31–41. doi:10.1080/15427560.2018.1432620
- Grossman, Sanford J. 1995. “Dynamic Asset Allocation and the Informational Efficiency of Markets.” The Journal of Finance 50 (3):773–87. doi:10.1111/j.1540-6261.1995.tb04036.x
- Grossman, Sanford J., and Joseph E. Stiglitz. 1980. “On the Impossibility of Informationally Efficient Markets.” The American Economic Review 70 (3):393–408.
- Hansen, Stephen, Michael McMahon, and Andrea Prat. 2018. “Transparency and Deliberation within the FOMC: A Computational Linguistics Approach.” The Quarterly Journal of Economics 133 (2):801–70. doi:10.1093/qje/qjx045
- Hirshleifer, David, Ming Jian, and Huai Zhang. 2018. “Superstition and Financial Decision Making.” Management Science 64 (1):235–52. doi:10.1287/mnsc.2016.2584
- Hirshleifer, David, Avanidhar Subrahmanyam, and Sheridan Titman. 2006. “Feedback and the Success of Irrational Investors.” Journal of Financial Economics 81 (2):311–38. doi:10.1016/j.jfineco.2005.05.006
- Hornik, Kurt, Maxwell Stinchcombe, and Halbert White. 1989. “Multilayer Feedforward Networks Are Universal Approximators.” Neural Networks 2 (5):359–66. doi:10.1016/0893-6080(89)90020-8
- Hovland, Carl I., and Walter Weiss. 1951. “The Influence of Source Credibility on Communication Effectiveness.” Public Opinion Quarterly 15 (4):635–50. doi:10.1086/266350
- Jin, Zhiwei, Juan Cao, Yu-Gang Jiang, and Yongdong Zhang. 2014. “News Credibility Evaluation on Microblog with a Hierarchical Propagation Model.” ICDM’14: Proceedings of the 2014 IEEE International Conference on Data Mining, 230–9.
- Kaplanski, Guy, and Haim Levy. 2010. “Exploitable Predictable Irrationality: The FIFA World Cup Effect on the US Stock Market.” Journal of Financial and Quantitative Analysis 45 (2):535–53. doi:10.1017/S0022109010000153
- Lee, Raymond S. H. 1978. “Credibility of Newspaper and TV News.” Journalism Quarterly 55 (2):282–7. doi:10.1177/107769907805500209
- Lintner, John. 1975. “The Valuation of Risk Assets and the Selection of Risky Investments in Stock Portfolios and Capital Budgets.” In Stochastic Optimization Models in Finance, edited by William T. Ziemba, 131–55. Amsterdam: Elsevier.
- Lux, Thomas. 1995. “Herd Behaviour, Bubbles and Crashes.” The Economic Journal 105 (431):881–96. doi:10.2307/2235156
- Malkiel, Burton G., and Eugene F. Fama. 1970. “Efficient Capital Markets: A Review of Theory and Empirical Work.” The Journal of Finance 25 (2):383–417. doi:10.1111/j.1540-6261.1970.tb00518.x
- Mao, Xudong, Qing Li, Haoran Xie, Raymond Y. K. Lau, and Zhen Wang. 2016. “Multi-Class Generative Adversarial Networks with the L2 Loss Function.” arXiv preprint arXiv: 1611.04076, 5.
- Metzger, Miriam J., Andrew J. Flanagin, Keren Eyal, Daisy R. Lemus, and Robert M. McCann. 2003. “Credibility for the 21st Century: Integrating Perspectives on Source, Message, and Media Credibility in the Contemporary Media Environment.” Annals of the International Communication Association 27 (1):293–335. doi:10.1080/23808985.2003.11679029
- Nagura, Ryosuke, Yohei Seki, Noriko Kando, and Masaki Aono. 2006. “A Method of Rating the Credibility of News Documents on the Web.” Association for Computing Machinery (ACM): Proceedings of the 29th Annual International ACM SIGIR Conference on Research and Development in Information Retrieval - SIGIR 06, 683–4.
- Nakamoto, Satoshi. 2008. Bitcoin: A Peer-to-Peer Electronic Cash System. Satoshi Nakamoto Institute. https://nakamotoinstitute.org/bitcoin/
- Newhagen, John, and Clifford Nass. 1989. “Differential Criteria for Evaluating Credibility of Newspapers and TV News.” Journalism Quarterly 66 (2):277–84. doi:10.1177/107769908906600202
- Rumelhart, David E., Geoffrey E. Hinton, Ronald J. Williams, et al. 1988. “Learning Representations by Back-Propagating Errors.” Cognitive Modeling 5 (3):1.
- Saunders, Edward M. 1993. “Stock Prices and Wall Street Weather.” The American Economic Review 83 (5):1337–45.
- Shang, Zilu, Chris Brooks, and Rachel McCloy. 2014. “Are Investors Guided by the News Disclosed by Companies or by Journalists?” Journal of Behavioral and Experimental Finance 1:45–60. doi:10.1016/j.jbef.2014.01.003
- Sharpe, William F. 1964. “Capital Asset Prices: A Theory of Market Equilibrium under Conditions of rRsk.” The Journal of Finance 19 (3):425–42.
- Shiller, Robert J. 2003. “From Efficient Markets Theory to Behavioral Finance.” Journal of Economic Perspectives 17 (1):83–104. doi:10.1257/089533003321164967
- Shiller, Robert J. 2017. “Narrative Economics.” American Economic Review 107 (4):967–1004. doi:10.1257/aer.107.4.967
- Shleifer, Andrei, and Lawrence H. Summers. 1990. “The Noise Trader Approach to Finance.” Journal of Economic Perspectives 4 (2):19–33. doi:10.1257/jep.4.2.19
- Tetlock, Paul C. 2014. “Information Transmission in Finance.” Annual Review of Financial Economics 6 (1):365–84. doi:10.1146/annurev-financial-110613-034449
- Tetlock, Paul C., Maytal Saar-Tsechansky, and Sofus Macskassy. 2008. “More than Words: Quantifying Language to Measure Firms’ Fundamentals.” The Journal of Finance 63 (3):1437–67. doi:10.1111/j.1540-6261.2008.01362.x
- Thorson, Kjerstin, Emily Vraga, and Brian Ekdale. 2010. “Credibility in Context: How Uncivil Online Commentary Affects News Credibility.” Mass Communication and Society 13 (3):289–313. doi:10.1080/15205430903225571
- Uhl, Matthias W. 2014. “Reuters Sentiment and Stock Returns.” Journal of Behavioral Finance 15 (4):287–98. doi:10.1080/15427560.2014.967852
- Yerkes, Robert M., and John D. Dodson. 1908. “The Relation of Strength of Stimulus to Rapidity of Habit-Formation.” Journal of Comparative Neurology and Psychology 18 (5):459–82. doi:10.1002/cne.920180503
- Zhao, Hang, Orazio Gallo, Iuri Frosio, and Jan Kautz. 2017. “Loss Functions for Image Restoration with Neural Networks.” IEEE Transactions on Computational Imaging 3 (1):47–57. doi:10.1109/TCI.2016.2644865
Appendix A:
robustness for news credibility
Table A1. Robustness check for news credibility I.
Table A2. Robustness check for news credibility II.
Table A3. Robustness check for news credibility III.
Appendix B:
deep learning in social networks
To train our Twitter sentiment classifier, we use the Keras library designed by Chollet, et al. (Citation2015) and choose the TensorFlow library as the backend engine in Python. In our model setting, we construct a neural network with one embedding layer to transform 1 times n-word sequencesFootnote5 into 128-dimensional vectors, plus one long short-term memory (LSTM) layer and two dense layers. LSTM is an artificial recurrent neural network that can learn time series and sequential data. This structure is powerful for studying the meaning of sequential tokens without the n-gram preprocessing step for textual data. A dense layer is a regular layer in a neural network implementing the following operation:
where W is a weight matrix, b is a bias vector, dot(·,·) is a dot product operation between two tensors and activation(·) is an activation function to perform a non-linear transformation. We choose a rectified linear unit (relu) defined by max(0,·) as the activation function. More details on the construction of the network are provided in .
Figure B1. Neural network framework.
Note: This framework indicates each layer name in our neural network including the shapes of the input and output tensors. The input layer will receive the encoded 1 × 15 text vector and output to the embedding layer. The embedding layer will project each word index scalar in the input vector to a 128-dimension embedding space. The LSTM and dense layers mainly used to approximate the corresponding mapping between text and labels, and the flatten layer corresponds to reshape the high dimension input tensor to a low dimension tensor for the purpose to be operated in the bottom classification layer.
Training and validation accuracy

One of the challenges of deep learning is to appropriately define the parameters of the model. We experiment with different parameters and ultimately select the 30,000 most frequently used terms, including punctuation and emoji, to code the input narratives. Our collection includes 26,370 annotated training samples and 1,984 testing comments. The size of our training and testing data sets is smaller than the total collection of StockTwits, because we want to assign an equal number of “bullish” and “bearish” comments and reduce the noise of “neutral” comments. To this end, we divide the size of the “neutral” annotated sample by three, as some users may simply ignore or may be unwilling to provide their optimistic or pessimistic market expectations.
The main task of deep learning is to tune W and other parameters in each layer to minimize the distance between the predicted output and the true output using the back-propagation algorithm proposed by Rumelhart et al. (Citation1988). However, the computational complexity of back-propagation in a multi-layer neural network is enormous. For instance, in our relatively shallow neural network, there are 4,137,923 parameters that need to be tuned. To efficiently train our model, we use the NVIDIA TITAN Xp graphics processing unit (GPU) to execute the back-propagation algorithm, as a GPU can perform back-propagation parallel computing more efficiently than a central processing unit (CPU), selecting a batch size of 10,000 data Footnote6 to load the data into the GPU.
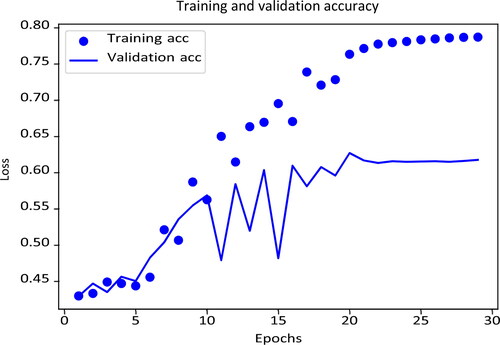
To validate the parameter setting and training accuracy of our model, we use iterated k-fold validation with shuffling to evaluate the performance of deep learning. This technique is useful when we want to accurately evaluate the overall performance of a classifier when the size of the training samples is relatively small. In practice, we divide the training data set into k = 10 parts. We use each part as a validation data set and train our model with the remaining data. This process will run four times and each time we will shuffle the data rows. presents one of the training and accuracy results, the overall validation accuracy after training is 65.90% (+/ − 2.55%) and the classification accuracy for the remaining 7% of the testing sample is 68.85%.
Figure B2. Deep learning accuracy.
Note: This figure denotes the training and validation accuracy among the iterated K-fold validation with shuffling training process. The horizontal axis indicates the number of a single time the neural network receives the whole training data, called epochs. The vertical axis represents the loss measured by the categorical crossentropy, which is a common loss function in a multi-classification machine learning problem.
By taking into account the noise caused by the “neutral” training data, the performance of our neural network classifier is much better than the baseline accuracy of a three-class classification problem at 33.33%.