
 ?Mathematical formulae have been encoded as MathML and are displayed in this HTML version using MathJax in order to improve their display. Uncheck the box to turn MathJax off. This feature requires Javascript. Click on a formula to zoom.
Abstract
This paper explores the powerful emotions unleashed during asset pricing bubbles. Adopting a psychoanalytic perspective, we develop a five-stage path-dependent model of such financial crises and test this empirically on the Chinese 2005–2008 and 2014–2016 stock market bubbles. Results are consistent with our underlying theory and demonstrate how investors experience a range of highly charged emotions directly related with different market states during such episodes. Our evidence suggests that if we wish properly to understand and explain such destructive events, we also need to recognize the fundamental role investor unconscious fantasies and market psychodynamic processes play in their etiology.
1. Introduction
In just over two years from July 2005 to its high in October 2007 the Shanghai Stock Exchange Composite Index (SSECI, aka the Shanghai Market Index) went up five times, with a rise of 60% alone in the last three months before it peaked. The market then collapsed, falling by 70% over the following year leading to a $3 trillion loss by investors. Both extreme market movements were independent of government economic policies or any valuation fundamentals. This trajectory bears a remarkable resemblance to that of the Dow Jones Internet Index during dot.com mania only a few years previously, and is consistent with a standard definition of a financial bubble (e.g., Greenwood, Shleifer, and You Citation2019).
At the peak of this bubble, the nominal market capitalization of the Chinese stock market placed it as the third largest in the world, even larger temporarily that than of Japan, and with the average Chinese stock price/earnings (P/E) ratio of 73, more than three and a half times that for the equivalent US firm (average P/E ratio of 20) (Yao and Luo Citation2009). The market then significantly underperformed international capital markets over the next five years. Perhaps reflecting the effects of the trauma they had experienced, investors showed little interest in the stock market despite the very strong performance of the Chinese economy.
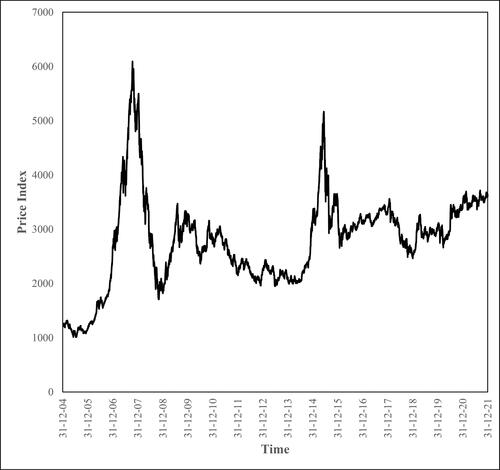
However, in 2014 the Chinese stock market suddenly took off again in an almost exact replay of the earlier bubble but in a more compressed time frame with the Shanghai Market Index increasing by 150% in less than a year, then crashing a second time. plots the SSECI from 2005 to the end of 2021 when it was still 40% below its peak in October 2007. How do we make sense of repeated stock market bubbles of this magnitude occurring in one of the largest and most successful economies in the world, and taking place seemingly with little apparent learning from experience?
Figure 1. The Shanghai Stock Exchange Composite Index (2005–2021).
There is a large finance literature on bubbles, predominantly of a mathematical nature (e.g., Barberis et al. Citation2018; Hirshleifer Citation2020; also see the studies cited in Brunnermeier and Oehmke Citation2013; Scherbina and Schlusche Citation2014; Greenwood, Shleifer, and You Citation2019). Nonetheless, the whole area is still contentious (O’Hara Citation2008), with some economists still denying bubbles exist. Eugene Fama, for example, used his acceptance speech for his 2013 Nobel Prize in Economics in Stockholm to try to explain away their existence describing the term “bubble” as “treacherous” (Fama Citation2014, 1475). In traditional economic theory bubbles should not occur, in part due to their conflict with the underlying assumptions of economic rationality (e.g., Shiller Citation2015, 195–213; Greenwood, Shleifer, and You Citation2019)!
This paper takes a different approach to extant work on financial bubbles. Our main thesis is that asset pricing bubbles are highly emotional processes engaging market participants very directly in a way which can only properly be understood in psychodynamic terms, as the language used to describe them demonstrates. Phrases such as “insane…blind passion…financial orgies…frenzies…feverish speculation…epidemic desire to get rich quick…wishful thinking…intoxicated investors…turning a blind eye…investors living in a fool’s paradise…a raging appetite… etc” (Aliber and Kindleberger Citation2015, 55) are common.
Hageback (Citation2017), in this journal, develops a rich theory of financial bubbles based on analytical psychologist Carl Gustav Jung’s insights into the archetypes of the collective unconscious. In parallel, Hageback (Citation2014) suggests how it might be possible conceptually to measure archetypal forces in financial markets, although without direct empirical application. Adopting a different perspective, Cheung (Citation2010) seeks to measure market mood and whether in bubble situations “Mr. Market” suffers from bipolar disorder. In another paper, Fenzl and Pelzmann (Citation2012) explain how financial markets are social processes with booms and panics shaped by mass psychology and the interaction between investors and market dynamics, and demonstrate the failure of traditional economic models to explain departures from fundamental value.
We take a related approach to Hageback (Citation2017) equally recognizing the key role played by unconscious processes and the broad panoply of powerful emotions that investors experience in bubble markets, although drawing on psychoanalytic theory as our ontology. In particular, we measure the emotional states investors are caught up in during the different stages of a market bubble which drive, and are driven by, market dynamics. This approach differs to standard positive-negative/good-bad sentiment analysis (e.g., Tetlock Citation2007; Tetlock, Saar-Tsechansky, and Macskassy Citation2008; Loughran and McDonald Citation2020; Uhl and Novacek Citation2021) as we are concerned with the range of highly charged emotions investors are experiencing in different stages of an asset pricing bubble rather than “tone.”
No attempt is made here to assign causality since emotions are highly charged and spontaneous in their effects in line with System 1 intuitive and reflexive mental processes which are automatic, effortless, and lead to immediate action (e.g., Kahneman Citation2012). As such, any such effectively synchronous bi-directional relationships are impossible to disentangle except, at best, on a market microstructure basis.
In developing our psychodynamic model of speculative bubbles we draw on a representative case study, that of the Chinese market between July 2005 to December 2008. We then test empirically whether our theoretical model fits both this bubble and the subsequent bubble of 2014–2016 using formal content analysis of Chinese media reports (Neuendorf Citation2017).
Our evidence suggests that the belief in the existence of and search for the phantastic object (Tuckett and Taffler Citation2008), the fantasy of being able to generate great wealth without effort, is likely to be a key driver of investor behavior in bubble markets. Initially satisfying basic assumption group dynamic processes allow investors operating in a paranoid-schizoid state of mind to collude in the excitement that the phantastic object is real until external reality can no longer be denied. The bubble then bursts with associated emotions of panic, loss, anger and blame.
All bubbles require a superficially plausible popular narrative to justify the departure from underlying reality and to support the collective fantasy that what is not possible can really happen (Aren and Hamamci Citation2021). In our case, we show how the story or “powerful narratives” (Shiller Citation2017) in both 2005 and 2014 was one of the Chinese government’s changed attitude toward the capital markets and associated reforms signaling “this time it’s different,” with the associated wishful thinking prices could never fall. The government would never let this happen!
We make a number of contributions to the extant literature. First, we demonstrate how investor fantasies and group processes play a key role in the understanding of speculative bubbles. Second, we develop a theoretical five-stage emotionally-driven path-dependent model of bubble market dynamics to explain its different stages built on the investor search for phantastic objects and basic assumption group psychodynamic processes which has potential broader application to other asset pricing bubbles outside the immediate Chinese environment. These might include such cases of market “breakdown” as dot.com mania, the Global Financial Crisis, and, more generally, the myriad of financial bubbles Aliber and Kindleberger (Citation2015) and Quinn and Turner (Citation2020) describe, as well as, most recently, cryptocurrencies, electric vehicles and meme stocks etc. Third, we test our theory empirically drawing on contemporaneous popular narratives in Chinese language media reports. In particular, we develop rich Chinese language emotion-word dictionaries allowing us to measure the salience of different investor emotions during different stages of our two market bubbles. These are capable of much more general application. Finally, we add to the growing literature on textual analysis using media reports and demonstrate these can yield useful proxies for underlying investor emotional states in the consideration of economic and policy-related issues (e.g., Baker, Bloom, and Davis Citation2016).
Our empirical results are consistent with our psychoanalytically-informed theoretical model and suggest that acknowledging the vital role the investor’s unconscious plays in such market episodes can provide an enhanced understanding of these extreme events. Interestingly, the direct rerun of the earlier Chinese bubble only a few years later suggests an inability to learn by market participants which, we argue, condemns them to have to repeat such traumatic experiences.
The next section develops our psychoanalytic theory and the integral role played by cover stories in bubbles. Following this, we describe the 2005–2008 Chinese stock market bubble and its contemporaneous media narratives. Our path-dependent emotional trajectory which establishes our associated predictions is tested formally on the 2005–2008 bubble in the following two sections. The first of these describes our content analysis method and emotion keyword dictionary development and the second conducts the associated empirical tests. Our penultimate section tests our model out-of-sample on the subsequent 2014–2016 bubble. Our final section summarizes what we find, discusses our contribution, and concludes.
2. Stock markets and investor emotions
A cursory review of the 2005–2008 and 2014–2016 Chinese stock market bubbles and the associated stories published in the Chinese media clearly show how investors were caught up emotionally. Caution was put to one side and warnings ignored in the excitement as the market took off and raced to its peak, replaced by panic and, in due course, blame when the bubble burst and reality intruded, as it eventually had to. In contrast to neoclassical economic theory which views economic actors as homo economicus, and thus “rational,” this paper argues that we need to recognize how people’s emotions are key drivers of their investment behavior.
Investors can be viewed as entering into what psychoanalysts describe as object relationships with their stocks or other assets which are inherently ambivalent, charged with anxiety (e.g., Taffler Citation2018), and can be highly cathected (e.g., Aspara and Tikkanen Citation2010). Stocks are at the same time both “exciting” in terms of potential future returns and prone to the pain of loss, leading to emotional conflict. Consequently, what the investor does not want to acknowledge is unconsciously defended against by splitting off, repressing and projecting elsewhere leaving only the exciting, good feelings in what the psychoanalyst Klein (Citation1952) describes as a paranoid-schizoid state of mind. As such, we would expect investors to experience highly charged and often contradictory emotions in different stages of a market bubble. The market and individual stocks are “idealised” as prices shoot up with any doubt rendered unconscious and projected onto others who “don’t get it.” However, when the bubble bursts these investments now become all bad with others (the government, markets, advisors, the media, etc.) blamed for the collapse of the original exciting phantasy, and the resulting financial losses.
As well as individuals operating in a paranoid-schizoid state of mind, we also need to recognize how markets behave as large virtual groups which take on their own identity and parallel characteristics to individuals. In asset pricing bubbles, group processes both reflect and support investors’ delusional beliefs until the bubble bursts, when the opposite now occurs. Together with the concept of the phantastic object, the understanding of basic assumption group dynamics and the role of narrative rationale, discussed below, these ideas help inform the development of our underlying theory.
2.1. The phantastic object
We believe that any investment can be viewed as potentially exciting and transformational in unconscious terms and see this as fundamental to understanding asset valuations. The idea of the phantastic object is used to convey this argument more formally and connotes
…a mental representation of something (or someone) which in an imagined scene fulfils the protagonist’s deepest desires to have exactly what she wants exactly when she wants it. … [P]hantastic objects allow individuals to feel omnipotent like Aladdin (who owned a lamp which could call a genie); or like the fictional bond trader, Sherman McCoy (who felt himself a Master of the Universe [Wolfe, 1987]). (Tuckett and Taffler Citation2008, 395–396)
According to Tuckett and Taffler (Citation2008) the term is derived from two ideas. The Freudian concept of object denotes the mental representation of something but not the actual thing itself. Phantasy or phantastic is a technical psychoanalytic term used to describe an individual’s unconscious beliefs and wishes, which it teaches are derived from the earliest stages of an infant’s mental development. Phantastic objects are inherently alluring: “… (they) appear to break the usual rules of life and turn aspects of ‘normal’ reality on its head; creating the impression that what was previously thought impossible or permanently elusive might happen after all” (Tuckett and Taffler Citation2008, 396). Asset pricing bubbles reflect the metamorphosing of actual assets into exciting, emotionally fulfilling and magical ones in the minds of those investors caught up in them. The concept of the phantastic object reflects just this process.
2.2. Basic assumption groups
Markets are large virtual groups with behavior that both reflects the needs, drives and phantasies of their investors, and reflexively influences their beliefs and actions. In an asset pricing bubble where there is the shared belief the phantastic object is real a basic assumption group (Bion Citation1952) exists. The market departs from its role of setting asset prices in an unbiased way to that of encouraging investors’ wishful thinking. Acting as a large virtual group, they unconsciously collude in the exciting fantasy that the phantastic object is real. Anything that might challenge the idea that prices can only ever go up is strongly defended against; any sense of underlying reality is not allowed to intrude in any way.
Bion (Citation1952) describes three types of basic assumption group process, fight-flight, dependency and pairing. Fight-flight refers to the tendency of groups to either attack an object directly, as with any challenge to the phantastic object as the bubble inflates, or run away from it in a state of panic when the bubble bursts. The phantasy of dependency relates to how a basic assumption group looks to a leader to care for it and provide security, who in our case is clearly represented by the Chinese government. In the pairing basic assumption group, there is equally an inability to engage with reality. The group is now riven by the excitement that “pairing” will take place to create a notional “messiah” to solve all its problems, and which can perhaps be conceived in a bubble context as represented by the phantastic object itself.
Thus, in psychodynamic terms, asset pricing bubbles can be characterized by the existence of a phantastic object, investors operating in a paranoid-schizoid state of mind, the market acting as a basic assumption group, and a superficially credible narrative to provide the veneer of legitimacy and a rationale for the underlying phantasy (Aren and Hamamci Citation2021).
The next section describes the events of the 2005–2008 Chinese stock market bubble and its associated narratives as it played out to help us understand what, how, and why it happened, and assist us in developing our underlying theory and explanatory model. It also explores the different powerful emotions Chinese investors were experiencing at different stages during the bubble’s path dependent trajectory as reflected in how it was being reported on in both the Chinese and non-Chinese media. For reasons of space, a parallel description of 2014–2016 bubble events is not attempted, although even a cursory examination of contemporary media reports shows similar investor emotions as salient in different stages of this second bubble. We test empirically whether our psychoanalytically-informed model of asset pricing bubbles also fits this bubble in a similar way in the penultimate section of this paper.
3. Five-stage path-dependent emotional asset pricing bubble trajectory
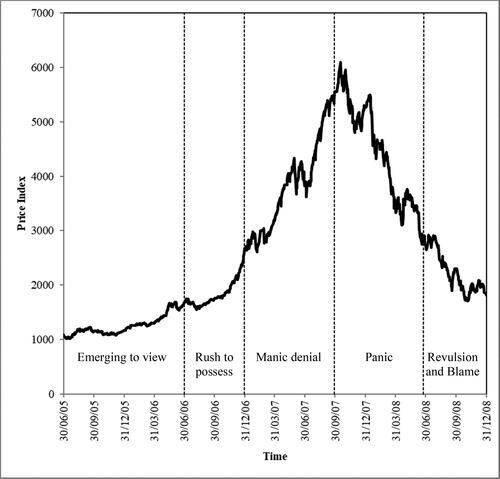
Speculative bubbles or “manias” constitute an essentially emotional process. Based on detailed analysis of financial crises throughout history Aliber and Kindleberger (Citation2015, 39–46) describe asset pricing bubbles in terms of a 3-stage process. However, based on a detailed psychoanalytic reading of the dot.com bubble, Tuckett and Taffler (Citation2008) suggest a richer dynamic model with (p. 394): “… patchy excitement about an innovation leading to growing excitement, leading to manic or euphoric excitement, then turning to panic and finally resulting in blame … [and] invariably a wish to identify scapegoats … rather than guilt.” Following Tuckett and Taffler (Citation2008) we establish a formal representation of a five-stage speculative bubble: emerging to view, rush to possess, manic denial, panic, and revulsion and blame. We recognize these different stages will inevitably overlap to some extent as the “psychodrama” unfolds. Nonetheless, in our case studies of two Chinese stock market bubbles, we break down our analysis into these five sequential phases for illustrative purposes.
The underlying research question we address is whether the nature of the emotionally-driven path-dependent trajectory we hypothesize describes the morphology of the Chinese stock market bubbles. Is our psychologically-informed model consistent with the emotional meaning Chinese stocks seemed to represent for investors during these periods, and what were the consequences?
3.1. Emerging to view
We term our first stage “emerging to view” when Chinese stocks began to be perceived as transformational phantastic objects in the minds of investors, and prices began to move upwards. Examining the Shanghai Market Index graph of for the 2005–2008 bubble, the 12-month period from the beginning of July 2005 to the end of June 2006 appears to reflect its initial phase.
Figure 2. The 2005–2008 Bubble: The Shanghai Stock Exchange Composite Index – an emotional trajectory.
The Shanghai Stock Exchange and Shenzhen Stock Exchange were both founded by the Chinese Government only at the end of 1990 although their development lagged significantly behind China’s economic reforms. By mid-2005 the Shanghai Market Index had been hovering not much above the 1,000 mark for almost four years after collapsing from its previous high of over 2,200 in 2000. In contrast, Chinese GDP had been growing at an annual rate of 8–10%, and the stock markets of the other three main developing economies, Brazil, Russia and India, had all been booming. Commentators rationalized the poor investment performance of Chinese equity markets as due largely to the general lack of government interest in the capital markets and the fact that two-thirds of the market value of the Chinese exchanges was accounted for by the stocks of state-owned enterprises (SOEs) which were non-tradable (“Hangover cure? China’s stock markets,” The Economist, 13 August 2005). The lack of linkage between China’s capital markets and economic progress seemed to be a paradox.
It is difficult to identify exactly what triggers an asset pricing bubble, and this is equally true in the case of our two Chinese stock market bubbles. The awakening of awareness of the potential opportunities offered by the Chinese stock market to investors toward the end of 2005 was likely due to a change in government policy toward the capital markets. There was now obvious commitment to market reforms. These included encouraging state-owned enterprises to make their non-tradeable shares tradeable, as well as opening up the local Chinese stock markets to international investors. In this way, a strong positive message was sent about a revitalized investment environment and the associated likelihood of a sustained recovery in stock prices (e.g., “Market insights: growing optimism in the Chinese stock market,” Financial Times, 26 January 2006; “Stock market expected to see a bullish year,” China Daily – Hong Kong edition, 24 January 2006).
Another signal of the new zeitgeist in China’s equity markets was the high-profile initial public offering (IPO) of one of China’s large banks, China Construction Bank, on the Hong Kong Stock Exchange on 20 October 2005, raising $9.2bn. The Chinese stock market now appeared to have the potential to provide an appropriate environment in which the search for the phantastic object to which investors are readily prone might be realized. In fact, by the end of 2005 the market was up by 16%, and there was a renewed sense of optimism about its fate in the Chinese calendar year of the dog (2006), “man’s best friend.” By the beginning of April 2006, the Shanghai Market Index was up 30%, the ceiling most analysts had set for the year (“Running with the bulls tests courage despite bitter memories of false dawns, Shanghai’s soaring stock market is winning over skeptics as foreigners lead the way,” South China Morning Post, 17 April 2006).
This powerful rally offered hope to investors, and there was even a Feng Shui Index which predicted investors would enjoy a relatively sustained run-up in 2006 (“Advice for investors in China: consider an 11-month vacation,” The Wall Street Journal, 28 February 2006). By May, the Chinese stock market had soared to a level more than 50% higher than a year previously, and in that month the Bank of China also floated on the Hong Kong Stock Exchange raising $9.7bn, the world’s largest public share offering in the previous 6 years. Other large listings were clearly due to follow, including on the local stock markets, with investor demand for the new shares greatly exceeding supply leading to very high first day returns and stoking the excitement.
The usual cover story for an asset bubble of “this time it’s different” (Aliber and Kindleberger Citation2015, 41) was that the capital markets had completely changed. The narrative seemed to be that government reforms were likely to lead to a continuing increase in share values, and that the stock market’s longer-term trend would reflect better the continuing growth in GDP. The highly charged excitement conveyed by the financial media and websites, which themselves reflected what readers wanted to hear, as well as how the journalists themselves were equally caught up, further stimulated the desire of Chinese investors to invest in the stock market after its more than five years of stagnation. The investment fantasy took on the nature of a one-way bet; the government would ensure there was no downside risk. There was a pervasive sense that it was “time to get on the train before it leaves the station” (Aliber and Kindleberger Citation2015, 21).
3.2. Rush to possess
Next, in line with basic assumption group dynamics, once these unconscious mental images are established in this way, we predict a headlong and compulsive craze among investors to acquire more of such assets at almost any price. This is helped by observing how other investors have profited so well from their speculative activity, inter alia assisted by the media. The “rush to possess” phase is represented in as the 6 months from the beginning of July 2006 to the end of the year.
The run of high-profile IPOs of large state-owned enterprises continued to gather pace increasing investor excitement levels with the Industrial and Commercial Bank of China (ICBC), the nation’s largest lender, raising $21bn in October 2006 and making it the largest IPO ever in the history of the world’s capital markets. By the following month the Shanghai Market Index was up 75% since the beginning of the year, double its 8-year low in July the previous year.
3.3. Manic denial
Following these two stages we predict a crucial third stage with asset prices continuing to boom, and departing even further from fundamental value, despite increasing evidence that such stock valuations are clearly unrealistic and unsustainable. Normal investment criteria are no longer salient when applied to phantastic objects. This is due to the ways investors unconsciously collude in a basic assumption group to maintain the exciting wish-fulfilling fantasy against the external challenges of material reality. We label this phase from the beginning of 2007 to approximately the end of September in one of “manic denial” because “The sense of omnipotence … is what first and foremost characterizes mania, and, further… mania is based on the mechanism of denial” (Klein Citation1935, 161, emphasis in original). Here, the process of denial involves the rejection of anything or anyone that might interfere with the fantasy that the phantastic object is real and price rises can continue forever.
In common with other bubbles, at this stage there was enormous pressure to join in. The perceived promise was that if you wanted to be rich you only had to put money into stocks or mutual funds since everyone else appeared to be getting rich with no effort in this way. As Shiller (Citation2014) points out, “fear of missing out” is integral to the bull phase of a speculative bubble. Even if, on one level, it had been possible to recognize this manic excitement for what it was, and “know” the stock price increases could not continue forever, it would still be very difficult not to be caught up. Everyone seemed to want a stock tip (e.g., “Chinese united by a common goal: a hot stock tip,” New York Times, 30 January 2007). Direct parallels with the manic excitement experienced in a similar phase of the dot.com bubble will be noted (e.g., Cassidy Citation2002).
The dramatic returns delivered by the Chinese stock market in 2006, more than doubling, were already creating concerns of a potential bubble as early as January 2007, with many important public figures issuing warnings about a bubble and that investors should be concerned about the risk (“Warning of bubble in China’s stock market,” Financial Times, 30 January 2007). Not surprisingly, this increasing volume of warnings was dismissed by investors. In February 2007, the Vice-Chairman of the National People’s Congress, China’s highest legislative body, stated 70% of domestically-traded companies were worthless, and should be delisted. He also criticized investors swept up in the bull market: “Some people’s brains are obviously starting to get hot” (“Hot and cold – China’s stock market,” The Economist, 10 February 2007). Even Alan Greenspan, the then Chairman of the Federal Reserve, warned that China’s stock market was heading for a crash and that “there is going to be a dramatic contraction as some point.” However, investors paid little heed to this and other warnings (“Investors pay little heed to Greenspan,” Bloomberg, 25 May 2007). IPOs were continuing to increase dramatically in value on day one with the number of individual investor trading accounts multiplying. From this perspective, China’s bull market run was almost like an unstoppable train, going faster and faster (“Bubble economics,” Wall Street Journal Asia, 14 February 2007). Very few analysts were betting against the market and experienced professional investors seemed equally caught up in the fantasy (“Where corruption is a buy signal millions of Chinese seek stocks amid ‘blind optimism’,” International Herald Tribune, 17 February 2007).
Foreign investors were also seeking to buy into China’s stock market appearing to believe that China could provide a safe haven for funds prone to the vagaries of the US stock market (“Time to stop worrying and start investing,” Financial Times, 6 March 2007; “Taking stock in China,” The Wall Street Journal, 6 March 2007). Consistent with this, Bae and Wang (Citation2012) show how during the bubble Chinese firms listed on US stock exchanges that had “China” or “Chinese” in their company names significantly outperformed their counterparts without such specific identifiers with an annualized abnormal return of 123%. The continuing actions of the Chinese government were also reassuring to investors (“China shrugs off losses as market swings back,” New York Times, 1 March 2007).
The legitimating narrative underpinning the investment fantasy moved from the government’s stock market reforms to continuing economic prosperity. The common view seemed to be that “since the economy is doing well there is no doubt the stock market will continue to grow over the next year or two” (“A rapid rebound: Chinese stocks set record,” The New York Times, 22 March 2007). As the market raced to its peak even financial commentators seemed to give up on pointing out the acute risk of the collapse in prices the Chinese stock market was facing despite the market rising by no less than 45%, or more than twice the rate of the previous quarter, between July and September 2007. No one seemingly wanted to listen. Institutional investors were equally optimistic, attributing the performance of the stock market to the Chinese government’s effective stock market reforms (“Chinese investors’ stock market survey report,” Xinhua News, August 3, 2007 [in Chinese]). Despite the beginnings of the sub-prime crisis, and the fall in the US market, the continuing rapid rise in the Shanghai Market Index supported the “closed and safe stock market” fantasy, and the idea of the oxymoron of a “rational bubble” (“Growing debt crisis slams Asian markets, blurs outlook… how China continues to defy share slump; ‘rational bubble’,” Wall Street Journal Asia, 20 August 2007). It had all the characteristics of a phantastic object; prices could never fall.
The Shanghai Stock Exchange Composite Index peaked on October 16, standing almost 6 times where it had been only two years previously. With Shanghai stocks then trading on a price/earnings ratio of more than 70, absurd valuations were being rationalized away with superficially plausible stories used to deny reality. However, not surprisingly, external reality could not be held at bay forever, and the market went into freefall.
3.4. Panic
Ultimately, exciting fantasies are unsustainable. The emotional logic underpinning the extreme valuations of Chinese stocks was no longer maintainable, and the stock market imploded almost overnight. Awareness of having been caught up in what had turned out to be only wishful thinking was experienced both emotionally, in terms of having to give up what the phantastic object represented psychically, and in the resulting financial loss. Investors now sought to liquidate their investments as fast as possible. This is the “panic” phase. Although the Shanghai Market Index peaked 16 days later, to simplify our empirical analysis we delineate this market state as the 9 months from the beginning of October 2007 till the end of June 2008 in .
What burst the Chinese stock market bubble is arguable; there did not appear to be one particular event to which this can be attributed. Stock valuations were so unrealistic that not very much was needed. One important component of the pricking of the bubble was probably increasing concerns about the impact of the beginnings of the financial crisis in the US on East Asia. Perhaps, despite investors’ wishful thinking, stock markets were not disconnected after all. Toward the end of November 2007, the Chinese government issued a report warning that a US recession could be “devastating” to China’s manufacturing sector (“China’s market mood swing,” Time, 22 November 2007). Also, more generally, anxiety about how long prices could continue to rise could not be repressed any longer, despite the belief among many key investors that the Chinese government would not allow a stock market collapse at least until after the closing ceremony of the Beijing Olympics in August 2008 (“On Asia: how long can China remain in orbit?,” Financial Times, 26 October 2007).
Nevertheless, at the beginning, investors remained determinedly optimistic. “It will all bounce back in the second quarter,” and “Asia is still booming” (“Asia half full,” Financial Times, 4 December 2007). Denials continued; investors did not want to know. The World Bank repeated its forecast of an increase in the Chinese growth rate for 2007, and a similar high figure for 2008, and viewed the consequences of a Chinese stock market “correction” for the wider economy as “likely to be fairly limited” (“East Asia likely to surge on amid US slowdown,” Financial Times, 16 November 2007). However, the Shanghai Market Index had fallen over a fifth from its peak by the end of November 2007, and weekly stock trading volumes were down to only 20% of that earlier in the year (“The short view,” Financial Times, 29 November 2007).
Panic replaced euphoria almost overnight. Once investors believed market prices were no longer supportable any news which reinforced these feelings would be amplified leading to a stampede to sell their stocks pushing prices down further. By the first quarter of 2008 the Chinese market was 40% off its peak. The world’s best performing market had suddenly turned into one of the worst. Between June 3 and June 17 (a mere 10 trading days) the Shanghai Market Index plunged by a further quarter. Investors could no longer deny reality and manic excitement turned to anger and blame. An additional issue related to the inherent contradictions in the market. The Chinese government’s previously “all good” market reforms were now held liable for the large number of IPOs flooding the market, leading to a glut in new shares with limited demand, and one more reason given to rationalize the share price fall (“Supply demand relationship crucial in China stock market fall,” Asia Pulse, 18 August 2008). The US sub-prime mortgage crisis and global inflation also dented investor confidence.
3.5. Revulsion and blame
Fifth and finally, after the dramatic collapse in stock market valuations, we predict feelings of embarrassment, shame and loss, but not guilt, will continue to predominate. Investors will be wary of further involvement in the market that has let them down so badly, with adverse consequences for quite a significant period of time. Those caught up in the bubble will look for other parties to blame and scapegoat rather than themselves. This we term the “revulsion and blame” phase and view it in as the 6-month period from the beginning of July 2008 till the end of December 2008 when our bubble analysis concludes.
Chinese investors were in no doubt who was responsible – Beijing – with the state owning 70% of the equity of listed company shares (“Market slump deters investors in India and China,” Financial Times, 11 April 2008). In fact, a June 2008 poll conducted by Chinese television found more than 80% of those surveyed saying the government was at fault for their market losses (“Shanghai losses test pensioners’ faith,” Financial Times, 20 June 2008). In their turn, fund managers, who claimed not to have acted “inappropriately” or “irresponsibly” as some investors had charged, blamed retail investors who “turned a blind eye to the risks” and “pumped more and more money into equity funds even when the market was overheated” (“Equity funds hit by crash,” China Daily, 30 August 2008). However, there was no evidence in any of the large number of media reports on the causes of the bubble that investors themselves blamed their own judgment or of being caught up in an investment fantasy. There was only anger that their dreams had been thwarted. Interestingly, this highly emotional trajectory differs little to that manifest in myriad other asset pricing bubbles starting with the Dutch Tulip Bubble of 1636 and the South Sea Bubble of 1720 through to the repeated stock market and real estate bubbles of recent decades as both Aliber and Kindleberger (Citation2015) and Quinn and Turner (Citation2020) eloquently demonstrate.
4. Predictions
In this section, we establish the following predictions to help us test our five-stage path-dependent bubble theory empirically on the 2005–2008 Chinese stock market bubble. We do this by measuring the relative salience of different investor emotions in its different stages proxied using Chinese media reports. We repeat these tests on an out-of-sample basis on the subsequent 2014–2016 bubble in section 7.
Main thesis
P0: different investor emotional states are key to the understanding of an asset pricing bubble.
Emerging to view phase (July 2005 to June 2006)
P1: investor excitement will increase in line with the market index.
Rush to possess phase (July 2006 to December 2006)
As investor confidence increases with the market seemingly continuing its inexorable rise, anxiety will abate, at least for now.
P2: levels of excitement will continue to rise in line with the market index and anxiety fall.
Manic denial phase (January 2007 to September 2007)
In this stage of the bubble, we expect investors will be pulled simultaneously in different directions. Levels of manic excitement (mania) will ramp up to their highest levels as the market index races to its peak. However, our theory suggests that coupled with this, anxiety will be magnified with investors aware on one level things are “too good to be true” and in a sense they are on “borrowed time.” Directly associated with this, high levels of denial, which are an integral part of the mania, or investors “turning a blind eye” (Steiner Citation1985) will be manifest. In our case, this can be measured by the volume of warnings about the unsupportable nature of market prices with no apparent impact on the stock market index. Our associated prediction follows:
P3: mania will rise to a peak in parallel with increasing levels of anxiety and denial.
P4: levels of mania and excitement will collapse and panic and anxiety rise to a high.
Revulsion and blame phase (July 2008 to end 2008)
P5: revulsion and blame will be at their highest level.
5. Research method
To test the degree of fit of our emotionally-driven theory of asset pricing bubbles in the Chinese market empirically we need to measure salient investor emotions at different stages as our two bubbles play out. To do this we employ contemporaneous news reports, articles and opinions published in the Chinese media to reflect directly or indirectly what investors might be experiencing and feeling as stock prices shoot up, and then plummet. Sociologists describe how the media has a reflexive and performative relationship with its audience (Kury Citation2014) helping to make sense of and “organise the world” (Gamson et al. Citation1992, 384). Journalists both report on what is happening, and provide plausible explanations (or rationalisations) for events as they unfold. In this way they generate meaning for their readers triggering an emotional response, and associated reaction reflected in stock price movements. Similarly, financial journalists are likely themselves to be active investors and prone to being swayed by the same powerful emotions as their readers which will inevitably affect the way they report on an asset pricing bubble as it unfolds. Equally, they will want to write about, and be encouraged by their editors to write about, what their audience wants to hear (Ho and Liu Citation2015) with such positive “feedback” reinforcing existing investor emotional states. In fact, Griffin, Hirschey, and Kelly (Citation2011) further justify the appropriateness of this approach in their study demonstrating empirically how the market reacts to the financial media, Peress (Citation2014) and Engelberg and Parsons (Citation2011) show how media coverage influences trading, and Dougal et al. (Citation2012) how journalists have a causal impact on market prices. In a related vein Baker, Bloom, and Davis (Citation2016) demonstrate how their economic policy uncertainty (EPU) index based on newspaper coverage word frequency directly reflects movements in policy-related economic uncertainty.
For all these reasons, we employ Chinese language media reports as a window on the Chinese investor “psyche.” Most content analysis studies in the finance literature seek to measure investor sentiment or tone in terms of the ratio of positive words to negative words in the relevant discourses using established keyword dictionaries (e.g., Henry Citation2008; Tetlock Citation2007; Tetlock, Saar-Tsechansky, and Macskassy Citation2008; Loughran and McDonald Citation2011, Citation2016, Citation2020). Here we build on this traditional approach by employing content analysis methods to measure the relative salience of a range of different investor emotional states in different phases of the Chinese bubbles using six keyword dictionaries: excitement, anxiety, mania, denial, panic and revulsion and blame. Specifically, to allow us to test our psychodynamically-informed theory of market bubbles empirically, we construct our emotion-word dictionaries using articles published during the 2005–2008 bubble period, and subsequently also apply these in the analysis of the 2014–2016 Chinese stock market bubble.
In the next sub-section, we explain why these particular emotions are important and then describe how we construct our keyword dictionaries. Following this we describe our main research corpus and in the final sub-section the construction of the variables we work with in our empirical analyses.
5.1. Selection of emotion word categories
Investment decisions create strong emotions inter alia of both excitement (associated with the pleasurable idea or fantasy of actual or imagined future gains) and anxiety (over the potential pain of actual or potential future loss). Thus, we need keyword dictionaries to allow us to measure the levels of excitement and anxiety reflected in articles in the Chinese media commenting on the Chinese stock market during our periods of interest. In parallel, to explore different investor emotional states as our bubbles unfold, and test our predictions directly, we want equally to “quantify” levels of investor mania, denial, panic and revulsion and blame over time, and need to develop the necessary keyword dictionaries to allow us to do this.
5.2. Research corpus
All the media reports we analyze are published in Chinese and as such are directly accessible to Chinese investors. These we download from the Factiva database. To arrive at a complete corpus of news stories and articles referring to the Chinese stock market suitable for our purposes we first search systematically in Factiva for relevant articles each month from January 2005 to December 2008 using the following search conditions:
Searching keywords: (all in Chinese) Chinese stock/share market OR Chinese stock/share OR stock/share market OR stock/share
Region: China; Beijing; Shanghai; Shenzhen etc.
Language: Simplified Chinese
Sort by: Relevance
Subject: Equity markets
In total, we end up with a corpus of 9,195 news stories and articles suitable for analysis, an average of around 190 a month (or just under 600 a quarter as our empirical analysis is conducted on a quarterly basis). The top five publications drawn on are the Chinese language versions of Reuters, The Wall Street Journal, AFX Asia, InfoTimes, and Finet HK. Since all downloadable media news and articles published in China in Chinese are censored by the Chinese government there is the potential issue that such “stage-managed” news could obfuscate the underlying investor emotions we are seeking to measure at different phases of a bubble. However, such a reporting bias, if present, can only work against any results we might find. Although we do not explore such issues directly here, in unreported parallel analysis using non-censored English-language Western media sources our conclusions are broadly similar suggesting such concerns may not be too serious.
5.3. Construction of keyword emotion dictionaries
Henry and Leone (Citation2016) show that domain specific wordlists in content analysis perform better than general wordlists, and also equal weighting of words is just as successful as more complex weighting procedures. Since to the knowledge of the authors there are no existing emotion word dictionaries in Chinese, and certainly none directly relevant for our purposes, we build domain-specific dictionaries ourselves by hand-collecting relevant emotion words from the Chinese media.
First, we divide the 4-year period from January 2005 into 16 quarters using the first 6 months to represent a pre-bubble period for data standardization purposes. Then, for each quarter using our corpus of media reports, we rank publications by frequency of relevant news stories and articles identified. Two relatively long articles appropriately selected are next downloaded from each of the top five sources in each quarter, making 160 different ones in total, and physically inspected for content appropriate for emotion word dictionary construction purposes. All words in these articles that have emotional connotations are first highlighted by two Chinese research assistants independently and assigned into our six emotion categories (excitement, anxiety, mania, denial, panic, and revulsion and blame), with classifications then compared. The small number of disagreements resulting are resolved in discussion between the two coders leading to final agreed emotion keyword dictionaries for empirical application. As denial is a more repressed emotion, and thus more difficult to measure directly, we proxy it by mentions of ‘bubble warnings’.
However, the volume of words in a number of our emotion categories are too great for ready application in the main stage of our research which involves analysis of our full article corpus (see below) so words appearing with very low frequency are removed. This leaves 241 different words in total across our 6 emotion categories. Appendix 1 provides our keyword dictionaries by emotion word category in Chinese, together with English translation.
5.4. Data analysis and variable standardization
Wordscount,Footnote1 a Chinese software package, is used to count the frequency of occurrence of words in each of our six emotion keyword dictionaries in our news reports. As there are different volumes of articles in our research corpus each quarter, and these will be of different length, the number of emotion words in a particular category in a quarter cannot be compared with that for the same category in other quarters directly. As such we standardize all emotion word frequencies by total word count across all articles in that quarter, i.e., keyword dictionary category standardized word frequency =
(1)
(1)
To test our five-stage emotional trajectory asset pricing bubble theory we need to explore the relationship between the relative salience of our different investor emotions as reflected in media reports as the Chinese stock market bubbles evolve, burst and deflate. We do this by overlaying the quarterly frequency of words in the respective emotion category plotted in bar chart form on the daily value of the Shanghai Market Index. This allows the tracking of the dynamic relationship between the market index and investor emotions through each phase of the two bubbles. In particular, to aid interpretation, the value of the standardized frequency of the emotion words in each category for each quarter post-June 2005 when the bubble starts to take off is divided by its average value during the pre-bubble period from January 2005 to June 2005, and similarly using January to June 2014 for the 2014–2016 bubble. Specifically, the normalized frequency of the emotion words of each category plotted is transformed into a ratio i.e.:
(2)
(2)
Since all standardized emotion word frequencies are transformed to a relative value via the above equation, in the rest of the paper we just report normalized frequencies when describing our results.
6. Results
In this paper, we explore the extent to which investor emotions and fantasies are an integral part of asset pricing bubbles. This section presents our empirical results for the 2005–2008 Chinese stock market bubble in the form of the line and bar charts in . In each case, the Shanghai Stock Exchange Composite Index is represented by the primary axis (on the left side of the chart), and the respective normalized emotion frequency variable explored as the secondary axis (on the right-hand side) expressed as a percentage. Because of the inevitable noise in this process between quarters we average quarterly normalized emotion word frequencies for each phase of the bubble, and plot these as stepped horizontal lines on the charts. These we focus on in our empirical analysis.
Figure 3. The 2005–2008 Bubble: Shanghai Market Index vs Excitement.
This figure plots the quarterly normalized frequency of excitement words in the Chinese media in percentage terms in columns relative to the pre-bubble period (1.1.2005–30.6.2015) against the Shanghai Stock Exchange Composite Index (SSECI) between 1.7.2005 and 31.12.2008. The horizontal stepped line provides the average of the quarterly normalized frequencies for each of the five stages of the bubble. Correlation between quarterly increase/fall in the SSECI and normalized excitement word frequency = 0.96 (t = 12.6) significant at the 0.01% level.
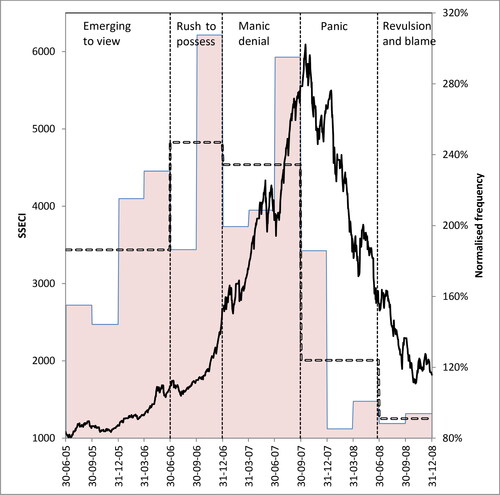
Figure 4. The 2005–2008 Bubble: Shanghai Market Index vs Anxiety.
See for key. Correlation between quarterly increase/fall in the SSECI and normalized anxiety word frequency = −0.48 (t = 1.87) significant at the 10% level.
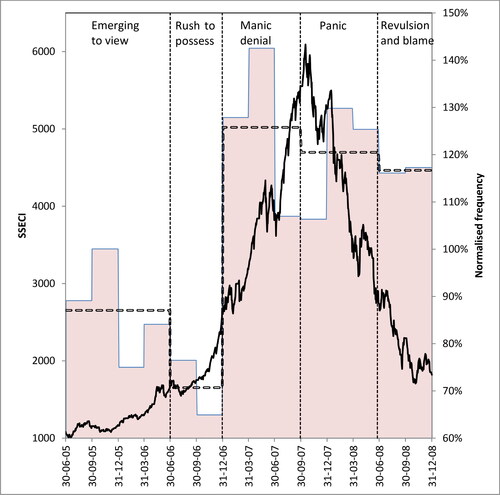
Figure 5. The 2005–2008 Bubble: Shanghai Market Index vs Mania.
See for key. Correlation between quarterly increase/fall in the SSECI and normalized mania word frequency = 0.33 (t = 1.23) not significant at conventional levels.
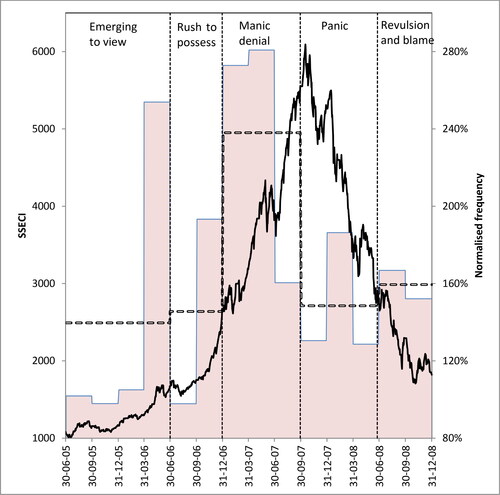
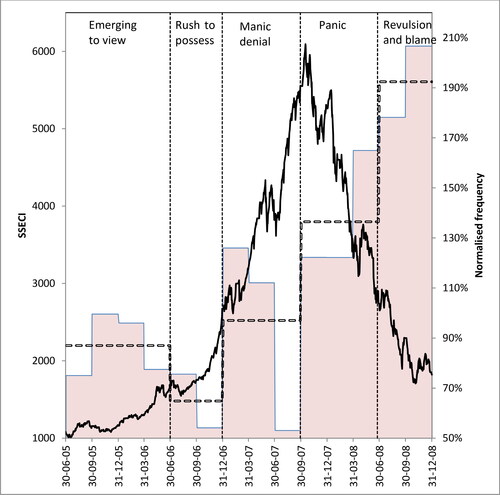
Figure 6. The 2005–2008 Bubble: Shanghai Market Index vs Denial.
See for key. Correlation between quarterly increase/fall in the SSECI and normalized denial word frequency = −0.80 (t = 4.60) significant at the 1% level.
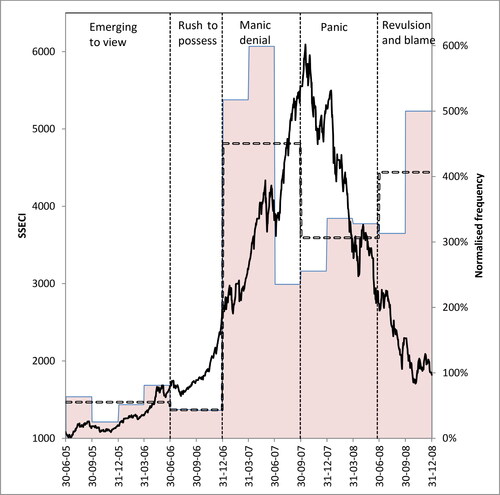
Figure 7. The 2005–2008 Bubble: Shanghai Market Index vs Panic.
See for key. Correlation between quarterly increase/fall in the SSECI and normalized panic word frequency = −0.66 (t = 3.02) significant at the 1% level.
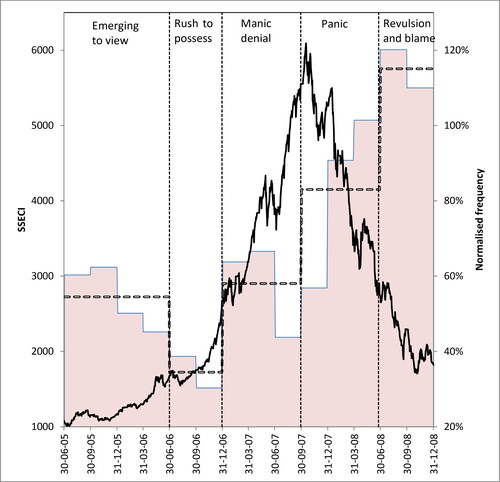
Figure 8. The 2005–2008 Bubble: Shanghai Market Index vs Revulsion and blame.
See for key. Correlation between quarterly increase/fall in the SSECI and normalized revulsion and blame word frequency = −0.76 (t = 4.09) significant at the 1% level.
6.1. Overview
P0: different investor emotional states are key to the understanding of an asset pricing bubble.
As outlined above our psychoanalytically-informed model of asset pricing bubbles is built around the idea of how the continuing search by investors for transformational phantastic objects can help explain their morphology as they unfold. Investors become increasingly aroused and stimulated as the bubble inflates and the phantastic object appears to be “real,” and this is then followed by their anger, despair and blame when the bubble bursts and the phantastic object turns out to be worthless.
To start to test our main prediction that investors’ emotional states are reflexive with the different stages of an asset pricing bubble, and plot our quarterly excitement and anxiety variables against the Shanghai Market Index between June 2005 and December 2008. As can be seen, levels of excitement and anxiety are broadly path-dependent and move in line with the market index in a way consistent with our expectations. At least during the market bubble the Chinese stock market appears to constitute a very emotional environment for investors which is confirmed in which plot levels of mania, denial, panic, and revulsion and blame against the market index. Corroborating this finding, correlations between quarterly market return and the average levels of our market emotion variables are all significant, with the exception of mania, in most cases at better than the 1% level, and all with the predicted sign.
Based on this initial analysis, we find evidence supportive of our main thesis as expressed in our prediction P0 that there is a clear relationship between the different emotions investors manifest at different stages of the 2005–2008 Chinese stock market bubble, and the market index. Our results are also consistent with the underlying idea that in such speculative bubbles investors appear to believe that the phantastic object they have been given license to search for and “find” is real. On this basis, we suggest that the associated visceral investor passions and antipathies unleashed in this process are a key component of asset pricing in bubble markets more generally. Our more-detailed predictions 1–5 are tested using our 2005–2008 data in the following sub-sections, and for the 2014–2016 bubble in section 7 below.
6.2. Emerging to view phase (July 2005 to June 2006)
P1: investor excitement will increase in line with the market index.
During this initial phase of the Chinese stock market bubble, we predict that Chinese stocks will begin to be viewed by investors as phantastic objects, and hypothesize an increase in the associated sense of enthusiasm about the stock market. shows how in line with an increase in the Shanghai Market Index of over 50% in this period the average normalized frequency of excitement emotion words in the media (the dashed line) is almost double (up 89%) its average pre-bubble level. Clearly the heating up of the Chinese market and levels of investor excitement are closely associated. Our empirical evidence is thus consistent with our prediction P1.
6.3. Rush to possess phase (July 2006 to December 2006)
P2: levels of excitement will continue to rise in line with the market index and anxiety fall.
Here, we predict an increasing headlong and compulsive desire among investors to speculate and not be left out, with media content reflecting this need directly. As the market shoots up, anxiety declines as prices are not yet so high that they appear implausible. During this 6-month period the Shanghai Market Index rises by 60% and, as shows, the average level of investor excitement (the dashed line) even increases further compared with the Emerging to view stage, now standing at 2.5 times the average for the pre-bubble period. In parallel, anxiety is at an exceptionally low level, as illustrates, only just over 70% of that of the pre-bubble period. Our empirical evidence is thus supportive of prediction P2.
6.4. Manic denial phase (January 2007 to September 2007)
P3: mania will rise to a peak in parallel with increasing levels of anxiety and denial.
In the third stage of the asset pricing bubble our model predicts that prices will continue to boom with stock valuations increasingly at variance with underlying reality and ultimately unmaintainable. Pursuit of the phantastic object will dominate investor thinking with any questioning voices dismissed as prices race to their peak. Crucially, any challenges to the wish-fulfilling fantasy that prices will continue to go up in effect for ever are denied even though on one level investors “know” the bubble has inevitably to implode.
In this state of manic denial the Chinese stock market more than doubles (up 108%) between January and September 2007 (and in fact by the time it peaks on October 16 it is up no less than 128% on its value at the start of the year). shows how the normalized frequency of mania words is, on average, almost 2½ times its value in the pre-bubble period (up 138%), and almost 2/3 higher (up 63%) compared with the rush to possess phase. Importantly for our main thesis, as predicted, shows how market-wide levels of investor anxiety, as measured by the normalized frequency of anxiety words used in Chinese media stock market reports, dramatically increase, despite, or more likely because of, the state of market euphoria. In fact, the dashed line shows how our average anxiety emotion variable is 125% that of the pre-bubble period, and up almost 4/5 (78%) compared with its average during the earlier rush to possess phase when emotions of excitement dominate. In line with this our average panic measure also increases significantly with showing a level 70% higher than in the rush to possess phase. Equally important for our bubble theory, shows how our proxy measure for denial (media “bubble” mentions) which is, not surprisingly, at a low level in both the pre-bubble period and the emerging to view and rush to possess phases now dramatically increases. In this phase of the bubble, the dashed line highlights how the normalized frequency of bubble words is over 9 times (9.14×) the average of the previous two market phases. As manifest by the contemporaneous more than doubling of the market index to its peak, Chinese investors appear to be turning a blind eye to what they don’t want to know (Steiner Citation1985) consistent with operating in a paranoid-schizoid state of mind and the Chinese market itself as a large virtual basic assumption group.
also shows how the normalized frequency of media mentions of “bubble” in Factiva between July and September 2007, immediately before the bubble bursts, falls to only 40% of that in the previous three months. This is despite the market index increasing in the quarter by almost a half (up 45%), or more than twice the rate of the previous quarter. This is consistent with journalists giving up trying to tell their audience what it clearly does not want to hear, or even may be reflecting how they themselves are caught up in the same process of denial?
Our empirical evidence is thus clearly in line with prediction P3; in the manic denial phase of the 2005–2008 bubble investor ability to reject underlying reality seems to be paramount in maintaining the emotionally-satisfying fantasy that the market can only continue to move in one direction and that is up.
6.5. Panic phase (October 2007 to June 2008)
P4: levels of mania and excitement collapse, and panic and anxiety rise to a high.
Ultimately, our model predicts, the bubble has to burst. External reality cannot continue to be avoided forever and the story that “this time it is different” is no longer credible, with the extreme stock valuations now seen as grounded only in fantasy. During this panic phase of the Chinese bubble with the Shanghai Market Index more than halving (down 56%) from its peak on October 16 to the end of June 2008, the phantastic object is now recognized as only a chimera. Investors seek to exit the market as quickly as possible in a state of panic. There is not only the pain of financial loss, but also that of having to give up such an exciting wish-fulfilling fantasy and associated belief that rapid accumulation of wealth with no actual effort is magically possible.
Not surprisingly, the level of investor mania collapses (), and similarly the level of excitement, with an average level only half (52%) the average of the rush to possess and manic denial phases (). Levels of anxiety are effectively unchanged compared with the stage of manic denial () even though the bubble has now burst. This again serves to emphasize how investors unconsciously “knew” the bubble must collapse eventually even if their actual investment behavior belies this. The normalized frequency of panic emotion words is now over 2/5 greater (43%) than in the immediately preceding manic denial phase (as indicated by the dashed line in ). In parallel now the bubble has burst and presumably is recognized for what it is the normalized frequency of bubble word mentions is down by a third (32%) compared with that of the previous phase (). This may also reflect how as the existence of the bubble can no longer be denied, “warnings” are redundant and “old news.” On this basis, the evidence presented in is generally supportive of the tenor of prediction P4.
6.6. Revulsion and blame phase (July 2008 to end 2008)
P5: revulsion and blame will be at its highest level.
We further predict that after the precipitous fall in stock valuations investors will experience feelings of shame and embarrassment for becoming involved in what ultimately turns out to be nothing more than a very painful fantasy. This is quite apart from the financial losses incurred particularly by those who enter the market after it has already taken off. Feelings of revulsion and blame will now predominate with investors looking for scapegoats to avoid having to acknowledge their feelings of guilt and responsibility for being caught up themselves in the bubble. shows how the average normalized frequency of revulsion and blame words in the media rises to a peak in the last 6 months of 2008 as the Shanghai Market Index collapses by a further third (34%). As such our empirical evidence is in line with our final prediction.
6.7. Review of empirical results for the 2005–2008 Chinese stock market bubble
encapsulates the empirical evidence supportive of our main thesis that asset pricing bubbles are very emotional market episodes, and that this needs to be considered in seeking to understand their morphology as they inflate and burst. Specifically, it describes the salient emotions of Chinese investors in different stages of the 2005–2008 Chinese stock market bubble using data visualization techniques. Each of the five glyphs in the figure plots the 6 emotions (excitement, anxiety, mania, denial, panic, and revulsion and blame) in during distinct stages of the bubble. Emotioni,scaled is scaled between 0 and 1 via the transformation: (Emotioni – Emotioni,min)/(Emotioni,max – Emotioni,min) where i is the respective emotion. As can be seen the glyphs vary significantly in shape illustrating how the salience of different investor emotions changes over the course of the bubble.
Figure 9. The 2005–2008 Bubble: Data visualization of investor emotions in different market states.
Each glyph plots the six emotions (Excitement, Anxiety, Mania, Denial, Panic, and Revulsion and Blame) in during different stages of the 2005–08 Chinese stock market bubble. Each emotion is scaled between 0 and 1.
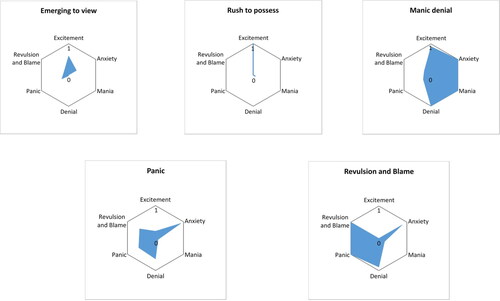
Specifically, in the Emerging to view phase (July 2005 – June 2006) levels of excitement increase leading up to the complete dominance of this emotion with no other emotions represented in the Rush to possess phase (July 2006 – December 2006), when the market went up by 60%. The dramatic Manic denial glyph (January 2007 – September 2007) when the market went up by over 100% is particularly interesting in that excitement is still at a peak but this is now accompanied by maximum levels of anxiety, mania and associated denial. The Panic phase (October 2007 – June 2008), when the market fell by over 50%, is dominated by the emotion of anxiety although panic, denial and revulsion and blame are also salient, with these emotions becoming extreme in the Revulsion and blame (July 2008 – December 2008) market state. Such graphical representations of the different market stages in the stock market bubble we explore in this paper are both consistent with its main prediction, and also illustrate its distinct emotional phases.
7. The 2014–2016 Chinese stock market bubble
As illustrates, over the 24 months from June 2014 to June 2016 the Shanghai Stock Exchange Composite Index closely resembles its trajectory during the 2005–2008 stock market bubble only a few years earlier. In this section we test whether our five-stage psychoanalytically-informed path-dependent model of asset pricing bubbles similarly explains this later bubble.
To test our model on this later period, we work with the same empirically derived set of emotion keyword dictionaries and download an average of 225 Chinese media articles from Factiva each month from January 2014 to June 2016 selected on a similar basis to that for the earlier period. We then conduct content analysis on this second research corpus in an identical way and construct our parallel variables using EquationEquations (1)(1)
(1) and Equation(2)
(2)
(2) above. The six months from 1 January 2014 to 30th of June 2014 constitute the pre-bubble period.
We plot our derived variables against the SSECI in a parallel way to . By inspection we split the 24 months of our second bubble period into five seemingly similar relatively distinct market states as in the case of the earlier bubble. The equivalent stages of this bubble, with associated market return given in square brackets are: Emerging to view (July – September 2014 [+15%]), Rush to possess (October – December 2014 [+37%]), Manic denial (January – June 2015 [+60% to peak on 12 June]), Panic (July 2015 – September 2015 [−40% from peak]) and Revulsion and blame (September 2015 – June 2016 [some volatility but market largely static]).
Finally, we average each of our six emotion normalized frequency variables across these different bubble stages to complete our graphs. Despite the second bubble taking place over only 24 months compared with the 42 months for the earlier bubble, and different government reactions to the respective market collapses, the equivalent graphs for the later bubble have a broadly similar pattern to for the 2005–2008 bubble.
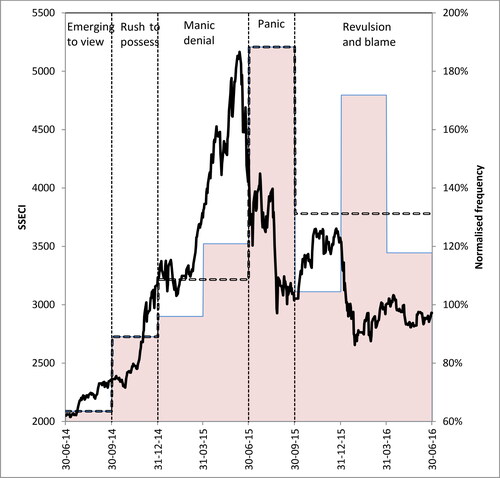
For illustrative purposes, plots the emotion normalized frequency of excitement against the Shanghai Market Index, and , the equivalent for anxiety (the other graphs are omitted for reasons of space). As can be seen, excitement levels move directly with the SSECI, although the peak is lower than in the earlier bubble. Anxiety levels remain well below those of the pre-bubble reference period during the Emerging to view and Rush to possess phases of the trajectory, only increasingly significantly during the Manic denial stage of the bubble, as in 2005–2008, and peaking during the Panic phase.
Figure 10. The 2014–2016 Bubble: Shanghai Market Index vs Excitement.
This figure plots the quarterly normalized frequency of excitement words in the Chinese media in percentage terms in columns relative to the pre-bubble period (1.1.2014–30.6.2014) against the Shanghai Stock Exchange Composite Index (SSECI) between 1.7.2014 and 30.06.2016. The horizontal stepped line provides the average of the quarterly normalized frequencies for each of the five stages of the bubble. Correlation between quarterly increase/fall in the SSECI and normalized emotion word frequency = 0.90 (t = 5.2) significant at the 0.01% level.
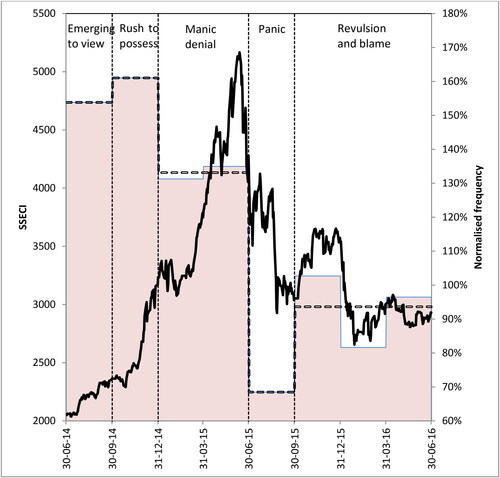
Figure 11. The 2014–2016 Bubble: Shanghai Market Index vs Anxiety.
See for key. Correlation between quarterly increase/fall in the SSECI and normalized anxiety word frequency = −0.87 (t = 4.3) significant at the 1% level.
To test whether the empirical evidence supports our psychoanalytically-informed theoretical model in the case of the 2014–2016 Chine stock market bubble, plots our six emotions scaled on the same basis as with in the form of parallel glyphs for the different stages of this later stock market bubble.
Figure 12. The 2014–2016 Bubble: Data visualization of investor emotions in different market states.
Each glyph plots the six emotions (Excitement, Anxiety, Mania, Denial, Panic, and Revulsion and Blame) during different stages of the 2014–16 Chinese stock market bubble. Each emotion is scaled between 0 and 1.
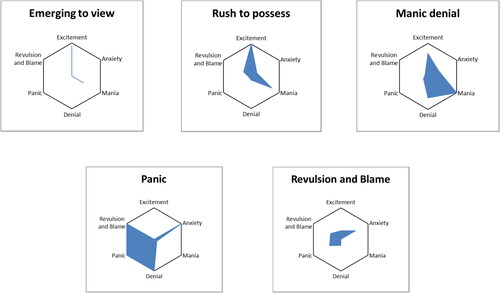
Referring to , in terms of prediction P1, the first glyph shows investor excitement is very high in line with the market index during the Emerging to view stage. In the case of the second glyph, levels of excitement are also at their peak during the Rush to possess phase of the bubble as predicted in P2, when the market goes up by almost 40% over the three-month period. However, in this case, investor anxiety does not fall completely away compared with the previous market stage, although still at very low levels compared with our pre-bubble period.
P3 predicts that during the Manic denial phase of a bubble, mania will peak together with increasing levels of anxiety and denial. This is exactly what the third glyph shows with mania at its peak, and associated levels of denial and anxiety much greater than in the Rush to possess phase. P4 predicts that after an asset pricing bubble bursts, panic and anxiety will rise to a peak, and levels of excitement and mania collapse. The fourth glyph relating to the Panic phase of the bubble directly reflects this. In addition, denial, or “not wanting to know,” also peaks, as do anxiety, revulsion and blame.
Only in the case of prediction P5 relating to the Revulsion and blame stage of the bubble do we find evidence not consistent with our predictions. Here, revulsion and blame does not peak. Albeit still higher than in the pre-bubble period, its average level is much lower than during the Panic stage. Nonetheless, the normalized frequency of revulsion and blame is again very high in the first three months of 2016 when the market collapses after rebounding by 20% in the last three months of 2015.
Although all investor emotions appear to be relatively muted during the Revulsion and blame phase of the 2014–2016 bubble, as the final glyph illustrates. to some extent this latter may reflect the manner in which the Chinese media reported on the attempts of the Chinese government to engineer a market rebound. These included suspending more than half the country’s stocks, preventing securities’ houses selling shares, public confessions on television by those deemed responsible for the market collapse, and implementation of circuit breaker trading restrictions, quickly rescinded, leading to fears investors would be locked in. In contrast, Chinese government action in response to the 2005–2008 bubble collapse was more muted with the media able to report relatively freely on the market as section 3.5 above illustrates.
In summary, our out-of-sample empirical evidence relating to the 2014–2016 Chinese stock market bubble is again consistent with the predictions of our psychoanalytically-informed path-dependent model of asset pricing bubbles. Our main prediction, P0, that: different investor emotional states are key to the understanding of an asset pricing bubble, is again supported.
8. Summary and conclusions
The goal of this paper is to explore the role investor emotions and market psychodynamics play in stock market bubbles both theoretically and empirically. Here, we seek to explain the psychodynamic drivers of the dramatic Chinese stock market bubbles of 2005–2008 and 2014–2016. Our premise is that being able formally to acknowledge the powerful fantasies and emotions speculative bubbles unleash in the minds of investors can only increase our understanding of these highly destructive economic events. Specifically, in our two case studies, we demonstrate how in the Chinese market, operating as a basic assumption group, investors’ need for excitement in their search for the phantastic object in a paranoid-schizoid state of mind, and superficially plausible legitimating stories, lead asset prices dramatically to depart from fundamental value. In particular, based on our explanatory theory, we develop a novel psychoanalytically-informed five-stage emotion-driven path-dependent model of asset pricing bubbles and test its degree of fit empirically with what happened in the Chinese stock market both between 2005 and 2008 and 2014 and 2016.
We demonstrate how initially the idea that “this time it’s different” can trigger a boom and state of market euphoria as stock prices rocket. With the market functioning as a basic assumption group reality is collectively fought against, and warning signs denied, to maintain the enormously exciting phantasy that the phantastic object is “real.” What we term manic denial, colloquially called mania, reigns. Inevitably, the real world has to intrude. Prices collapse and panic and flight follow with investors blaming the government and the authorities, whom they depended on, for their losses to avoid any feelings of personal responsibility and guilt. Not surprisingly, Chinese investors avoided the market for several years after the two bubbles, and, in fact, the Shanghai Stock Exchange Composite Index was still only standing at 60% of its level at its peak in October 2007 in December 2021.
Many economists deny asset pricing bubbles exist, being “highly improbable because ‘all the information is in the price’” (Aliber and Kindleberger Citation2015, 47), or alternatively consider them simply a fact of life like earthquakes which cannot be predicted and thus not worthy of study (Shulman Citation2016). In contrast, we argue such bubbles are perfectly explicable. This follows if instead of looking for patterns of rational economic activity we recognize that most financial decisions, as with most other decisions we make, are predominantly emotional and intuitive in nature (e.g., Kahneman Citation2012). Thus, an important contribution of our paper, we also believe, is to provide empirical evidence demonstrating the potential value of the formal analysis of investor emotions and market psychodynamics in helping to explain such extreme economic events.
Not much more than five years after the end of the 2005–2008 bubble the Shanghai Stock Market Composite Index again experienced a similar bubble, although of shorter duration. Importantly, the emotional trajectory of this Chinese stock market bubble “2.0” closely resembles that of the earlier bubble, with investors behaving in a similar way and our emotion-driven model of asset pricing bubbles equally fitting empirically. The interesting question we are forced to ask is why Chinese investors appear to be exhibiting the “compulsion to repeat” the earlier traumatic events (Freud Citation1920, 32) with no apparent learning from experience. This is an area for further research. It might also be interesting to explore other market bubbles including the ones current at the time of writing from a similar perspective.
Investors, it seems, may often be searching for phantastic objects. The predictable and potentially destructive both short-term and longer-term consequences when market environments implicitly encourage such unconscious fantasies to be acted out, as illustrated directly in the case of the Chinese stock market here, need to be formally recognized by policy makers and market regulators. Based on our analysis we suggest that asset pricing bubbles are not at all inevitable or even “unpredictable” when the key role unconscious fantasy plays in driving them is properly acknowledged. In this context, since the Chinese market is dominated by retail investors, further work might also explore whether different types of investor, including fund managers (e.g., Taffler, Spence, and Eshraghi Citation2017), are caught up in such magical thinking, which is “beyond all reason” (Hirshleifer Citation2020), in similar ways.
Acknowledgments
Earlier versions of this paper have benefited from the comments of numerous individuals including Niamh Brennan, Arman Eshraghi, the late and much missed Rob Gray, Andreas Hoepner, Mike Jones, Alok Kumar, Gulnur Muradoglu, Paul Ryan as well as participants at the British Accounting and Finance Association Conference, University of Aston, April 2011, the Financial Reporting and Business Communications Conference, University of Bristol, June 2013, the Behavioral Finance Working Group Conference, Queen Mary London, December 2013, the Discourse Approaches to Financial Communication Conference, Ascona, Switzerland, February 2014, the Discourse Studies in the Social Sciences Conference, University of Warwick, March 2014, the European Financial Management Association Meeting, Milan, 2018, the Paris Financial Management Conference, December 2018, Annual Conference of The Multinational Finance Society, Jerusalem, 2019, and at staff research seminars at The University of St. Andrews in February 2011, The University of Leicester Institute of Finance in February 2012, Middlesex University January 2013, The University of Edinburgh March 2016 and the University of Stirling May 2018. The authors also wish to thank the paper’s two referees who have helped to improve its contribution significantly and acknowledge the invaluable research support provided by Lin Tian, Ren Zixin, and Chenyang Wang.
Notes
1 Available at http://www.yuneach.com/soft/WordsCount.asp.
References
- Aliber, R. Z., and C. P. Kindleberger. 2015. Manias, Panics and Crashes. 7th ed. Basingstoke, UK: Palgrave Macmillan.
- Aren, S., and H. N. Hamamci. 2021. “Emotional Finance: Determinants of Phantasy.” Kybernetes 50 (5):1250–76. doi:10.1108/K-02-2020-0084
- Aspara, J., and H. Tikkanen. 2010. “The Role of Company Affect in Stock Investments: Towards Blind, Undemanding, Noncomparative and Committed Love.” Journal of Behavioral Finance 11 (2):103–13. doi:10.1080/15427560.2010.482880
- Bae, K.-H., and W. Wang. 2012. “What’s in a “China” Name? A Test of the Investor Sentiment Hypothesis.” Financial Management 41 (2):429–55. doi:10.1111/j.1755-053X.2012.01197.x
- Baker, S. R., N. Bloom, and S. J. Davis. 2016. “Measuring Economic Policy Uncertainty.” The Quarterly Review of Economics 131 (4):1592–636.
- Barberis, N., R. Greenwood, L. Jin, and A. Shleifer. 2018. “Extrapolation and Bubbles.” Journal of Financial Economics 129 (2):203–27. doi:10.1016/j.jfineco.2018.04.007
- Bion, W. R. 1952. “Group Dynamics: A Re-view.” The International Journal of Psychoanalysis 33:235–47.
- Brunnermeier, M. K., and M. Oehmke. 2013. “Bubbles, Financial Crises, and Systematic Risk.” In Handbook of the Economics of Finance, edited by G. M. Constanides, M. Harris, and R. M. Stulz, ch. 18, 1221–8. Amsterdam: North-Holland.
- Cassidy, J. 2002. Dot.Con: The Greatest Story Ever Told. London: Alan Lane/Penguin.
- Cheung, J. H. B. 2010. “Does Mr. Market Suffer from Bipolar Disorder.” Journal of Behavioral Finance 1114 (4):224–38. doi:10.1080/15427560.2010.527411
- Dougal, C., J. Engelberg, D. Garcia, and C. A. Parsons. 2012. “Journalists and the Stock Market.” Review of Financial Studies 25 (3):639–79. doi:10.1093/rfs/hhr133
- Engelberg, J. E., and C. A. Parsons. 2011. “The Causal Impact of Media in Financial Markets.” The Journal of Finance 66 (1):67–97. doi:10.1111/j.1540-6261.2010.01626.x
- Fama, E. 2014. “Two Pillars of Asset Pricing.” American Economic Review 104 (6):1467–85. doi:10.1257/aer.104.6.1467
- Fenzl, T., and L. Pelzmann. 2012. “Psychological and Social Forces Behind Aggregate Market Behavior.” Journal of Behavioral Finance 13 (1):56–65.
- Freud, S. 1920. Beyond the Pleasure Principle, Standard ed., Vol. 13, 1–64. London: Hogarth Press.
- Gamson, W. A., D. Croteau, W. Hoynes, and T. Sasson. 1992. “Media Images and the Social Construction of Reality.” Annual Review of Sociology 18 (1):373–93. doi:10.1146/annurev.so.18.080192.002105
- Greenwood, R., A. Shleifer, and Y. You. 2019. “Bubbles for Fama.” Journal of Financial Economics 131 (1):20–43. doi:10.1016/j.jfineco.2018.09.002
- Griffin, J. M., N. H. Hirschey, and P. J. Kelly. 2011. “How Important is the Financial Media in Global Markets?” Review of Financial Studies 24 (12):3941–92. doi:10.1093/rfs/hhr099
- Hageback, N. 2014. The Mystery of Market Movements: An Archetypal Approach to Investment Forecasting and Modelling. Singapore: John Wiley & Sons.
- Hageback, N. 2017. “Archetypes as Triggers of Financial Bubbles.” Journal of Behavioral Finance 18 (1):86–98. doi:10.1080/15427560.2017.1276582
- Henry, E. 2008. “Are Investors Influenced by the Way Earnings Press Releases Are Written?” Journal of Business Communication 45 (4):363–407. doi:10.1177/0021943608319388
- Henry, E., and A. J. Leone. 2016. “Measuring Qualitative Information in Capital Market Research: Comparison of Alternative Methodologies to Measure Disclosure Tone.” The Accounting Review 91 (1):153–78. doi:10.2308/accr-51161
- Hirshleifer, D. 2020. “Social Transmission Bias in Economics and Finance.” The Journal of Finance 75 (4):1779–831. doi:10.1111/jofi.12906
- Ho, B., and P. Liu. 2015. “Herd Journalism: Investment in Novelty and Popularity in Markets for News.” Information Economics and Policy 31:33–46. doi:10.1016/j.infoecopol.2015.04.004
- Kahneman, D. 2012. Thinking, Fast and Slow. London: Penguin Books.
- Klein, M. 1935. “A Contribution to the Psychogenesis of Manic Depressive States.” International Journal of Psychoanalysis 16:145–74.
- Klein, M. 1952. “Some Theoretical Conclusions Regarding the Emotional Life of the Infant.” In The Collected Works of Melanie Klein, 61–94, Vol. III. London: Hogarth Press.
- Kury, K. W. 2014. “You Paid How Much for That Dotcom Stock? Sensemaking during Ecological Change.” Economics, Management, and Financial Markets 9 (2):66–94.
- Loughran, T., and B. McDonald. 2011. “When Is a Liability Not a Liability? Textual Analysis, Dictionaries, and 10-Ks.” The Journal of Finance 66 (1):35–65. doi:10.1111/j.1540-6261.2010.01625.x
- Loughran, T., and B. McDonald. 2016. “Textual Analysis in Accounting and Finance: A Survey.” Journal of Accounting Research 54 (4):1187–230. doi:10.1111/1475-679X.12123
- Loughran, T., and B. McDonald. 2020. “Textual Analysis in Finance.” Annual Review of Financial Economics 12 (1):357–75. doi:10.1146/annurev-financial-012820-032249
- Neuendorf, K. A. 2017. The Content Analysis Guidebook. 2nd ed. Thousand Oaks, CA: Sage Publications Inc.
- O’Hara, M. 2008. “Bubbles: Some Perspectives (and Loose Talk) from History.” Review of Financial Studies 24:1, 11–17.
- Peress, J. 2014. “The Media and the Diffusion of Information in Financial Markets: Evidence from Newspaper Strikes.” The Journal of Finance 69 (5):2007–43. doi:10.1111/jofi.12179
- Quinn, W., and J. D. Turner. 2020. Boom and Bust: A Global History of Financial Bubbles. Cambridge: Cambridge University Press.
- Scherbina, A., and B. Schlusche. 2014. “Asset Pricing Bubbles: A Survey.” Quantitative Finance 14 (4):589–604. doi:10.1080/14697688.2012.755266
- Shiller, R. J. 2014. “Speculative Asset Prices.” American Economic Review 104 (6):1486–517. doi:10.1257/aer.104.6.1486
- Shiller, R. J. 2015. Irrational Exuberance. 3rd ed. Princeton: Princeton University Press.
- Shiller, R. J. 2017. “Narrative Economics.” American Economic Review 107 (4):967–1004. doi:10.1257/aer.107.4.967
- Shulman, M. E. 2016. “The Economy’s Favoured Children: The Narcissistic Relation and the Financial Crisis.” International Journal of Applied Psychoanalytic Studies 13 (1):24–52. doi:10.1002/aps.1408
- Steiner, J. 1985. “Turning a Blind Eye. The Cover up for Oedipus.” International Review of Psychoanalysis 12:1, 161–172.
- Taffler, R. J. 2018. “Emotional Finance: Investment and the Unconscious.” The European Journal of Finance 24 (7-8):630–53. doi:10.1080/1351847X.2017.1369445
- Taffler, R. J., C. Spence, and A. Eshraghi. 2017. “Emotional Economic Man: Calculation and Anxiety in Fund Management.” Accounting, Organizations and Society 61:53–67. doi:10.1016/j.aos.2017.07.003
- Tetlock, P. C. 2007. “Giving Content to Investor Sentiment: The Role of Media in the Stock Market.” The Journal of Finance 62 (3):1139–68. doi:10.1111/j.1540-6261.2007.01232.x
- Tetlock, P. C., M. Saar-Tsechansky, and S. Macskassy. 2008. “More than Words: Quantifying Language to Measure Fundamentals.” The Journal of Finance 63 (3):1437–67. doi:10.1111/j.1540-6261.2008.01362.x
- Tuckett, D. A., and R. J. Taffler. 2008. “Phantastic Objects and the Financial Market’s Sense of Reality, a Psychoanalytic Contribution to the Understanding of Stock Market Instability.” The International Journal of Psycho-Analysis 89 (2):389–412. doi:10.1111/j.1745-8315.2008.00040.x
- Uhl, M. W., and M. Novacek. 2021. “When It Pays to Ignore: Focusing on Top New and Their Sentiment.” Journal of Behavioral Finance 22 (4):461–79. doi:10.1080/15427560.2020.1821375
- Yao, S., and D. Luo. 2009. “The Economic Psychology of Stock Market Bubbles in China.” World Economy 32 (5):667–91. doi:10.1111/j.1467-9701.2009.01176.x
Appendix 1
– Chinese emotion dictionary dictionaries (with English translation)
激动 (Excitement)
大涨 (surge) 热潮 (upsurge) 翻番 (Doubling)连阳 (continues Yang) 强烈 (strong) 领涨 (leading up) 涨停 (limit-up) 热烈 (fervency) 强势 (mighty) 新高 (new high) 走牛 (bullish) 重大利好 (major benefits) 兴奋 (exciting) 领军 (leader) 获利丰厚 (largely profitable) 红 (red) 壮大 (expand) 振奋 (cheer up) 飞涨 (sharp increase) 全线上涨 (entirely increased) 蜂拥 (swarm) 高歌猛进 (rapid development) 高涨 (upsurge) 盛行 (prevail) 翻倍 (doubling) 繁荣 (prosperity) 劲扬 (powerful increase) 踊跃 (energetic) 非常好 (super) 崛起 (rising) 强劲增长 (strong growth) 强势反弹 (strong rebound) 异军突起 (sudden rise) 冲高 (sharp increase) 激发 (motivate) 红盘 (red plate) 最佳 (optimal) 高点 (high point)高档 (top grade) 热炒 (popular speculation) 收红 (closed in red) 高速增长 (rapid growth) 跃升 (jumped) 续升 (continues increase) 前所未有 (unprecedented) 迅猛 (rapid) 猛增 (surge) 激情 (passion) 火 (fire) 庞大 (tremendous) 蓬勃发展 (flourish) 热捧 (hot hands) 领头羊 (bellwether) 借机发挥 (opportunity to play) 屡创新高 (record highs) 潜力无穷 (great potential) 水涨船高 (when the river rises, the boat floats high) 赚钱效应 (money effect) (57)
焦虑 (Anxiety)
大跌(a large drop) 差(bad) 跌停(limit down) 低迷(downturn) 加剧(aggravate) 重挫(losing ground) 剧烈(drastic) 打击(strike) 遭遇(suffer) 避险(hedge)忧虑 (anxiety)跳水(dive) 绿(green) 大幅下跌(dramatic drop ) 领跌(some stocks lead the downside) 杀跌(sell the falling stock) 急跌(drop quickly) 警惕(cautious) 恶化 (deteriorate) 缩水(shrink) 警告(warning) 质疑(query) 警示(caution) 黑色 (black) 跌市(down market) 不安(uneasy) 变数(variation) 困境(dilemma) 套牢(entangle)偏离(deviate) 普跌(drop pervasively) 大幅震荡( sharp fluctuation) 大幅震汤(sharp fluctuation) 大幅振荡(sharp fluctuation) 颓势( declining tendency) 黑天鹅(black swan) 恶意做空(short maliciously) 贪婪(greed) 重创(hard hit) 大减 (a large decrease) 严峻(severe) 不看好(bad expectation)过度投机(over-speculation) 信心不足 (unconfident) 爆破(explosion) 被套(trap) 不景(recession) 失灵(be out of order) 顾虑(scruple) 退潮(ebb tide) 窘境(awkward situation) 倒退(reverse) 蹉跌(slip down) 背道而驰(run in opposite direction) 离场观望(on the side-lines) 得而复失(lose after having got it) 严重不足(serious shortage) (58)
疯狂 (Mania)
烧(burn) 牛市 (bull market) 火爆 (hot) 狂热 (fever) 升停板(up limit) 疯狂 (crazy) 强悍涨停 (strongly surged limit) 全面飘红 (all in the red) 重仓(heavy holdings) 翻天覆地 (earth-shaking) 急速扩大 (rapid enhancement) 飚升(soared) 暴增 (explode) 天量 (eye-popping) 爆发 (outburst) 火热 (hit) 人满为患 (packed) 奇迹 (miracle) 沸腾 (ebullition) 贷款 (loan) 抵押 (guaranty) 暴涨 (boom) 急升 (steep rise) 牛气冲天 (full of bull) 沸点 (boiling point) 狂飙 (madly increase) 暴红 (sharp red) 暴利 (excessive profit) 无可限量 (limitless) 气势如虹 (unstoppable) 满盘红 (plateful red) 全线暴涨 (soared across the board) 涨停板 (daily limit board) 神话 (myth) 巨大 (enormous) 嫉妒 (envy) 如火如荼 (in full swing) 急速上升 (rise extreme rapidly) 扶摇直上 (skyrocket) 狂欢 (carnival) 政策牛 (policy bull) 傲视全球 (the envy of the world) 冠全球 (global crown) 狂牛 (mad cow) 疯炒 (crazy speculation) 超级牛 (super bull) 巨量 (jillion) 火箭 (rocket) (48)
泡沫(Denial)
泡沫(bubble) 危机(crisis) 金融危机(financial crisis) 风暴(storm) 破灭(disillusion) 破裂(rupture) 终结(end) 泡沫破裂(the rupture of the bubble) (8)
恐慌 (Panic)
严重(terrible) 冲击(shock) 亏损(loss) 熊市(bear market) 跌破(drop below)新 (new low)抛售(dump)损失(damage)坏(bad) 恐慌(panic) 股灾(market disaster) 陷入(sink into) 熊(bear) 亏(loss) 损(harm) 失守(fall) 惨(miserable) 跌穿(drop below) 崩盘(market collapse) 蒸发(evaporate) 代价(at the cost of) 恐惧(fear) 损害(damage) 撤离(evacuate) 受损(be/been damaged)丧失(lose) 急挫 (slump quickly) 冲破(break through) 击穿(breakdown) 伤害(hurt) 损失惨重 (suffer great losses) 混乱(chaos) 糟糕(terrible) 狂泻(slump drastically) 强制平仓(mandatory unwind) 灾难(disaster)(36)
厌恶与责怪 (Revulsion and Blame)
冷(cold) 悲观(pessimistic) 离场(leave the market) 退出(exist) 沉重(a heavy heart) 冰(ice) 冷却(cooling down) 阴影(shadow) 离开(leave) 清淡(insipid) 无奈(can do nothing to help) 阴霾(haze) 痛苦(pain) 沉寂(quiet) 黯淡(gloom) 冷淡(coldness) 冬天(winter) 惨淡(dismal) 冷落(deserted) 一蹶不振(unable to get up after a fall) 惨痛(painful) 奢望(extravagant hopes) 沮丧(dispirited) 望而却步(shrink back at the sight of something dangerous or difficult) 疼(pain) 冷遇(a cold reception) 厄运(misfortune) 恶果(bad result) 失落(listless)走人(walk away) 噩梦(nightmare) 失宠(be out of favour) 淡漠(indifferent) 回撤(retracement)(34)