
 ?Mathematical formulae have been encoded as MathML and are displayed in this HTML version using MathJax in order to improve their display. Uncheck the box to turn MathJax off. This feature requires Javascript. Click on a formula to zoom.
ABSTRACT
Voltage violations are the main problem faced in distribution networks (DN) with a higher penetration of inverter-based generations (IBG). Active and reactive power control from smart inverters (SI) can mitigate such violations. Optimal power flow (OPF)-based control provides more accurate operating set points for the coordinated operation of SIs. Therefore, this paper presents a three-phase OPF-based control on SI-enriched unbalanced distribution networks. To consider this, first three-phase model using the current injection model (CIM) is developed. Later, the optimal active and reactive power set points for SIs are obtained by solving a quasi-dynamic optimization problem. The uniqueness of the proposed method is that it regulates the voltage at the affected nodes by obtaining the optimal set points for the smart inverter. The OPF is implemented with a mathematical CIM in Pyomo and solved using the Knitro solver. The proposed method is compared with the sensitivity-based Volt-Var Control (VVC), Volt-Watt Control (VWC), and combined VVC and VWC methods. The effectiveness of the proposed method is verified in a European low-voltage and CIGRE medium-voltage distribution network with 100% penetration. The analysis shows that the OPF-based control optimizes with less network loss and can maintain voltage violations with less reactive power support.
1. Introduction
The integration of inverter-based generations (IBG) into the low voltage (LV) power distribution network is increasing over time (IEA Citation2019). With a higher penetration of IBG, distribution networks experience many technical challenges, especially the increase in the voltage of the grid above critical values (Khodayar, Ramin Feizi, and Vafamehr Citation2019). In particular, voltage violations are an essential problem that needs to be addressed to incorporate a high penetration of IBG. Voltage violations are more noticeable when loads have a low/high power demand and IBG have high/low power generation (Wang, Yan, and Saha Citation2019). Furthermore, the inherent resistive nature (high R/X) of the LV network makes the voltage increase issue more vulnerable. Single-phase loads in LV networks are initially connected in different phases with the intention of maintaining balance in all phases. But with an increasing number of customers, the LV networks become unbalanced. And this will increase more when the single-phase IBG is connected to the LV networks. The optimal size and location (HassanzadehFard and Jalilian Citation2018) of such an IBG may solve some of the problems but not all of the challenges. Conventional voltage regulating devices (VRD), such as on-load tap changer transformers (OLTC), step voltage regulators, and switched capacitor/inductor banks may not be reliable solutions in such cases due to their limited capacity and slow operating response (Liu, Canizares, and Huang Citation2009). And they may not be effective in handling the voltage problem more precisely when the power fluctuation from IBG and loads is high.
One of the appropriate approaches to handling voltage problems in the LV distribution network is the application of active and reactive power control from smart inverters (SI) (Song and Kim Citation2022). Since SIs are equipped with an advanced communication and monitoring infrastructure, they are considered suitable for control and monitoring applications. Active and reactive power control from SI has its own advantages and challenges. Reactive power control is less effective in the case of LV networks, as this method increases network losses due to the high R/X ratio of the interconnecting lines. Also, the high value of R/X in LV networks limits the effect of reactive power control in LV networks (Nour et al. Citation2019). Moreover, the amount of reactive power contribution from the SI is limited, and hence it might not regulate the voltage within the acceptable range. Active power curtailment (APC) is considered another effective and efficient method of regulating voltage in LV networks (Nour et al. Citation2019; Singh and Lather Citation2020; Tonkoski and Lopes Citation2011) when power generation is extremely surplus and power curtailment is the only available solution. However, APC is not suitable for those instances where voltages are below the prescribed limits due to the unavailability of power production from IBG. Furthermore, the reduction in power generation to regulate voltage may not be a motivating factor to increase the integration of green energy. Therefore, it is recommended to take advantage of the power control capability of SI in an optimal way, minimize active power curtailment, and regulate voltage in LV distribution networks.
Controlling the output of active and reactive power from SI can be achieved using various methods (chaudhary and Rizwan Citation2018). Several studies on local control strategies are considered in the literature (Acosta et al. Citation2021; Ceylan, Paudyal, and Pisica Citation2021; Ghosh, Rahman, and Pipattanasomporn Citation2017; Kim, Song, and Jang Citation2020; Ku et al. Citation2015; Li et al. Citation2020; Molina-García et al. Citation2017; Nithara and Anand Citation2021; Wagle et al. Citation2021; Zhang, Ochoa, and Valverde Citation2018). Local control strategies are fast and can act with local settings to mitigate voltage problems. In addition, local control operates as an independent entity, so it does not require a huge investment in monitoring and controlling infrastructure. However, the main challenge of the local control technique is the lack of coordinated operation. Additionally, local control techniques suffer from the unequal contribution of SI for voltage regulation. The SI nearest to the substation contributes less, whereas the SI farther away from the substation bears more responsibility. Moreover, local control methods require information about the threshold settings for voltage and power for the controller to become effective. These settings for ,
, and
are defined in the IEEE 1547–2018 standard (IEEE standard 2020). Before implementing the control action, users can set these values based on the type and nature of the network under consideration.
The implementation of centralized methods is one of the solutions to problems related to the coordinated operation of multiple smart inverters (SIs). Since today’s SIs are equipped with advanced communication infrastructure, they can be used in centralized control without the additional financial burden of installing a communication system. Additionally, IEEE 1547–2018 requires that all SI have communication capabilities. Therefore, a centralized OPF-based strategy for inverter control may be practical in IBG-enriched distribution networks. When centralized control is implemented, optimal SI operation can be achieved. In (Weckx, Gonzalez, and Driesen Citation2014), a centralized optimization-based method is proposed to generate linear control functions for local controllers for reactive power control. In (Su, Masoum, and Wolfs Citation2014), the authors suggested using an OPF-based method to determine the optimal set points of active and reactive power for the inverters. Similarly, in (Zhao et al. Citation2015), an OPF-based formulation with adaptive weight on the objective function is used to ensure uniform curtailment. Recent studies combine centralized and distributed methodologies. To determine the ideal PV curtailment, the authors in (Ferreira et al. Citation2013) proposed a local control technique and a linear centralized optimization strategy based on sensitivity. Distributed control was suggested in (Olivier et al. Citation2016) to methodically regulate the reactive power and reduce the active power. In some recent studies, dynamic optimization is also performed considering dynamic load and PV model (Liu et al. Citation2022).
Although the OPF-based control approach is not a new field in the optimization of distribution networks. Several attempts have been made to formulate the optimization problem (ali 2019). However, in most of the earlier literature, modeling of the distribution network is given less priority. The mathematical model of the distribution network is done either considering the balanced network or using sensitivity-based modeling. The authors in (Ceylan, Paudyal, and Pisica Citation2021) proposed a local control strategy based on nodal sensitivity and the OPF-based method to regulate voltage using smart inverter reactive power control. However, the authors consider only the generic formulation of the OPF and solve the optimization problem by co-simulation. In (Ma et al. Citation2021), worst-case voltage scenarios are presented to reduce voltage fluctuations in distribution networks using centralized voltage control in a generally balanced distribution network. Modeling of the distribution network considering the balance nature and using single-phase modeling may not represent a realistic distribution network. Due to some specific characteristics of distribution networks, such as their radial nature, unbalanced operation, mixed loading models, and the number of nodes and branches, classical load flow models such as Newton-Raphason or Gauss-Seidal may not converge. To cope with such challenges in distribution networks, several three-phase power flow methods are proposed in the literature, such as the backward-forward sweep (BFS) (Bompard et al. Citation2000) and the current injection method (de Oliveira Alves et al. Citation2020) for distribution networks. The convergence of the BFS method is correlated with the size of the equivalent line impedance and the load admittance, which limits the application of BFS in a large unbalanced distribution network. Compared to BFS, the current injection method converges faster even for an unbalanced and heavily loaded three-phase network (Tostado-Véliz, Kamel, and Jurado Citation2021). Furthermore, the current injection method can be implemented with the measurement data of the energy meters installed in the distribution network. To consider this, the authors of (Alabri and Jayaweera Citation2020) modeling of the three-phase unbalanced distribution network use a current injection model. However, due to the reactive power limits of the smart inverter, controlling only the reactive power of the SI may not fully solve the voltage problems in a highly IBG-penetrated case.
In addition, the SI provides or absorbs reactive power to prevent voltage violations, which can increase network losses. Active power curtailment, although not desirable, may be used in conjunction with reactive power control to overcome the smart inverter’s capacity restriction. Proper coordination of the amount of reactive power and active power curtailment is an important factor to consider for optimal control using a smart inverter. Active and reactive power control can be implemented in a coordinated manner when other options are not available to mitigate voltage violations (IEEE standard 2020). The control of active and reactive power is considered in (Bozalakov et al. Citation2019), but the authors ignore the unpredictability of the PV power supply and load demand. Without considering the variability of generation and load, a realistic situation may not be represented. To the author’s best knowledge, active and reactive power control from multiple smart inverters considering unbalanced modeling of the distribution network with the focus on reactive power support from a smart inverter has not been studied in the literature. With increasing concern for reactive power auxiliary services (Tricarico et al. Citation2022) and real-time control (Wagle et al. Citation2022) in the distribution network, the analysis performed in this paper is of significant importance in choosing an optimal control approach. Therefore, in this paper, considering realistic data from IBG, load, and a three-phase unbalanced model of the distribution network, reactive and active power control based on OPF from an SI is proposed in an IBG-enriched distribution network. The optimal active and reactive set points for smart inverters are obtained by solving a quasi-dynamic constrained optimal power flow problem. The uniqueness of the proposed method is that it regulates the magnitude of the voltage at the affected nodes by obtaining the optimal set points of active and reactive power from the smart inverter.
Therefore, in this paper, considering the penetration of IBG (at all load buses), an OPF-based coordinated reactive power control and active power curtailment are proposed to mitigate voltage violations in the smart inverter-enriched distribution network. A fair comparison of the proposed method with the standalone Volt-Var Control (VVC), Volt-Var Control (VWC), and combined VVC and VWC-based control is performed. The main contribution of this paper is the formulation of optimal power flow-based reactive and active power control from SI considering modeling a three-phase unbalanced distribution network. The three-phase modeling of the system may represent a realistic distribution network. Therefore, the analysis of this model offers a more convincing analysis. Furthermore, since the use of the reactive power from SI increases network losses, the support of the reactive power from them is an important factor to consider. This paper focuses on the amount of reactive power support and network loss as major factors in evaluating the performance of control approaches. Using the proposed method, the distribution network can run with fewer network losses and keep the voltage profile within the set limits. This study seeks to create an accurate comparison based on the contribution of reactive power between control schemes. This research can help researchers in the reactive power market choose the best method to implement control approaches for smart inverters. The following are the major contributions of the authors in this work.
• An OPF-based approach is proposed to mitigate voltage violations in smart inverter-enriched three-phase unbalanced LV and MV distribution networks. To consider the unbalanced nature of the distribution network, three-phase modeling of the distribution network based on the current injection model is used. When solving the proposed OPF, coordinated set points for reactive power support and active power curtailment are obtained for multiple SIs to mitigate voltage violations.
• The formulation of the optimization model is considered based on the real-time data from the IBGs and the loads. The quasi-dynamic simulation over a period of the day with a 5-min resolution is performed.
• Furthermore, the OPF-based approach is compared with the standalone sensitivity-based Volt-Var Control (VVC), Volt-Watt Control (VWC), and combined VVC and VWC methods. A comparative analysis of the two methods is performed with respect to the voltage performance index, total network loss, total reactive power contribution, and the total amount of active power curtailment to make a fair comparison between the two different approaches.
• The contribution of reactive power support from the smart inverter is computed and analyzed for various control approaches on two highly IBG-penetrated distribution networks. According to the analysis, if the SI is equipped with a communication and monitoring infrastructure, the OPF-based method may be a suitable option to regulate voltage violations.
The remainder of the paper is organized as follows. Section 3 elaborates on the details of voltage control in SDN using local and central control methods. Section 4 describes the overall methodology for obtaining reactive and active power control based on OPF. Section 5 provides a detailed consideration of the test network, the simulation results, and the discussion. Finally, the main conclusions drawn from this paper are provided in the last section.
2. Methods of voltage control in smart inverter
Massive integration of IBG has the potential to alter the operation of power distribution networks so that the substation is no longer the exclusive source of electricity and short circuit capacity. The integration of IBG presents technical challenges, as power production and demand may not match. For example, exceeding the actual power injection more than the power demand may cause the voltage to rise above safe levels. Maintaining the voltage within the allowed range is essential to prevent damage to client appliances. As a result, numerous regulations, regulations, and voltage fluctuation limitations have been implemented. The limitations of voltage fluctuation are and
, respectively, according to EN 50,160 and ANSI C84.1–2011 standards (Nour et al. Citation2019). The techniques generally used to control the voltage in smart inverters are detailed in the following subsections.
3. Methods of voltage control in smart inverter
Massive integration of IBG has the potential to alter the operation of power distribution networks so that the substation is no longer the exclusive source of electricity and short circuit capacity. The integration of IBG presents technical challenges, as power production and demand may not match. For example, exceeding the actual power injection more than the power demand may cause the voltage to rise above safe levels. Maintaining the voltage within the allowed range is essential to prevent damage to client appliances. As a result, numerous regulations, regulations, and voltage fluctuation limitations have been implemented. The limitations of voltage fluctuation are and
, respectively, according to EN 50,160 and ANSI C84.1–2011 standards (Nour et al. Citation2019). The techniques generally used to control the voltage in smart inverters are detailed in the following subsections.
3.1. Local voltage control methods using smart inverter
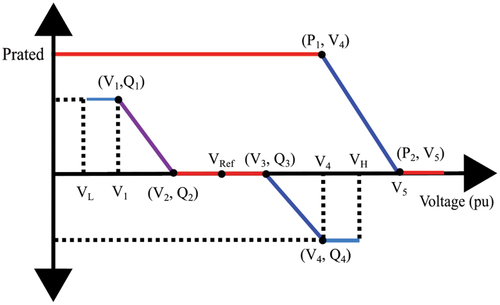
Smart Inverters (SI) can supply both inductive and capacitive reactive power to maintain the voltage profile (Srinivasarangan Rangarajan, Sharma, and Sundarabalan Citation2020) at the point of common coupling. For voltage control applications, the IEEE 1547–2018 standard (IEEE standard 2020) requires the active and reactive power output requirements of SI. According to this standard, SI can supply inductive or capacitive reactive power up to a maximum of 44% of the rated capacity. The application of only reactive power control might not effectively mitigate voltage violations. In addition, reactive power support affects network loss. Active power curtailment is not so desirable, as the owner suffers financially due to curtailment in power production. To effectively manage voltage violations, it is prudent to effectively coordinate reactive power control and active power curtailment. Therefore, in this paper, combined VVC and VWC are considered as a local voltage control method. Furthermore, instead of considering different types of IBG, for simplicity, only PVs are considered. This method is more focused on the operation of the SI and therefore remains independent of the type of IBG considered. EquationEquation (1)(1)
(1) (IEEE standard 2020) mathematically represents the combined VVC and VWC. In EquationEquation (1)
(1)
(1) ,
,
,
,
,
,
and
, are considered fixed quantities in this study and are capacitive 0.44 p.u., inductive 0.44 p.u., 0.92 p.u., 0.98 p.u., 1.02 p.u., 1.035 p.u. and 1.1 p.u.
and
are considered 0 p.u. during the normal voltage operation period, which is from 0.98 p.u. to 1.02 p.u., as the controller does not intervene during these periods.
and
are the rated power and the minimum allowable production during active power curtailment. The settings are selected considering the combined effect of the VVC and VWC control. The settings can also be optimally calculated, as in (Lee et al. Citation2020). For this analysis, all PVs in the network have the same VVC and VWC settings. shows the IEEE standard.
Figure 1. IEEE 1547–2018 standard (ieee standard Citation2020).
In Algorithm 1, the overall process of the combined operation of the Volt-Var control (VVC) and Volt-Watt control (VWC) modes in an SI is represented. The power flow is executed using OpenDSS and Matlab co-simulation. The bus voltages at the nodes where the IBG is installed are continuously monitored. Depending on the magnitude of the bus voltage, for all SIs in the network, the VVC is first implemented. After the implementation of the VVC, the power flow is executed again, and if the node voltage is not regulated by the application of the VVC, then the VWC is implemented in the SIs connected to the nodes where there are still voltage violations.
Algorithm 1
An algorithm for combined VVC and VWC of a Smart Inverter
Require: ,
,
,
,
,
Ensure: ,
,
,
,
1: while do Initialization
2: while do Implement VVC
3: if &
then
4:
5:
6: else if then
7:
8:
9: else if &
then
10:
11:
12: else if &
then
13:
14:
15: else if then
16:
17:
18: end if
19: end while
20: set and
and Run power flow
21: Obtain voltage after VVC
22: while Implement VWC
23: if &
then
24:
25: else if then
26:
27: end if
28: end while
29: set and
and Run power flow
30: Compute voltage after VWC
31: end while
3.2. Centralized voltage control methods in smart inverter
In a centralized control, the set points required for active power and reactive power are sent from a central controller. Reactive power support and active power curtailment to prevent voltage violations or to limit voltage within a certain voltage band are produced by optimal power flow solutions in centralized control. This optimization may be carried out by a centralized controller (Maharjan, Khambadkone, and Peng Citation2021) or by intelligent smart inverters that communicate with each other in a distributed manner (Wagle et al. Citation2023). Reactive power can only be delivered in a certain quantity. The portion of the inverter capacity reserved for reactive power may not be sufficient to maintain the voltage at acceptable levels during substantial active power generation. Moreover, the impact of the reactive power is constrained by the large R/X values in LV networks. Therefore, active power curtailment is necessary to avoid exceeding the upper voltage limit. Methods to reduce active power are suggested in (Kashani, Mobarrez, and Bhattacharya Citation2017; Noh et al. Citation2019). The owner of the IBG suffers directly from this curtailment since less power will be produced. Therefore, it is wise to use the available reactive power as efficiently as possible and to reduce the active power curtailment. This can be achieved by an OPF-based centralized controller using the penalty factor in the objective function. The process of achieving OPF-based reactive and active power control from the smart inverter is explained in Section 4
4. Overall methodology of OPF based reactive and active power control from smart inverter
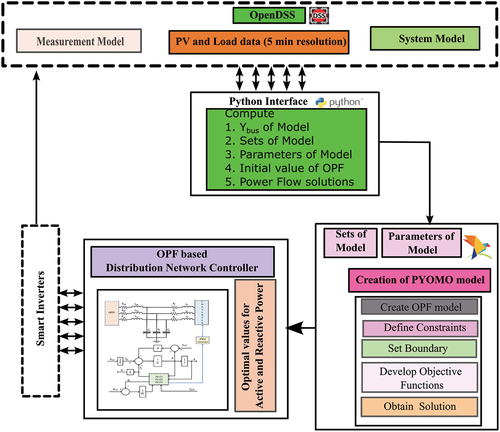
shows the overall method for optimal reactive and active power control from a smart inverter. The distribution network is first modeled in OpenDSS (EPRI Citation2007). Simulations collect power flow solutions based on test data defined in Section 5, network information (such as ), and sets and parameters of the optimization model. The optimization model consists of a number of user-defined functions that collect and process measurement data (obtained from energy meters installed on the test network) that are required for optimization. Pyomo is used to create a mathematical model based on the information obtained, as described in Sections 4.1 and 4.2. This work is inspired by (Rigoni and Keane Citation2019), which creates an open-source tool for optimal co-simulation between OpenDSS and Python. In reality, the reactive and active power of each instance obtained from the optimization is fed to the SIs, thereby completing the cycle of the overall process. However, in this work, the optimization model computes the optimal reactive and active power required to maintain the voltage profile. All monitored parameters are calculated from the mathematical model developed in this study. The simulation is performed in a time step of 5 min. The optimization process is carried out for a period of one day. A detailed description of the distribution network modeling and the formulation of the optimization model is described in the following subsections.
Figure 2. Overall block diagram to perform the OPF-based reactive and active power control in Smart Inverter.
4.1. Modeling of 3 phase unbalanced network
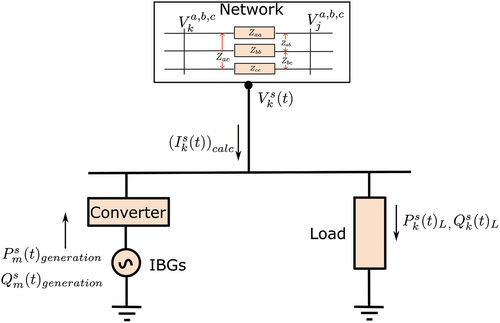
The formulation of a mathematical model of a three-phase unbalanced distribution network plays an important role in obtaining optimal voltage control (Rigoni and Keane Citation2020). In the power system, load flow problems are solved using the Newton-Raphson method or the fast decoupled method new- (Monticelli, García, and Saavedra Citation1990). However, due to some specific characteristics of distribution networks, such as their radial nature, unbalanced operation, mixed loading models, and the number of nodes and branches, the classical load flow models may not converge. To address the challenges in distribution networks, several three-phase power flow methods, such as the backward-forward sweep (BFS) (Bompard et al. Citation2000) and the current injection method (de Oliveira Alves et al. Citation2020) for distribution networks, are proposed in the literature. The convergence of the BFS method is correlated with the size of the equivalent line impedance and the load admittance, which limits the application of BFS in a large unbalanced distribution network. Compared to BFS, the current injection method converges faster even for an unbalanced and heavily loaded three-phase network (Tostado-Véliz, Kamel, and Jurado Citation2021). In this paper, the current mismatch method obtained from the current injection model is used to mathematically formulate the model. To simplify the modeling, neutral cables are explicitly neglected in this analysis. Nodal voltage phasors are represented in terms of active and reactive power injections/absorption from generators/loads by the current mismatch equations.
shows the simple layout to calculate the power injections considered in this paper. The loads and IBG are placed according to the planning and optimal locations in the distribution network as active and reactive power injections. Based on the loads and the generation of power from IBG obtained from the energy meters, the specified active and reactive power is calculated. The specified active and reactive power injections into the network with respect to the IBG connected to a bus and the load connected to a particular bus
in phase
and at time
is given by EquationEquation (2)
(2)
(2) and (Equation3
(3)
(3) ).
Figure 3. Current injection model.
where, is active power generation on the bus
for phase
and at time
,
is reactive power generation on the bus
for phase
and at time
,
,
are active and reactive load demands on the bus
for phase
and at time
.
The specified active and reactive power injections are related to the voltage phasors and the specified current injections. From EquationEquation (4)(4)
(4) and (Equation5
(5)
(5) ), real and imaginary parts of the specified current can be calculated.
where, is specified as active power injection in the bus
for phase
at time
.
is specified for reactive power injection in bus
for phase
at time
.
is Real part of specified current injection in bus
for phase
at time
.
is Imaginary part of specified current injection on bus
for phase
at time
,
is the voltage phasor of bus
for phase
at time
.
The calculated current depends on the property of the network and the nodal voltage of the network. From the calculated voltage and the network property, the calculated current can be calculated using EquationEquation (6)(6)
(6) and (Equation7
(7)
(7) ). The real and imaginary parts of the calculated current injections on the bus
for phase
and at time
are given in EquationEquation (6)
(6)
(6) and (Equation7
(7)
(7) ).
where is the set of network buses and
is the set of all phases
.
and
are the real and imaginary parts of the calculated current injections on the bus
for phase
and at time
.
and
are the real and imaginary parts of the voltage phasors at node
and phase
at time
.
and
are the conductance and susceptance between node
and
for phases
and
.
The difference between the calculated current and the specified current is considered the mismatch current. EquationEquation (8)(8)
(8) is the mismatch current at bus
for phase
and at time
.
where, and
are the calculated and specified current injections in the bus
for phase
and at time
.
4.2. Formulation of optimization model
A multistep control is proposed within a finite time horizon. It is assumed that the predicted values are capable of anticipating uncertainties in the IBG and loads along the time horizon. From these predicted values, the optimization model calculates the decision variables (reactive power and active power curtailment of the smart inverter in this case) to regulate SI in the network to overcome voltage violations and optimally utilize reactive power and active power curtailment (Weckx et al., Citation2014). The complex power output of the smart inverter is limited by the nominal apparent power rating of the inverter given by EquationEquation (9)
(9)
(9)
where is the power of the smart inverter connected to node
,
is the curtailed power of the smart inverter connected to node
,
is the reactive power produced/absorbed by the IBG at node
.
The smart inverter cannot curtail power more than the power produced by the IBG. Therefore, the power restriction can be between and the power produced at that instant. This adds to the constraint given by EquationEquation (10)
(10)
(10)
As it can be assumed that the inverter operates at a certain power factor at a particular instant in time, this also introduces a constraint that relates reactive power and active power production from PV as given by EquationEquation (11)(11)
(11)
In EquationEquation (11)(11)
(11) ,
is constant, which limits the ratio between the reactive and active power of the PV inverter. Smart inverters have a reactive power limitation. This limitation is given by EquationEquation (12)
(12)
(12) where
is the limiting value of the reactive power of the smart inverter considered in this paper.
is taken as
pu in this case.
As the objective is to limit the voltages in the network, the maximum limit () and the minimum voltage limit (
) are set as one of the constraints, as shown in EquationEquation (13)
(13)
(13) .
The objective of the proposed method is to regulate voltage violations by coordinating reactive power control and active power curtailment by a smart inverter. The objective of the controllers is also to curtail as little active power as possible. The unnecessary use of reactive power could result in higher losses. To avoid unnecessary use of reactive power, a small penalty factor for reactive power is added to the objective function. To ensure that active power curtailment dominates the penalty factor for reactive power, a penalty factor is included. The ultimate optimization challenge is described by EquationEquation (14)
(14)
(14) .
where is the overall simulation time period.
includes a day with a 5-minute time interval.
5. Simulation results and analysis
5.1. Test system
The proposed methodology is implemented in a European low voltage distribution network (LVDN) (European 2022) and a CIGRE medium voltage (MV) distribution network (Cigre Citation2014). This system is well known and represents a number of common distribution networks (Schneider et al. Citation2018). The original European LVDN has 906 nodes (including the substation node) and 905 branches. Among the 906 nodes, 55 nodes are used to connect different sizes of single-phase loads. To solve the optimization problem of the original European LVDN on a daily basis with a 5-minute time resolution, there will be 288 instances. The simulation is performed on an Intel (R) Core (TM) i5-8265 U CPU 1.8 GHz processor with 8 GB RAM, 64-bit operating system. The optimization process takes a significant time for convergence, and hence a reduced ordered European LVDN is considered in this analysis. The reduced ordered network operates under full load conditions without loss of critical network information, as studied in (Khan and Hayes Citation2022). In this way, optimization can be achieved faster. Reduced/modified European LVDN is shown in . The reduced network has 117 nodes (including a substation transformer) and 116 lines. The number of loads is considered the same as in the original LVDN. The summary of network information is shown in . The load data are taken from (European 2022; Schneider et al. Citation2018). Data for reduced European LVDN are available in IEEE Data Port (Khan and Hayes Citation2022).
Figure 4. Simplified European Low Voltage Test System (Khan and Hayes, Citation2022).
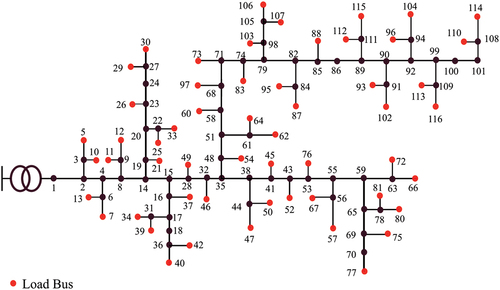
Table 1. European LV Test System.
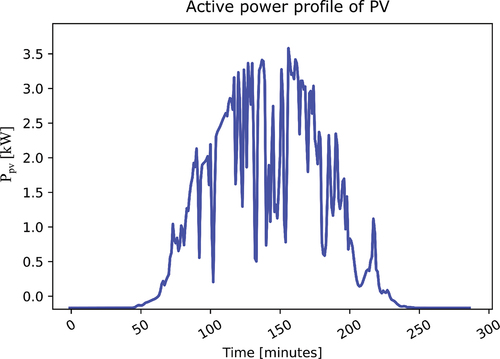
In this paper, PVs (PV) is considered an inverter-based generation (IBG). The power produced by each PV is considered to vary in nature throughout the day, as shown in . PV data is taken from(LV network models, Citation2014), which are processed for a 5-minute resolution and randomly scaled (multiplied by 2.5) to create intentional voltage violations in the network. Scaling is done to consider a case of very high PV penetration, which results in voltage violations. Therefore, 3.5 kW PVs are considered to be placed on all load buses in the network. Mitigating voltage violations resulting from the penetration of PV is the main scope of the study. In this analysis, it is assumed that all installed PVs follow the same profile throughout the day.
Figure 5. Active power profile of PV for a day at 5 mins resolution (LVnetwork 2017).
Similarly, in this study, the original CIGRE MV network is considered. However, to consider the study with very high penetration, all load buses are connected with inverter-based generations (IBG). The network property of the original network is considered the same. The size of the loads and IBG is calculated using the hosting capacity calculation performed in a separate study. The power profile of the PV system is considered the same, but the scaling factor of all PV systems in the network is considered the same and is equal to 300 kW. Furthermore, to consider the daily load profile of the loads, the load shape shown in is considered. This load shape is obtained by resampling the data for a winter of (Porsinger et al. Citation2017). By resampling the data, 5 min resolution data are created to fit the load profile for the OPF. For simplicity, the same load shape is considered for all loads. However, the load ratings are considered as given in . In the original test network, the network consists of residential and commercial loads, but in this study, the cumulative residential and commercial load is considered.
Figure 6. Load shape of loads on CIGRE MV network at 5 mins resolution (LVnetwork 2017).
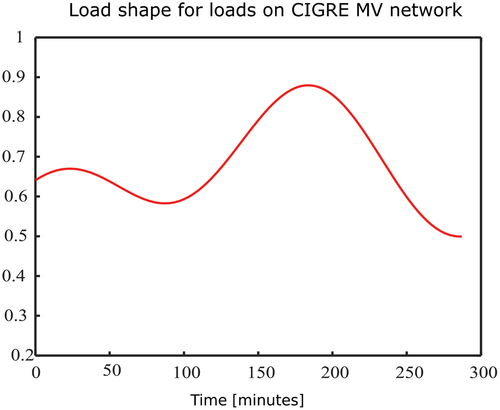
Table 2. CIGRE MV distribution network benchmark application: Load parameters.
5.2. Simulation of European LV distribution network with VVC, VWC, combined VVC and VWC method, and OPF-based control in smart inverter
For the OPF-based method, the optimization is developed in Pyomo and is solved using the Knitro solver. optimization results are processed to obtain the required observation variable. In the case of combined VVC and VWC, the simulation is first performed using Matlab and OpenDSS co-simulation. The control algorithm is programmed in a Matlab script. From the simulation, the output profiles for voltage, active power, reactive power, and active power curtailment are obtained for both cases. To see the effect of PV in the network, the simulation is performed without considering the penetration of PV and then considering the integration of PV. Later, control methods are implemented to obtain the desired output responses. The control methods are implemented separately; one for the combined VVC and VWC methods and another for the OPF-based method.
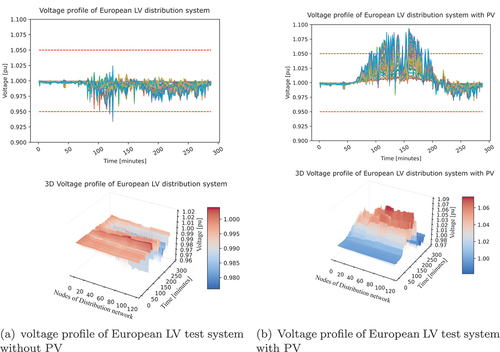
is the voltage profile without and with PV integration on a European LV network. For the load profile considered, the voltage profile is almost within the allowable limits without the integration of PVs. However, with the integration of 100% PVs, voltage violations are observed in the network. 3D plot for the voltage is also shown to provide a clear visualization of the voltage profile.
Figure 7. Voltage profile of European LV test system without PV and with PV penetration.
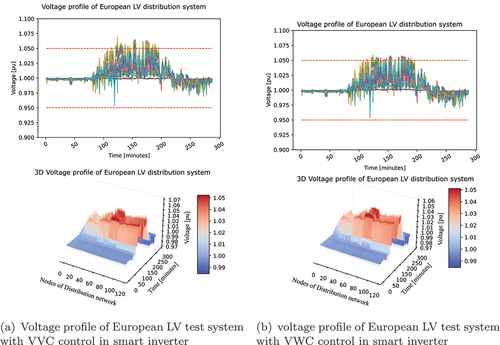
is the 2D and 3D plots for the voltage profile of the network with VVC and VWC based on sensitivity. From the figure, it is observed that the voltage profile is properly maintained by applying the VWC method. However, in VVC, the voltage is not maintained. This could be due to the capacity limitation of the smart inverter to support the reactive power. Therefore, in the case of extremely high power generation, where no other option is available to regulate the voltage, active and reactive power control from the smart inverter can be an option. However, to optimize the network operation, the OPF-based method or the combined VVC and VWC methods can be implemented.
Figure 8. Voltage profile of European LV test system with VVC and VWC control in smart inverter.
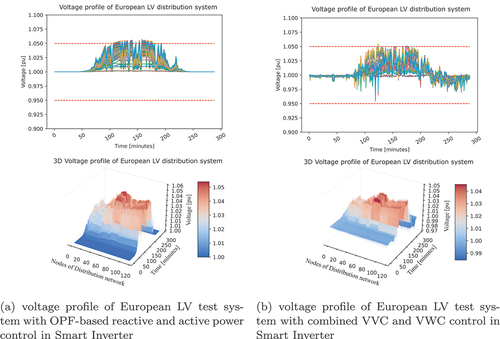
is the 2D and 3D plots for the voltage profile of the network with the OPF-based method and the combined VVC and VWC method. In the figure, it is observed that the voltage profile is properly maintained by applying the combined VVC and VWC method. But in the OPF-based method, the voltage is just above the upper limit boundary. This could be due to a small penalty factory introduced in reactive power in the objective function to prevent unnecessary use of the reactive power.
Figure 9. Voltage profile of European LV test system with OPF-based and combined VVC and VWC-based control in smart inverter.
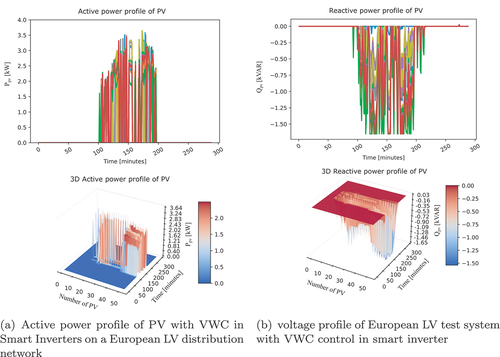
is the 2D and 3D plots for active power and reactive power profiles with the application of VWC and VWC. Active and reactive power from the smart inverters is obtained after the standalone VWC and VVC are implemented. Since in standalone VWC, no reactive power support is provided and in standalone VVC no active power is curtailed, the outputs for them are not presented here.
Figure 10. Active power and reactive power profile of PVs with VWC and VVC respectively.
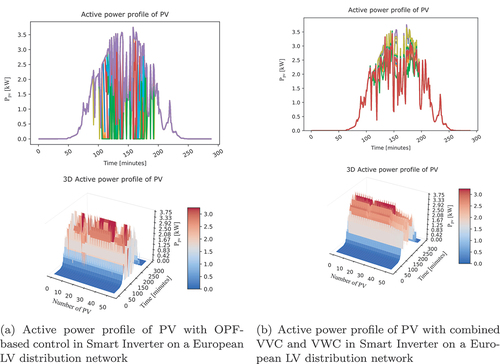
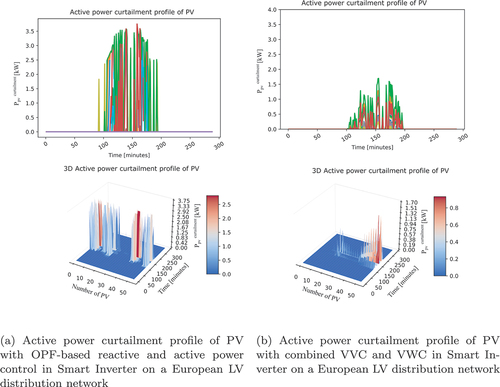
shows the active power profile in 2D and 3D after the implementation of the combined VVC and VWC method and the OPF-based method. The active power profile after the application of the control is obtained by subtracting the active power curtailment from the power produced. Because less active power is curtailed in the case of a combined VVC and VWC, the active power profile of the combined VVC and VWC has a nature similar to that of the power produced by PVs. Less power curtailment is observed in the combined VVC and VWC, as the voltage is first regulated by the VVC prior to the implementation of the VWC. However, in OPF-based methods, active power curtailment is achieved on the basis of optimization. The active power profile depends on the active power curtailment.
Figure 11. Active power profile of PVs with opf-based control and combined VVC and VWC in smart inverter on a European LV distribution network.
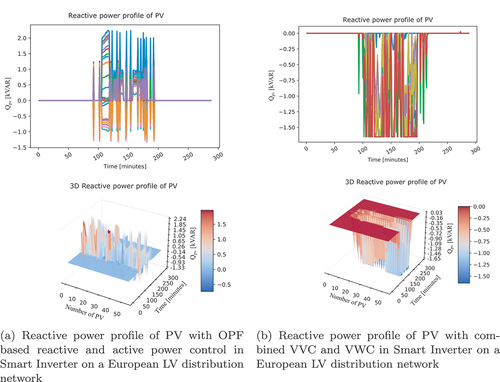
Similarly, shows the 2D and 3D profiles of the reactive power, respectively. Reactive power profiles are obtained from the application of the OPF-based method and the combined VVC and VWC method. In this study, the positive reactive power is considered to be a capacitive reactive power support and the negative reactive power is considered to be inductive. Voltage violations below the prescribed limit are supported by capacitive reactive power, whereas voltage violations above the prescribed limit are supported by inductive reactive power. Since in combined VVC and VWC, the reactive power support is implemented first, the smart inverter provides a greater amount of reactive power support to regulate voltage violations. In the OPF-based method, proper coordination results in lower reactive power support. With the OPF-based method, the reactive and active power of the smart inverter is controlled in a coordinated manner. A less reactive power contribution is observed to maintain the voltage profile.
Figure 12. Reactive power profile of PVs with opf-based control and combined VVC and VWC in smart inverter on a European LV distribution network.
shows the 2D and 3D profiles of the active power curtailment of smart inverters using two control approaches. In the case of combined VVC and VWC, the active power curtailment is implemented only if there are voltage violations even after the application of reactive power control. In the case of the OPF-based method, the active power curtailment is one of the optimization variables obtained from the optimization.
Figure 13. Active power curtailment profile of PVs with opf-based control and combined VVC and VWC in smart inverter on a European LV distribution network.
5.3. Simulation of CIGRE MV distribution network with sensitivity-based VVC and OPF-based control in smart inverter
Analysis has been done for the combined VVC and VWC on the CIGRE medium voltage network. However, the results obtained for combined VVC and VWC, show that only reactive power control (VVC) can mitigate the voltage violations due to the robustness of the CIGRE network, and active power curtailment is not required. To present comparable results, the network needs significant modifications. Therefore, the simulation results related to the power curtailment are not included in this paper. For this purpose, the optimization model for OPF-based control is developed using the same methodology implemented for the European LV test system. However, a small modification is made to remove the effect of active power curtailment in the formulation of the optimization problem. Similarly, sensitivity-based Volt-Var control (VVC) is achieved in a similar way. The results related to reactive power control are presented in the paper as shown in . These figures show that the voltage profile can be managed by applying only reactive power control.
Figure 14. Voltage profile of CIGRE MV distribution network without PV and with PV penetration.
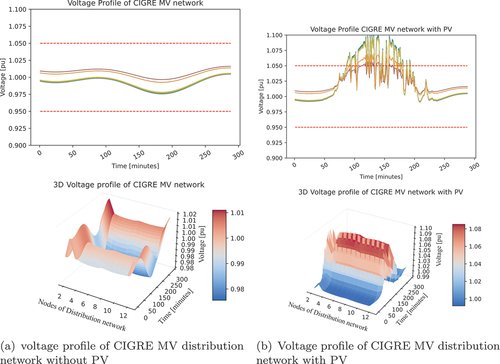
is the 2D and 3D plots for the voltage profile for the CIGRE MV network without and with PV. For the load profile considered, the voltage profile without PVs in the network is within the allowed limit. However, after the integration of PVs into the network, the voltage profile changes and some voltage violations are observed in the network.
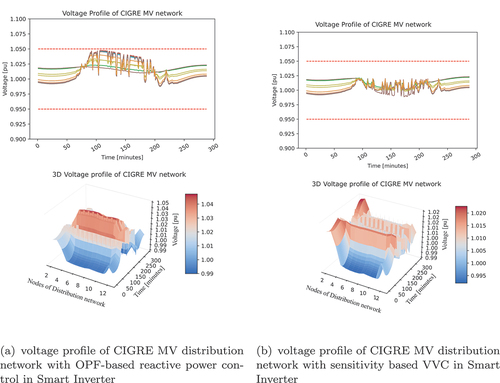
Similarly, is the 2D and 3D plots for the voltage profile for the CIGRE MV network with OPF-based reactive power control and VVC based on sensitivity. From the figure, it is observed that the voltage profile is properly maintained in both cases. However, in the OPF-based method, the voltage profile is compensated for so that less reactive power support is utilized.
Figure 15. Voltage profile of CIGRE MV distribution network with OPF-based and VVC control in smart inverters.
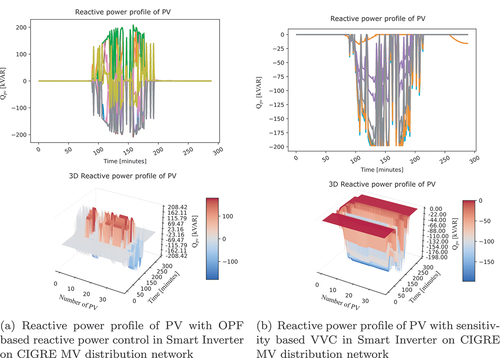
To show the effectiveness of the OPF-based method and the sensitivity-based method in terms of the contribution of reactive power, 2D and 3D plots for reactive power supports for both methods are presented in . In the case of the OPF-based method, a lesser contribution of reactive power is observed to maintain the voltage profile.
Figure 16. Reactive power profile of PVs in CIGRE MV distribution network with OPF based and VVC control in smart inverters.
5.4. Comparison of OPF-based control approach with sensitivity-based VVC, VWC, and, combined VVC and VWC
To compare the effectiveness of various control methodologies, performance indices such as the voltage performance index, total power loss, total contribution of reactive power, and total curtailment of active power are used. Detailed explanations of each comparison index are explained in the following way.
• Voltage performance index (VPI): The voltage performance index (VPI) is defined by the sum of the difference in voltages in phase of bus
at time
and the maximum allowable upper limit
(1.05 p.u. in this case). Mathematically, VPI is given by EquationEq. (15)
(15)
(15)
The lower value indicates that only a few voltage instances have violated the upper limit. Therefore, the lower the VPI index, the better the controller performance. Among the control approaches considered, the combined VVC and VWC have a better performance in terms of VPI. The higher value of the VPI in the case of the OPF-based method is due to a small penalty factor introduced in the reactive power in the objective function to prevent the unnecessary application of the reactive power.
• Total power loss: The total power loss in the network is obtained from the optimization and the co-simulation. Having a lower network loss is beneficial for the distribution system operator. On the other hand, a lower network loss also indicates that a lower current is flowing through the line. In cases where the network is marginally loaded, lowering the current flow can increase the capacity of the network to accommodate additional loads. The OPF-based method utilizes the reactive and active power in an optimal way so that total power loss is observed while using the OPF-based controller. In terms of total power loss, the OPF-based method is considered suitable to compare with the sensitivity-based VVC, VWC, and the combined VVC and VWC method.
• Active power curtailment: Another important performance index considered is active power curtailment (APC). APC is the amount of active power that is cut out to mitigate voltage violations. Although APC is not a desirable option as this method reduces the power production of PVs, this can be an option when other regulating solutions are not available. The lower the active power curtailment, the better the controller performance. The APC is calculated from the sum of active power curtailed from the smart inverter in each instance. A more active power curtailment is observed while using VWC and no APC in VVC. In combined VVC and VWC, active power curtailment is implemented only after the application of VVC, so fewer APCs are observed. However, among the approaches considered, the OPF-based method provides a less active power curtailment.
• Reactive power support: To avoid voltage violations, smart inverters can provide or absorb reactive power. In the case of a distribution network (high ), when the smart inverter provides reactive power to resolve voltage violations, there will be an increase in network losses. Therefore, it is crucial to identify the reactive power support from the smart inverter. Furthermore, with increasing concern for the reactive power market, the amount of reactive power support from the smart inverter is a significant index for comparison. The total contribution of reactive power is computed by taking the absolute value of the reactive power obtained to discard the effect of positive (capacitive) and negative (inductive) reactive power support in this study. Since in the OPF-based method, the active power curtailment and the reactive power support are optimally obtained, the smart inverter provides a combination of inductive and capacitive reactive power support in the OPF-based method. Reactive power support is not provided by the VWC method. However, in the case of the VVC and combined VVC and VWC methods, inductive reactive power support is provided, which will increase network loss.
The summary of the comparison of the different performance index for the methods considered is shown in . shows that the combined VVC and VWC methods provide better voltage performance and less active power curtailment. However, in this method, more network loss and more reactive power compensation are observed. Similarly, in the case of the OPF-based method, less network loss and less reactive power contribution are observed. In terms of reactive power support and total network loss, the OPF-based method is considered better than the combined VVC and VWC.
Table 3. Comparison of the performance of the OPF-based method with the combined VVC and VWC method in the European LV distribution network.
Similarly, the comparative analysis of various performance indices for the CIGRE MV network is presented in . From , it can be seen that the OPF-based method is more suitable than VVC based on sensitivity in terms of lower network loss and reactive power support.
Table 4. Comparison of the performance of the OPF-based method with sensitivity-based VVC method on CIGRE MV distribution network.
6. Conclusions
An OPF-based control to mitigate the voltage violations due to the high penetration of inverter-based generation in a smart inverter-enriched unbalanced distribution network is considered in this paper. The optimal set points for reactive power and active power curtailment to mitigate voltage violations are obtained using an optimization model developed in this study. This paper also compares the proposed method with the Volt-Var (VVC), Volt-Watt (VWC), and combined VVC and VWC methods. The main focus of the comparative study is to identify the amount of reactive power support from various approaches and to determine the possible impact on overall network loss and other performance indices. A fair comparison is made in terms of voltage performance index, active power loss, active power curtailment, and reactive power contribution from Smart inverters in a reduced European LV distribution network and CIGRE MV distribution network. The simulation demonstrates that various approaches may effectively address voltage violation issues. However, voltage violations are resolved through a combined VVC and VWC method with a lower voltage performance index (VPI) and less active power curtailment. A higher active power curtailment is observed with VWC only. The lower active power curtailment in combined VVC and VWC is due to the application of active power curtailment after the implementation of the possible reactive power support from the smart inverter. However, combined VVC and VWC produce a greater system loss in the network and a greater contribution of reactive power support from the smart inverter. On the other hand, the OPF-based method optimally utilizes reactive power support and active power curtailment, providing lower network loss and less reactive power support from smart inverters. In this paper, the contribution of reactive power support for various control strategies is considered a key differentiating factor when considering the type of suitable control approach. The authors believe that the analysis presented here is significant when there is growing concern about the ancillary reactive power service in the distribution network. OPF-based methods may be a good choice in the context of the growing economic concern about the reactive power of smart inverters and the advancement of smart inverters with intelligent monitoring and communication infrastructures.
The coordination of reactive and active power curtailment of smart inverters is the focus of this analysis. However, the application of other voltage-regulating devices in coordination with the smart inverter is left for future research. This method is modeled using real-time data sets obtained from energy meters installed on the distribution network. The proposed method can be more suitable for implementing a real-time control application, as they include real-time measurements to create the optimization model for obtaining the optimal set points. Real-time application of the proposed method is planned as future work.
Acknowledgements
The authors are very grateful to the Arctic Centre for Sustainable Energy (ARC) (project number 740108), UiT The Arctic University of Norway, Norway, for providing an environment for this research.
Disclosure statement
No potential conflict of interest was reported by the authors.
Data availability statement
The data that support the findings of this study in European LV network are openly available in at https://ieee-dataport.org/open-access/paper-reduced-electrically-equivalent-model-ieee-european-low-voltage-test-feeder http://doi.org/10.21227/0d2n-j565. The data that support the findings of this study in Cigre network are openly available in at https://cmte.ieee.org/pes-testfeeders/resources/. Derived data supporting the findings of this study are available from the corresponding author R.Wagle on request.
Additional information
Funding
References
- Acosta, M. N., F. Gonzalez-Longatt, M. A. Andrade, J. L. R. Torres, and H. R. Chamorro. 2021. Assessment of Daily Cost of Reactive Power Procurement by Smart Inverters. Energies 14 (16):4834. doi:10.3390/en14164834.
- Alabri, W., and D. Jayaweera. 2020. Voltage regulation in unbalanced power distribution systems with residential PV systems. International Journal of Electrical Power & Energy Systems 131 (September):107036. doi:10.1016/j.ijepes.2021.107036.
- Bompard, E., E. Carpaneto, G. Chicco, and R. Napoli. 2000. Convergence of the backward/forward sweep method for the load-flow analysis of radial distribution systems Int. International Journal of Electrical Power & Energy Systems 22 (7):521–30. doi:10.1016/S0142-0615(00)00009-0.
- Bozalakov, D. V., J. Laveyne, J. Desmet, and L. Vandevelde. 2019. Overvoltage and voltage unbalance mitigation in areas with high penetration of renewable energy resources by using the modified three-phase damping control strategy. Electric Power Systems Research 168:283–94. doi:10.1016/j.epsr.2018.12.001.
- Ceylan, O., S. Paudyal, and I. Pisica. 2021. Nodal Sensitivity-Based Smart Inverter Control for Voltage Regulation in Distribution Feeder. IEEE Journal of Photovoltaics 11 (4):1105–13. doi:10.1109/JPHOTOV.2021.3070416.
- Chaudhary, P., and M. Rizwan. 2018. Voltage regulation mitigation techniques in distribution systems with high penetration of photovoltaics: A review. Renewable and Sustainable Energy Reviews 82 (October):3279–87. doi:10.1016/j.rser.2017.10.017.
- Cigre. 2014. Benchmark Systems for Network Integration of Renewable and Distributed Energy Resources.
- de Oliveira Alves, G., J. L. R. Pereira, J. L. R. P. Guilherme, and J. Alves. 2020. A new unbalanced three-phase governor power flow formulation based on the current injections method. International Journal of Electrical Power & Energy Systems 123:106184. doi:10.1016/j.ijepes.2020.106184.
- EPRI, “Opendss.” [Online]. Available: http://smartgrid.epri.com/SimulationTool.aspx
- Ferreira, P. D. F., P. M. S. Carvalho, L. A. F. M. Ferreira, and M. D. Ilic. 2013. Distributed Energy Resources Integration Challenges in Low-Voltage Networks: Voltage Control Limitations and Risk of Cascading. IEEE Transactions on Sustainable Energy. 4 (1):82–88. Jan. doi:10.1109/TSTE.2012.2201512.
- Generation, Dispersed, and Energy Storage. 2020. IEEE Standard for Interconnection and Interoperability of Distributed Energy Resources with Associated Electric Power Systems Interfaces Amendment 1: To Provide More.
- Ghosh, S., S. Rahman, and M. Pipattanasomporn. 2017. Distribution Voltage Regulation Through Active Power Curtailment with PV Inverters and Solar Generation Forecasts. IEEE Transactions on Sustainable Energy 8 (1):13–22. doi:10.1109/TSTE.2016.2577559.
- HassanzadehFard, H., and A. Jalilian. 2018. Optimal sizing and placement of renewable energy resources in distribution systems considering time-varying electrical/heating/cooling loads using the PSO algorithm. International Journal of Green Energy 15 (2):113–28. doi:10.1080/15435075.2018.1423981.
- IEA. 2019. Renewables 2019: Analysis and forecasts to 2024. Paris: IEA. doi:10.1787/b3911209-en.
- Kashani, M. G., M. Mobarrez, and S. Bhattacharya,”Smart inverter volt-watt control design in high PV penetrated distribution systems,” 2017 IEEE Energy Conversion Congress and Exposition (ECCE), Cincinnati, OH, USA, 2017, pp. 4447–52, doi: 10.1109/ECCE.2017.8096764.
- Khan, M. A., and B. P. Hayes. 2022. A reduced electrically-equivalent model of the IEEE European low voltage test feeder. 2022 IEEE Power and Energy Society General Meeting (PESGM), Denver, CO, USA. IEEE. doi:10.1109/PESGM48719.2022.9916806.
- Khodayar, M. E., M. Ramin Feizi, and A. Vafamehr. 2019. Solar photovoltaic generation: Benefits and operation challenges in distribution networks. The Electricity Journal, 32 (4):50–57. Pages 50-57, ISSN 1040-6190. doi:10.1016/j.tej.2019.03.004.
- Kim, W., S. Song, and G. Jang. 2020. Droop control strategy of utility-scale photovoltaic systems using adaptive dead band. Applied Sciences 10 (22):1–17. doi:10.3390/app10228032.
- Ku, T. T., C. H. Lin, C. S. Chen, C. T. Hsu, W. L. Hsieh, and S. C. Hsieh. 2015. Coordination control of PV inverters for load transfer operation of distribution feeders with high penetration of PV installation. IEEE Transactions on Industry Applications 1–8. doi:10.1109/TIA.2015.2491268.
- Lee, H. J., K. H. Yoon, J. W. Shin, J. C. Kim, and S. M. Cho. 2020. Optimal parameters of the volt-var function in smart inverters for improving system performance. Energies 13 (9):13–16. doi:10.3390/en13092294.
- Li, P., J. Ji, H. Ji, J. Jian, F. Ding, J. Wu, and C. Wang. 2020. MPC-Based Local Voltage Control Strategy of DGs in Active Distribution Networks. IEEE Transactions on Sustainable Energy 11 (4):2911–21. doi:10.1109/TSTE.2020.2981486.
- Liu, M., C. A. Canizares, and W. Huang. May 2009. Reactive power and voltage control in distribution systems with limited switching operations. IEEE Transactions on Power Systems 24(2):889–99. doi: 10.1109/TPWRS.2009.2016362.
- Liu, K., H. Zhan, Y. Wei, and T. Kang. 2022. A dynamic optimization method for power distribution network operation with high-ratio photovoltaics. IET Generation, Transmission & Distribution 16 (21):4417–32. doi:10.1049/gtd2.12611.
- LV network models”, Low Voltage Network Solutions, 2014, [online] Available: http://www.enwl.co.uk/about-us/the-future/nialcnftier-1/low-voltage-Network-solutions
- Maharjan, S., A. M. Khambadkone, and J.C.H. Peng. 2021. Robust Constrained Model Predictive Voltage Control in Active Distribution Networks. IEEE Transactions on Sustainable Energy 12 (1):400–11. doi:10.1109/TSTE.2020.3001115.
- Ma, W., W. Wang, Z. Chen, and R. Hu. 2021. A centralized voltage regulation method for distribution networks containing high penetrations of photovoltaic power. International Journal of Electrical Power & Energy Systems 129 (December):106852. doi:10.1016/j.ijepes.2021.106852.
- Molina-García, Á., R. A. Mastromauro, T. García-Sánchez, S. Pugliese, M. Liserre, and S. Stasi. 2017. Reactive Power Flow Control for PV Inverter Voltage Support in LV Distribution Networks. IEEE Transactions on Smart Grid 8 (1):447–56. doi:10.1109/TSG.2016.2625314.
- Monticelli, A., A. García, and O. R. Saavedra. 1990. Fast decoupled load flow: Hypothesis, derivations, and testing. IEEE Transactions on Power Systems 5 (4):1425–31. doi:10.1109/59.99396.
- Nithara, P. V., and R. Anand. 2021. Comparative analysis of different control strategies in the microgrid. International Journal of Green Energy 18 (12):1249–62. doi:10.1080/15435075.2021.1897830.
- Noh, J., S. J. Kang, J. Kim, and J. W. Park. 2019. A Study of the Volt-Watt Mode of Smart Inverter to Prevent Voltage Rise with High Penetration of PV System. IEEE Power Energy Society General Meeting (PESGM) 2019:6–10.
- Nour, A. M. M., A. Y. Hatata, A. A. Helal, and M. M. El-Saadawi. 2019. Review of the mitigation techniques of voltage -violation of distribution networks with distributed rooftop PV systems. IET Generation, Transmission & Distribution 14 (3):349–61. doi:10.1049/iet-gtd.2019.0851.
- Olivier, F., P. Aristidou, D. Ernst, and T. V. Cutsem. March 2016. Active Management of Low-Voltage Networks for Mitigating Overvoltages Due to Photovoltaic Units. IEEE Transactions on Smart Grid 7(2):926–36. doi: 10.1109/TSG.2015.2410171.
- Porsinger, T., P. Janik, Z. Leonowicz, and R. Gono. 2017. Modeling and Optimization in Microgrids. Energies 10 (4):523. doi:10.3390/en10040523.
- Rigoni, V., and A. Keane,”Open-DSOPF (Software download)”, University College Dublin, 2019, [ online] Available:https://github.com/ValentinRigoni/Open-DSOPF
- Rigoni, V., and A. Keane. 2020. Open-DSOPF: An open-source optimal power flow formulation integrated with OpenDSS. 2020 IEEE Power & Energy Society General Meeting (PESGM), Montreal, QC, Canada, 1–5. doi:10.1109/PESGM41954.2020.9282125.
- Schneider, K. P., B. A. Mather, B. C. Pal, C. -W. Ten, G. J. Shirek, H. Zhu, J. C. Fuller, J. L. R. Pereira, L. F. Ochoa, L. R. de Araujo, et al. May 2018. Analytic Considerations and Design Basis for the IEEE Distribution Test Feeders. IEEE Transactions on Power Systems 33 (3):3181–88. doi:10.1109/TPWRS.2017.2760011.
- Singh, P., and J. S. Lather, ’Accurate power sharing, voltage regulation, and SOC regulation for LVDC microgrid with hybrid energy storage system using artificial neural network, International Journal of Green Energy, vol. 17, no. 12, pp. 756–69, 2020. 10.1080/15435075.2020.1798767
- Song, S. -H., and S. -B. Kim. 2022. Coordinated Reactive Power Control with a Variable Shunt Reactor and an Inverter-Based Wind Power Plant. Energies 15 (13):4739. doi:10.3390/en15134739.
- Srinivasarangan Rangarajan, S., J. Sharma, and C. K. Sundarabalan. 2020. Novel Exertion of Intelligent Static Compensator Based Smart Inverters for Ancillary Services in a Distribution Utility Network-Review. Electronics, 9 (4):662. 2020. doi:10.3390/electronics9040662.
- Su, X., M. A. S. Masoum, and P. J. Wolfs. 2014. Optimal PV Inverter Reactive Power Control and Real Power Curtailment to Improve Performance of Unbalanced Four-Wire LV Distribution Networks. IEEE Transactions on Sustainable Energy. 5 (3):967–77. July. doi:10.1109/TSTE.2014.2313862.
- Tonkoski, R., and L. A. C. Lopes. 2011. Impact of active power curtailment on overvoltage prevention and energy production of PV inverters connected to low voltage residential feeders. Renewable Energy 36 (12):3566–74. doi:10.1016/j.renene.2011.05.031.
- Tostado-Véliz, M., S. Kamel, and F. Jurado. 2021. Jurado F.Power flow solution of ill-conditioned systems using current injection formulation: Analysis and a Novel Method Int. International Journal of Electrical Power & Energy Systems 127:106669. doi:10.1016/j.ijepes.2020.106669.
- Tricarico, G., R. Wagle, M. Dicorato, G. Forte, F. Gonzalez-Longatt, and J. L. Reuda. 2022. Zonal Day-Ahead Energy Market: A Modified Version of the IEEE 39-bus Test System. IEEE Innovative Smart Grid Technologies - Asia (ISGT ASIA), Singapore. doi:10.1109/ISGTAsia54193.2022.10003588.
- Wagle, R., P. Sharma, C. Sharma, M. Amin, J. L. Rueda, and F. Gonzalez-Longatt. 2023. Optimal power flow-based reactive power control in smart distribution network using real-time cyber-physical co-simulation framework. IET Generation, Transmission and Distribution. doi:10.1049/gtd2.12786.
- Wagle, R., P. Sharma, C. Sharma, T. Gjengedal, and C. Pradhan. Mar 2021. Bio-inspired hybrid BFOA-PSO algorithm-based reactive power controller in a standalone wind-diesel power system. International Transactions on Electrical Energy Systems 31(3):e12778. doi: 10.1002/2050-7038.12778.
- Wagle, R., G. Tricarico, P. Sharma, C. Sharma, J. L. Reuda, and F. Gonzalez-Longatt. 2022. ’cyber-Physical Co-Simulation Testbed for Real-Time Reactive Power Control in Smart Distribution Network,’ in 2022 IEEE Innovative Smart Grid Technologies - Asia (ISGT ASIA), 01-05 November 2022, Singapore. doi:10.1109/ISGTAsia54193.2022.10003553.
- Wang, L., R. Yan, and T. K. Saha. 2019. Voltage regulation challenges with unbalanced PV integration in low voltage distribution systems and the corresponding solution. Applied Energy 256 (September):113927. doi:10.1016/j.apenergy.2019.113927.
- Weckx, S., C. Gonzalez, and J. Driesen. 2014. Combined central and local active and reactive power control of PV inverters. IEEE Transactions on Sustainable Energy 5 (3):776–84. doi:10.1109/TSTE.2014.2300934.
- Zhang, Z., L. F. Ochoa, and G. Valverde. 2018. A Novel Voltage Sensitivity Approach for the Decentralized Control of DG Plants. IEEE Transactions on Power Systems 33 (2):1566–76. doi:10.1109/TPWRS.2017.2732443.
- Zhao, J., A. Golbazi, C. Wang, Y. Wang, X. Lijian, and J. Lu. 2015. Optimal and fair real power capping method for voltage regulation in distribution networks with high PV penetration. 2015 IEEE Power and Energy Society General Meeting 1–5. doi:10.1109/PESGM.2015.7285971.